
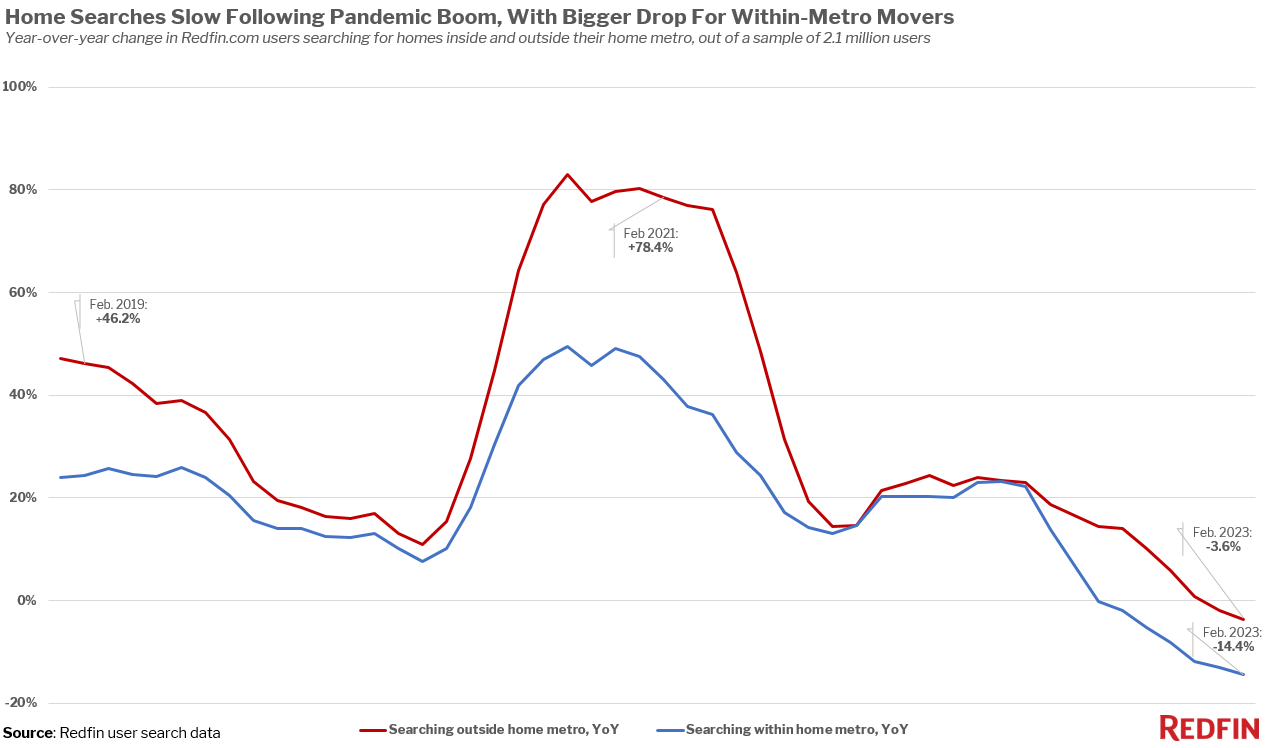
Redfin.com user search data shows that 14% fewer homebuyers looked to move within their own metro area than a year earlier in February, compared with a 4% drop for out-of-town movers.
The number of Redfin.com home searchers looking to relocate to a new metro fell 3.6% year over year in February. That compares with a 14.4% drop in Redfin.com home searchers looking to relocate within their current metro. Those are both the biggest declines in Redfin’s records, which go back through 2018.
Searches far from home have held up relatively well because elevated mortgage rates and the ongoing housing affordability crisis have pushed many homebuyers to more affordable metros.
The rise in mortgage rates has made purchasing a home more expensive almost across the board, but elevated rates often aren’t as big of a deterrent for relocating homebuyers because they’re typically moving to more affordable areas.
Someone moving from Los Angeles to Las Vegas, for instance, could buy a home comparable to the one they’re selling in Los Angeles for half the price. High rates don’t impact that buyer as much because they’re getting a cheaper house and may be using proceeds from a home sale in a more expensive area. People moving from one part of the country to another may also be doing so for a higher-paying job, which would help offset high mortgage rates.
Additionally, homebuyers relocating to a different part of the country may have a non-negotiable reason for their move: Maybe they are moving for that higher-paying job, or to be closer to family. High rates are less likely to deter those homebuyers than ones simply considering a different house within the same town.
Share of Buyers Looking to Move to a New Metro Is At a Record High
One-quarter (25.1%) of house hunters nationwide looked to relocate to a new metro in February, a record high. That’s up from 22.9% a year earlier and roughly 18% before the pandemic.
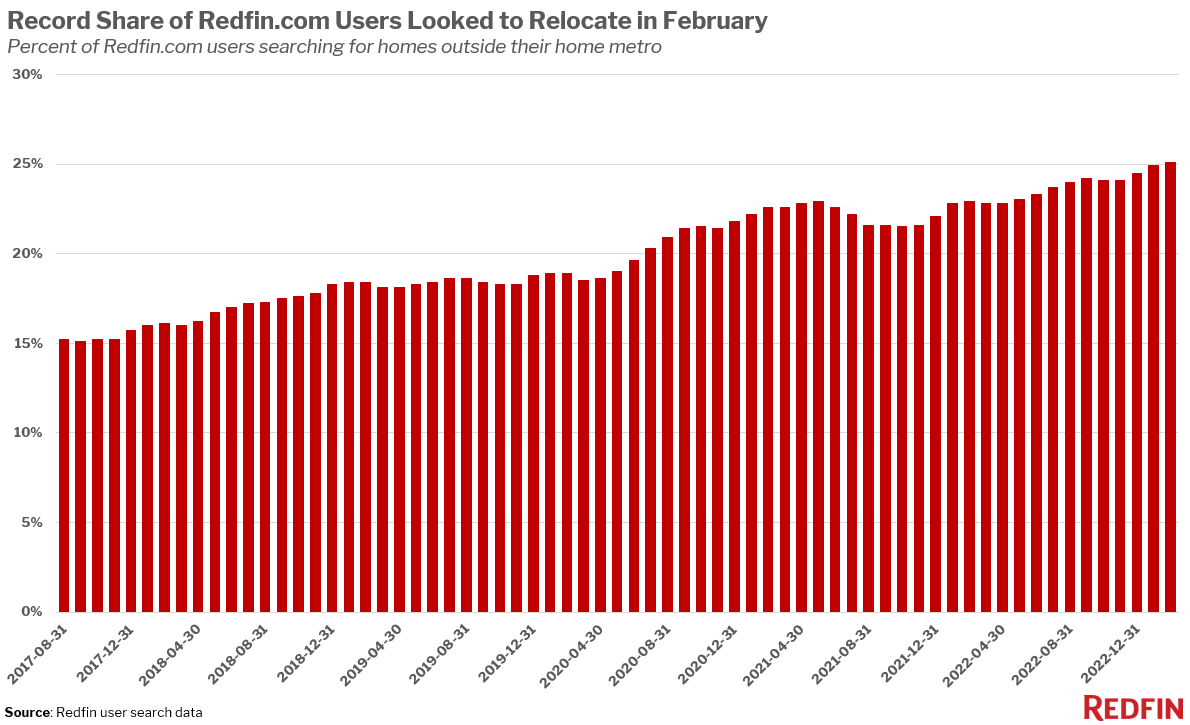
Relocators made up a bigger portion of homebuyers than ever because elevated mortgage rates, still-high home prices, inflation and economic uncertainty are motivating the few people who are still buying homes to move to more affordable areas. Remote work has also made it more feasible for Americans to relocate.
Although the median U.S. home sale price has started to fall on a year-over-year basis for the first time in over a decade , it’s still near the record high. And while mortgage rates have declined from their fall peak, they remain above 6%—significantly higher than a year ago. That has driven monthly housing costs up nearly 20% from a year ago.
Florida, other Sun Belt destinations are most popular with relocating buyers
Miami, Phoenix, Las Vegas, Sacramento, CA and Tampa, FL were the most popular destinations for house hunters looking to move to a different metro in February. Other parts of Florida and a couple Texas metros round out the top 10: Orlando, Cape Coral, Dallas, North Port-Sarasota and Houston. Popularity is determined by net inflow, a measure of how many more Redfin.com users looked to move into an area than leave.
Relatively affordable Sun Belt metros perennially top the list of places people are looking to move, due mainly to their comparatively cheap housing and warm weather.
While homes in these places cost considerably more than pre-pandemic, they remain comparatively affordable. The typical home in most of the popular destinations is less expensive than the typical home in the top origins. The typical Miami home sold for $485,000 in February, compared with $640,000 in New York, the most common origin for homebuyers looking to move in. And the typical Phoenix home sold for $425,000, compared with $710,000 Seattle, the most common origin.
“For buyers coming from the Bay Area or another expensive place, homes in Phoenix seem cheap. That’s why out-of-towners are still buying homes even though rates are high,” said Phoenix Redfin agent Heather Mahmood-Corley. “Desirable, well-priced homes are selling quickly, sometimes with a bidding war–largely because there are still so many buyers moving in from out of town.”
| Top 10 Metros Homebuyers Are Moving Into, by Net Inflow
Net inflow = Number of Redfin.com home searchers looking to move into a metro area, minus the number of searchers looking to leave |
|||||
| Rank | Metro* | Net Inflow, Feb. 2023 | Net Inflow, Feb. 2022 | Top Origin | Top Out-of-State Origin
|
| 1 | Miami, FL | 8,300 | 12,900 | New York, NY | New York, NY |
| 2 | Phoenix, AZ | 6,700 | 10,700 | Seattle, WA | Seattle, WA |
| 3 | Las Vegas, NV | 6,200 | 7,200 | Los Angeles, CA | Los Angeles, CA |
| 4 | Sacramento, CA | 6,100 | 7,800 | San Francisco, CA | Chicago, IL |
| 5 | Tampa, FL | 5,700 | 8,300 | New York, NY | New York, NY |
| 6 | Orlando, FL | 4,600 | 2,500 | New York, NY | New York, NY |
| 7 | Cape Coral, FL | 4,500 | 6,300 | Chicago, IL | Chicago, IL |
| 8 | Dallas, TX | 4,500 | 7,000 | Los Angeles, CA | Los Angeles, CA |
| 9 | North Port-Sarasota, FL | 4,300 | 5,800 | Chicago, IL | Chicago, IL |
| 10 | Houston, TX | 4,100 | 3,600 | New York, NY | New York, NY |
| *Combined statistical areas with at least 500 users searching to and from the region in December 2022-February 2023 | |||||
Eight of the 10 most popular destinations in February saw fewer Redfin.com users look to move in than than a year earlier. That’s because high mortgage rates dampened homebuyer demand, even in the most sought-after places.
House hunters are leaving expensive job centers
Homebuyers looked to leave San Francisco, New York and Los Angeles more than any other metro in February, followed by Washington, D.C. and Chicago. This ranking is determined by net outflow, a measure of how many more Redfin.com users looked to leave a metro than move in.
While San Francisco tops the list of places people are looking to leave, fewer homebuyers are leaving than a year ago. That may be partly because Bay Area home prices are falling.
Expensive coastal job centers typically top the list of places people are leaving. That trend became more pronounced in recent years as remote work allowed homebuyers to relocate to more affordable areas.
| Top 10 Metros Homebuyers Are Leaving, by Net Outflow
Net outflow = Number of Redfin.com home searchers looking to leave a metro area, minus the number of searchers looking to move in |
||||||
| Rank | Metro* | Net Outflow, Feb. 2023 | Net Outflow, Feb. 2022 | Portion of Local Users Searching Elsewhere | Top Destination | Top Out-of-State Destination
|
| 1 | San Francisco, CA | 30,300 | 41,800 | 25% | Sacramento, CA | Seattle, WA |
| 2 | New York, NY | 21,100 | 20,500 | 28% | Miami, FL | Miami, FL |
| 3 | Los Angeles, CA | 19,200 | 30,000 | 18% | Las Vegas, NV | Las Vegas, NV |
| 4 | Washington, D.C. | 16,100 | 17,200 | 19% | Miami, FL | Miami, FL |
| 5 | Chicago, IL | 7,000 | 6,900 | 17% | Miami, FL | Miami, FL |
| 6 | Boston, MA | 5,900 | 10,400 | 21% | Miami, FL | Miami, FL |
| 7 | Seattle, WA | 4,800 | 20,000 | 19% | Phoenix, AZ | Phoenix, AZ |
| 8 | Denver, CO | 3,900 | 4,000 | 34% | Chicago, IL | Chicago, IL |
| 9 | Hartford, CT | 2,800 | 700 | 75% | Boston, MA | Boston, MA |
| 10 | Portland, OR | 1,700 | 2,500 | 21% | Bend, OR | Phoenix, AZ |
| *Combined statistical areas with at least 500 users searching to and from the region in December 2022-February 2023 | ||||||
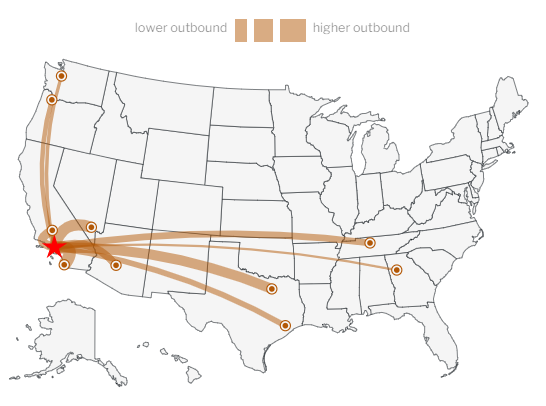
Below is a map of the most popular destinations for Redfin.com users who are leaving the Los Angeles metro. To view similar maps for the metros in this report and other metros, please visit the area’s Redfin housing market page and scroll down to the “migration” section.
Methodology
Our migration analysis is based on about two million Redfin.com users who viewed for-sale homes online across more than 100 metro areas from December 2022 to February 2023. To measure the share of homebuyers looking to relocate from one metro to another, we calculate the portion of overall home searchers that are migrants.
A Redfin.com user counts as a migrant if they viewed at least 10 for-sale homes in the third quarter and at least one of those homes was outside their home metro area. For instance, if a Redfin.com user based in Seattle views 10 homes in a three-month period and all of them are in Phoenix, that user counts as a full migrant to Phoenix. If a user based in Seattle views 10 homes in a three-month period and five are in Phoenix but five are in San Diego, that user counts as half of a migrant to Phoenix and half of a migrant to San Diego. If a user based in Seattle views 10 homes in a three-month period, nine in Seattle and one in Phoenix, that user counts as one-tenth of a migrant to Phoenix.
The analysis includes combined statistical areas with at least 500 Redfin.com users based in that region and at least 500 users searching for homes in that region. For instance, a user based in Seattle searching for a home in Phoenix counts toward the first condition, a user based in Phoenix searching for a home in Seattle counts toward the second condition, and a user based in Seattle searching for a home in Seattle counts toward both. Redfin’s migration data goes back to 2017.


