
The share of Redfin.com users moving away from their home metro is near its record high as 6%-plus mortgage rates and inflation cut into homebuying budgets. Places like Las Vegas and parts of Florida are especially popular.
Nationwide, 24.1% of homebuyers looked to move to a different metro during the three months ending in November, on par with the record high set in the summer and up from around 18% before the pandemic.
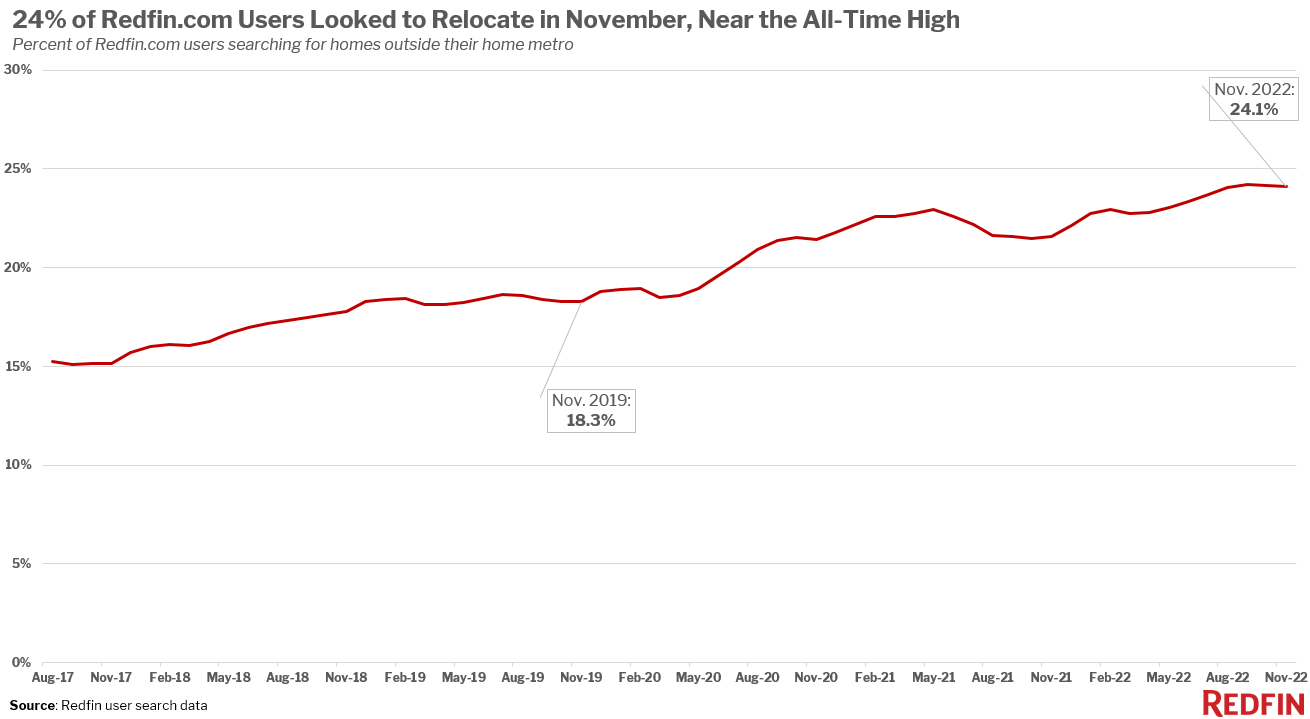
High mortgage rates and the uncertain economy are discouraging Americans from moving, with home sales down more than 30% from a year ago. But among the people who are still buying homes, one in four are searching outside their hometown, typically in relatively affordable areas. That’s largely because some remote workers are still relocating to more affordable parts of the country as high rates and inflation cut into their budgets.
Sacramento, the most popular migration destination in November, is an apt example. The Bay Area is the most common origin for homebuyers relocating to Sacramento. Though prices in the San Francisco Bay Area have started falling, the typical home still costs three times more than it does in Sacramento: Roughly $1.5 million versus $540,000. For a remote worker moving from the Bay Area to Sacramento, the much less expensive home prices help offset 6%-plus mortgage rates.
The flow of out-of-town buyers into popular destinations is slowing
Although the share of relocators remains essentially at its record high, the number of people moving to even the most popular destinations is falling amid high rates and economic woes. Fewer homebuyers looked to move to each of the 10 most popular migration destinations in November than a month earlier. Las Vegas, for instance, had a net inflow of 6,400 in November, down from 7,100 in October and 8,700 in September. Miami had a net inflow of 5,900, down from 6,700 in October and 8,000 in September.
“Las Vegas is still popular with out-of-town buyers, especially from coastal places like San Francisco, Los Angeles and Seattle who are seeking out lower home prices. But migration is slowing as the market cools,” said Las Vegas Redfin agent Tzahi Arbeli. “That’s partly because people are hoping for rates to come down before they move, and it’s also because people are worried about buying a home that may go down in value. From my point of view, there are a few upsides to buying now. There’s more to choose from than there used to be, sellers are willing to negotiate and prices have dropped from their peak.”
Sun Belt locations are popular with homebuyers
After Sacramento, Las Vegas was the most popular migration destination in November. It’s followed by Miami, Tampa and San Diego. Popularity is determined by net inflow, which is the number of people looking to move into a metro minus the number of people looking to leave.
Half of the 10 most popular destinations are in Florida, despite Hurricane Ian wreaking havoc in the state in late September. Nearly all of them are in the Sun Belt, with warm and sunny weather. The typical home in eight of the top 10 destinations is more affordable than in the most common origin for homebuyers moving in, and seven of the top 10 are places with no state income tax.
| Top 10 Metros Homebuyers Are Moving Into, by Net Inflow
Net inflow = Number of Redfin.com home searchers looking to move into a metro area, minus the number of searchers looking to leave |
||||
| Rank | Metro* | Net Inflow | Top Origin | Top Out-of-State Origin
|
| 1 | Sacramento, CA | 7,000 | San Francisco, CA | Chicago, IL |
| 2 | Las Vegas, NV | 6,400 | Los Angeles, CA | Los Angeles, CA |
| 3 | Miami, FL | 5,900 | New York, NY | New York, NY |
| 4 | Tampa, FL | 4,900 | New York, NY | New York, NY |
| 5 | San Diego, CA | 4,500 | Los Angeles, CA | Chicago, IL |
| 6 | Phoenix, AZ | 4,300 | Los Angeles, CA | Los Angeles, CA |
| 7 | Cape Coral, FL | 4,000 | Chicago, IL | Chicago, IL |
| 8 | North Port-Sarasota, FL | 3,700 | Chicago, IL | Chicago, IL |
| 9 | Dallas, TX | 3,600 | Los Angeles, CA | Los Angeles, CA |
| 10 | Orlando, FL | 3,300 | New York, NY | New York, NY |
| *Combined statistical areas with at least 500 users searching to and from the region in September-November 2022 | ||||
Homebuyers are leaving expensive job centers
More homebuyers looked to leave San Francisco, Los Angeles, New York, Washington, D.C. and Chicago than any other metro. That’s determined by net outflow, a measure of how many more Redfin.com users looked to leave an area than move in.
The places on this list haven’t changed much from previous months, as homebuyers typically leave expensive coastal areas in favor of more affordable inland places.
But the number of homebuyers looking to leave all 10 metros has declined from last month, reflecting the slow housing market and Americans’ general disinterest in moving while mortgage rates stay above 6%.
| Top 10 Metros Homebuyers Are Leaving, by Net Outflow
Net outflow = Number of Redfin.com home searchers looking to leave a metro area, minus the number of searchers looking to move in |
|||||
| Rank | Metro* | Net Outflow | Portion of Local Users Searching Elsewhere | Top Destination | Top Out-of-State Destination
|
| 1 | San Francisco, CA | 32,200 | 24% | Sacramento, CA | Seattle, WA |
| 2 | Los Angeles, CA | 30,400 | 20% | San Diego, CA | Las Vegas, NV |
| 3 | New York, NY | 20,800 | 27% | Miami, FL | Miami, FL |
| 4 | Washington, D.C. | 16,200 | 18% | Virginia Beach, VA | Virginia Beach, VA |
| 5 | Chicago, IL | 7,200 | 17% | Milwaukee, WI | Milwaukee, WI |
| 6 | Boston, MA | 6,000 | 18% | Portland, ME | Portland, ME |
| 7 | Detroit, MI | 3,400 | 30% | Cleveland, OH | Cleveland, OH |
| 8 | Denver, CO | 3,300 | 31% | Chicago, IL | Chicago, IL |
| 9 | Hartford, CT | 1,400 | 70% | Boston, MA | Boston, MA |
| 10 | Seattle, WA | 1,400 | 17% | Phoenix, AZ | Phoenix, AZ |
| *Combined statistical areas with at least 500 users searching to and from the region in September-November 2022 | |||||
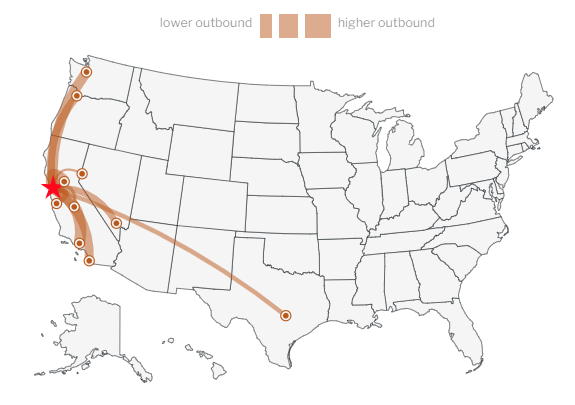
Below, we’ve included a map of the most popular destinations for Redfin.com users who are leaving the San Francisco metro. To view similar maps for the metros in this report and other metros, please visit the area’s Redfin housing market page and scroll down to the “migration” section.
Methodology
Our migration analysis is based on about two million Redfin.com users who viewed for-sale homes online across more than 100 metro areas from September 2022 to November 2022. When we say “November” in this report, we’re referring to the three months ending in November. To measure the share of homebuyers looking to relocate from one metro to another, we calculate the portion of overall home searchers that are migrants.
A Redfin.com user counts as a migrant if they viewed at least 10 for-sale homes in the third quarter and at least one of those homes was outside their home metro area. For instance, if a Redfin.com user based in Seattle views 10 homes in a three-month period and all of them are in Phoenix, that user counts as a full migrant to Phoenix. If a user based in Seattle views 10 homes in a three-month period and five are in Phoenix but five are in San Diego, that user counts as half of a migrant to Phoenix and half of a migrant to San Diego. If a user based in Seattle views 10 homes in a three-month period, nine in Seattle and one in Phoenix, that user counts as one-tenth of a migrant to Phoenix.
The analysis includes combined statistical areas with at least 500 Redfin.com users based in that region and at least 500 users searching for homes in that region. For instance, a user based in Seattle searching for a home in Phoenix counts toward the first condition, a user based in Phoenix searching for a home in Seattle counts toward the second condition, and a user based in Seattle searching for a home in Seattle counts toward both. Redfin’s migration data goes back to 2017.


