
The share of Redfin.com users looking to move to a different metro area is near its record high as high rates and prices up the appeal of affordable places. Coastal Florida is especially popular, even after getting pummeled by Hurricane Ian.
Nearly one-quarter (24.1%) of U.S. homebuyers looked to move to a different metro area in the three months ending in October, on par with the record high of 24.2% set in the third quarter. That’s up from roughly 18% in 2019, before the pandemic ushered in the remote-work era that gave many Americans more flexibility to relocate.
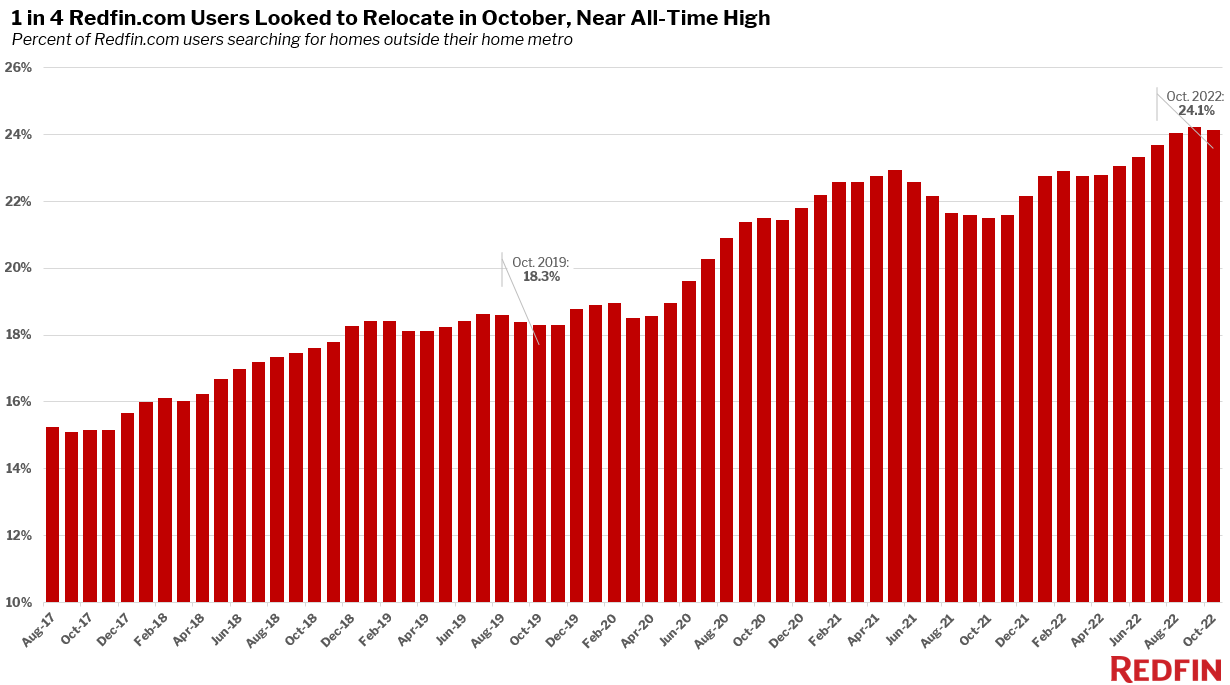
The U.S. housing market has cooled significantly during the second half of 2022 as high mortgage rates, inflation and a stumbling economy deter would-be homebuyers and sellers. But of the people who are still buying homes, an unprecedented portion are relocating to new metros. Many are seeking relative affordability as near-7% mortgage rates and persistently high home prices make expensive parts of the country even more expensive.
The average 30-year-fixed mortgage rate was 6.9% in October, up 3.83 percentage points from 3.07% one year earlier—the largest year-over-year increase during any month since 1981. That has caused monthly mortgage payments for homebuyers to roughly double from a year earlier. And while rates have come down slightly in November, they’re still significantly higher than they were last year.
Homebuyers are looking to move to the Sun Belt, especially Florida
Sacramento, Las Vegas and Miami were the most popular destinations for Redfin.com users looking to relocate, followed by San Diego and Tampa. Popularity is determined by net inflow, which is the number of people looking to move into a metro minus the number of people looking to leave.
Half of the top 10 migration destinations are in Florida (Cape Coral, North Port-Sarasota and Orlando are all on the list, in addition to Miami and Tampa). That’s despite the fact that the state was hit by Hurricane Ian, one of the deadliest, most destructive storms in U.S. history, in September.
Relatively affordable Sun Belt metros are typically most popular with relocating homebuyers, largely because buyers can get more home for less money. In Las Vegas, for instance, the typical home cost $410,000 in October, roughly half the price of the typical home in Los Angeles ($823,000)—the most common origin for people moving there.
| Top 10 Metros Homebuyers Are Moving Into, by Net Inflow
Net inflow = Number of Redfin.com home searchers looking to move into a metro area, minus the number of searchers looking to leave |
||||
| Rank | Metro* | Net Inflow | Top Origin | Top Out-of-State Origin
|
| 1 | Sacramento, CA | 7,800 | San Francisco, CA | Chicago, IL |
| 2 | Las Vegas, NV | 7,100 | Los Angeles, CA | Los Angeles, CA |
| 3 | Miami, FL | 6,700 | New York, NY | New York, NY |
| 4 | San Diego, CA | 6,500 | Los Angeles, CA | Chicago, IL |
| 5 | Tampa, FL | 5,600 | New York, NY | New York, NY |
| 6 | Phoenix, AZ | 4,700 | Los Angeles, CA | Los Angeles, CA |
| 7 | Cape Coral, FL | 4,600 | Chicago, IL | Chicago, IL |
| 8 | North Port-Sarasota, FL | 4,300 | Chicago, IL | Chicago, IL |
| 9 | Dallas, TX | 3,800 | Los Angeles, CA | Los Angeles, CA |
| 10 | Orlando, FL | 3,700 | New York, NY | New York, NY |
| *Combined statistical areas with at least 500 users searching to and from the region in August-October 2022 | ||||
Buyers are leaving expensive West Coast and East Coast cities
More homebuyers looked to leave San Francisco, Los Angeles, New York, Washington, D.C. and Boston than any other major metro. That’s determined by net outflow, a measure of how many more Redfin.com users looked to leave an area than move in.
Homebuyers typically leave expensive coastal job centers more than they leave other places, a trend that started before the pandemic and picked up steam due to remote work and rising housing costs. They most commonly head to more affordable regions. Sacramento, where homes cost less than half what they do in the Bay Area, is the most common destination for people leave San Francisco, for instance.
| Top 10 Metros Homebuyers Are Leaving, by Net Outflow
Net outflow = Number of Redfin.com home searchers looking to leave a metro area, minus the number of searchers looking to move in |
|||||
| Rank | Metro* | Net Outflow | Portion of Local Users Searching Elsewhere | Top Destination | Top Out-of-State Destination
|
| 1 | San Francisco, CA | 35,800 | 24% | Sacramento, CA | Seattle, WA |
| 2 | Los Angeles, CA | 34,100 | 20% | San Diego, CA | Las Vegas, NV |
| 3 | New York, NY | 22,400 | 27% | Miami, FL | Miami, FL |
| 4 | Washington, D.C. | 18,100 | 18% | Salisbury, MD | Salisbury, MD |
| 5 | Boston, MA | 7,800 | 19% | Portland, ME | Portland, ME |
| 6 | Chicago, IL | 7,300 | 17% | Milwaukee, WI | Milwaukee, WI |
| 7 | Detroit, MI | 4,200 | 32% | Cleveland, OH | Cleveland, OH |
| 8 | Denver, CO | 3,400 | 31% | Chicago, IL | Chicago, IL |
| 9 | Seattle, WA | 1,600 | 17% | Phoenix, AZ | Phoenix, AZ |
| 10 | Philadelphia, PA | 1,500 | 19% | Salisbury, MD | Salisbury, MD |
| *Combined statistical areas with at least 500 users searching to and from the region in August-October 2022 | |||||
Methodology
Our migration analysis is based on about two million Redfin.com users who viewed for-sale homes online across more than 100 metro areas from August 2022 to October 2022. When we say “October” in this report, we’re referring to the three months ending in October. To measure the share of homebuyers looking to relocate from one metro to another, we calculate the portion of overall home searchers that are migrants.
A Redfin.com user counts as a migrant if they viewed at least 10 for-sale homes in the third quarter and at least one of those homes was outside their home metro area. For instance, if a Redfin.com user based in Seattle views 10 homes in a three-month period and all of them are in Phoenix, that user counts as a full migrant to Phoenix. If a user based in Seattle views 10 homes in a three-month period and five are in Phoenix but five are in San Diego, that user counts as half of a migrant to Phoenix and half of a migrant to San Diego. If a user based in Seattle views 10 homes in a three-month period, nine in Seattle and one in Phoenix, that user counts as one-tenth of a migrant to Phoenix.
The analysis includes combined statistical areas with at least 500 Redfin.com users based in that region and at least 500 users searching for homes in that region. For instance, a user based in Seattle searching for a home in Phoenix counts toward the first condition, a user based in Phoenix searching for a home in Seattle counts toward the second condition, and a user based in Seattle searching for a home in Seattle counts toward both. Redfin’s migration data goes back to 2017.


