
- The typical Las Vegas home costs less than half as much as one in Los Angeles, San Francisco or Seattle, the most common origins for buyers moving in.
- Phoenix and Tampa are the next most popular destinations. Along with Las Vegas, they’re increasingly prone to natural disasters like heat and flooding, but relatively affordable.
- A record one-quarter of Redfin.com users looked to move to a different part of the U.S. in the second quarter, up from about 19% before the pandemic, as homebuyers continue to search out more affordable areas.
- More homebuyers are leaving San Francisco, New York and Los Angeles than any other metro.
A record one-quarter (25.5%) of Redfin.com users nationwide looked to move to a different metro area in the second quarter, up from roughly 23% a year earlier and about 19% before the pandemic.
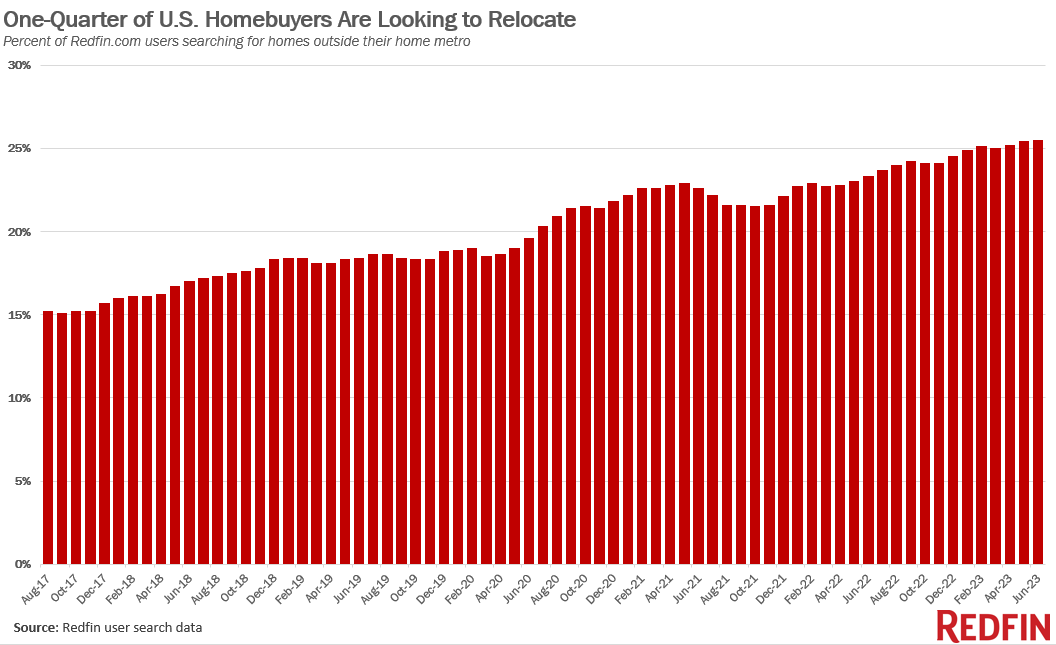
The data in this report is based on the searches of about two million Redfin.com users who viewed for-sale homes online across more than 100 metro areas from April 2023 to June 2023. Scroll down for full methodology.
Even though a record portion of homebuyers are relocating, there are fewer relocators than there were a year ago as high mortgage rates cool the overall housing market. The number of Redfin.com users moving to a different metro is down 7.5% year over year, a record decline but much smaller than the 18% decline for those staying within their current metro area.
Las Vegas is the most popular destination for relocating homebuyers, topping Redfin’s list for the first time. Buyers with the freedom and inclination to relocate are choosing Las Vegas largely because their money goes a long way there: Its typical home sells for $412,000, less than half the price of a home in Los Angeles, the most common origin for buyers moving to Las Vegas. It’s a similar story for the other popular migration destinations, which include Phoenix, Sacramento and several Florida metros.
Today’s elevated mortgage rates–the June average was 6.7%, up from 5.5% a year earlier and 3% in early 2022–have changed the dynamic of the overall housing market. High rates have slowed the market significantly since the pandemic homebuying frenzy, which was driven by record-low rates and remote work, but they have also upped the appeal of relatively affordable metro areas.
| Comparison of housing costs, June 2023: Las Vegas and the 3 most common origins of people moving there
The median monthly mortgage payment is calculated using the metro area’s median sale price and the average June mortgage rates of 6.7% |
||||
| Las Vegas, NV | 1. Los Angeles, CA | 2. San Francisco, CA | 3. Seattle, WA | |
| Median sale price | $412,000 | $975,000 | $1,405,500 | $826,000 |
| Median monthly mortgage payment | $2,721 | $6,439 | $9,281 | $5,455 |
Nearly all of the most popular destinations have cheaper homes than the places out-of-towners come from
After Las Vegas, Phoenix and Tampa, FL are the most popular destinations for Redfin.com users moving to a different metro area. Popularity is determined by net inflow, a measure of how many more Redfin.com users looked to move into an area than leave.
Five of the 10 most popular destinations are in Florida. All have warm climates, with many facing increasing risk of natural disasters like flooding and heat. Phoenix, for instance, was under an excessive heat warning for much of July.
But 9 of the 10 most popular destinations have lower median sale prices than the most common origin of buyers moving in, and many homebuyers are more motivated by affordability than other factors in choosing where to live.
A recent Redfin survey found that just 4% of U.S. residents who moved to a new metro in the last year did so because they were concerned about the impact of climate change on their previous area, compared with 20% who moved for a lower overall cost of living, 15% who wanted a better deal on a home and 13% who couldn’t afford a home/the cost of living in their previous area. The Redfin-commissioned survey was conducted by Qualtrics in May and June 2023; the results reported here consist of the 884 respondents who indicated that they moved from one metro area to another in the previous 12 months. Respondents could select more than one reason for their move.
| Top 10 Metros Homebuyers Are Moving Into, by Net Inflow
Net inflow = Number of Redfin.com home searchers looking to move into a metro area, minus the number of searchers looking to leave |
|||||
| Rank | Metro* | Net Inflow, Q2 2023 | Net Inflow, Q2 2022 | Top Origin | Top Out-of-State Origin
|
| 1 | Las Vegas, NV | 5,700 | 6,700 | Los Angeles, CA | Los Angeles, CA |
| 2 | Phoenix, AZ | 5,300 | 7,400 | Seattle, WA | Seattle, WA |
| 3 | Tampa, FL | 5,000 | 8,300 | New York, NY | New York, NY |
| 4 | Orlando, FL | 4,900 | 1,200 | New York, NY | New York, NY |
| 5 | Sacramento, CA | 4,800 | 8,900 | San Francisco, CA | Chicago, IL |
| 6 | North Port-Sarasota, FL | 4,700 | 5,900 | New York, NY | New York, NY |
| 7 | Cape Coral, FL | 4,100 | 6,200 | Chicago, IL | Chicago, IL |
| 8 | Dallas, TX | 4,100 | 6,200 | Los Angeles, CA | Los Angeles, CA |
| 9 | Miami, FL | 3,700 | 10,500 | New York, NY | New York, NY |
| 10 | Houston, TX | 3,600 | 4,500 | New York, NY | New York, NY |
| *Combined statistical areas with at least 500 users searching to and from the region in April 2023-June 2023 | |||||
Buyers are leaving California to get a less expensive home
Homebuyers are leaving San Francisco, New York and Los Angeles more than any other metro in the country. That’s based on net outflow, a measure of how many more Redfin.com users are looking to leave a metro than move in.
Several other expensive job centers, including Washington, D.C. and Boston, are also among the 10 metros homebuyers are most apt to leave. That’s largely for the same reasons described above: Homebuyers are leaving expensive places in favor of areas with more affordable housing, which is made possible by remote work for many movers. San Francisco’s median sale price is over $1.4 million, the highest in the country. That’s more than double the ~$600,000 median sale price in both Portland, OR and Austin, two of the 10 most popular destinations for homebuyers leaving San Francisco.
| Top 10 Metros Homebuyers Are Leaving, by Net Outflow
Net outflow = Number of Redfin.com home searchers looking to leave a metro area, minus the number of searchers looking to move in |
||||||
| Rank | Metro* | Net Outflow, Q2 2023 | Net Outflow, Q2 2022 | Portion of Local Users Searching Elsewhere | Top Destination | Top Out-of-State Destination
|
| 1 | San Francisco, CA | 28,100 | 39,400 | 24% | Sacramento, CA | Seattle, WA |
| 2 | New York, NY | 24,200 | 26,200 | 29% | Miami, FL | Miami, FL |
| 3 | Los Angeles, CA | 20,900 | 32,000 | 19% | Las Vegas, NV | Las Vegas, NV |
| 4 | Washington, D.C. | 15,700 | 18,600 | 19% | Salisbury, MD | Salisbury, MD |
| 5 | Chicago, IL | 4,900 | 3,000 | 17% | Cape Coral, FL | Cape Coral, FL |
| 6 | Boston, MA | 4,400 | 9,600 | 20% | Portland, ME | Portland, ME |
| 7 | Seattle, WA | 3,900 | 16,600 | 19% | Phoenix, AZ | Phoenix, AZ |
| 8 | Hartford, CT | 3,500 | 800 | 78% | Boston, MA | Boston, MA |
| 9 (tie) | Denver, CO | 2,300 | 5,000 | 35% | Chicago, IL | Chicago, IL |
| 9 (tie) | Detroit, MI | 2,300 | 5,400 | 27% | Grand Rapids, MI | Chicago, IL |
| *Combined statistical areas with at least 500 users searching to and from the region in April 2023-June 2023 | ||||||
Below is a map of the most common origins of Redfin.com users who are moving to the Las Vegas metro. To view similar maps for the metros in this report and other metros, please visit the area’s Redfin housing market page and scroll down to the “migration” section.

Methodology
Our migration analysis is based on about two million Redfin.com users who viewed for-sale homes online across more than 100 metro areas from April 2023 to June 2023. To measure the share of homebuyers looking to relocate from one metro to another, we calculate the portion of overall home searchers that are migrants.
A Redfin.com user counts as a migrant if they viewed at least 10 for-sale homes in the relevant three-month period and at least one of those homes was outside their home metro area. For instance, if a Redfin.com user based in Seattle views 10 homes in a three-month period and all of them are in Phoenix, that user counts as a full migrant to Phoenix. If a user based in Seattle views 10 homes in a three-month period and five are in Phoenix but five are in San Diego, that user counts as half of a migrant to Phoenix and half of a migrant to San Diego. If a user based in Seattle views 10 homes in a three-month period, nine in Seattle and one in Phoenix, that user counts as one-tenth of a migrant to Phoenix.
The analysis includes combined statistical areas with at least 500 Redfin.com users based in that region and at least 500 users searching for homes in that region. For instance, a user based in Seattle searching for a home in Phoenix counts toward the first condition, a user based in Phoenix searching for a home in Seattle counts toward the second condition, and a user based in Seattle searching for a home in Seattle counts toward both. Redfin’s migration data goes back to 2017.


