
- Buyers need to earn $114,000 to afford the typical U.S. home—35% more than the typical household makes. But that’s an improvement from October, when buyers needed to earn a record $121,000—51% more than the median household income.
- Mortgage rates have come down from their recent peak, giving buyers a bit more purchasing power, but affordability remains strained as housing costs grow twice as fast as incomes.
- The median monthly housing payment for homebuyers is $2,838, down from a record $3,012 in October but up 74% from February 2021, when mortgage rates were near their all-time low.
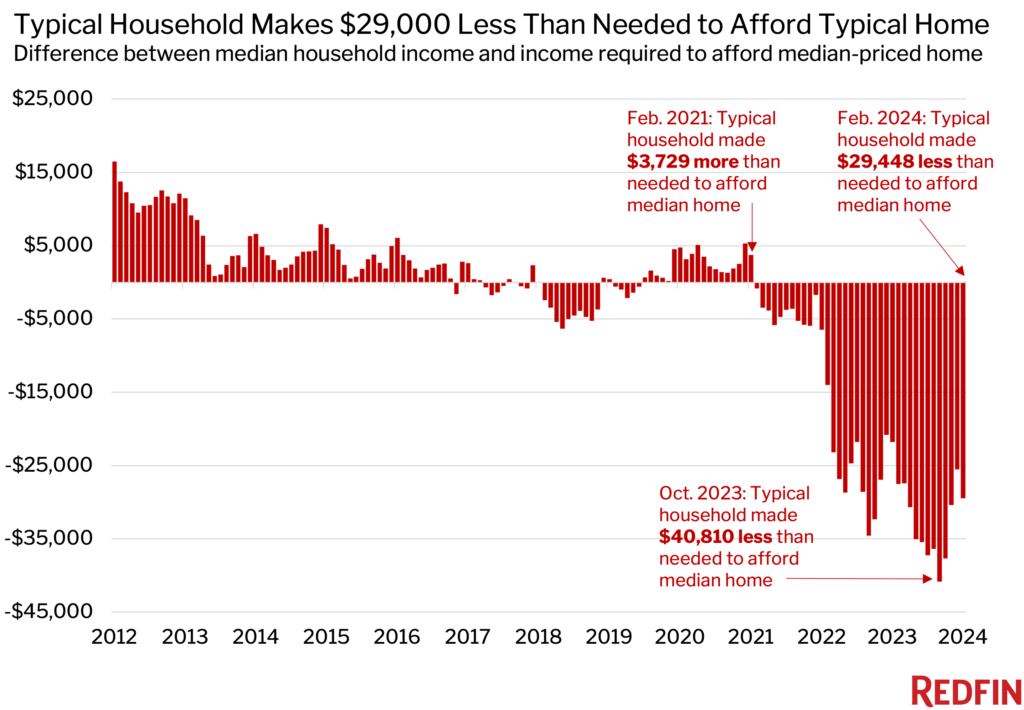
The typical U.S. household earns $29,448 less than it needs to afford the median-priced home. While that’s a sign of a major housing affordability crisis, it marks an improvement from October, when the typical household earned a record $40,810 less than it needed as mortgage rates hit the highest level in 23 years.
That’s based on a Redfin analysis of the estimated median U.S. household income and median monthly housing payments as of February 2024. References to the “median-priced” home in February refer to the median sale price of homes that were purchased during the month. We consider a home affordable if a buyer taking out a mortgage spends no more than 30% of their income on their monthly housing payment.
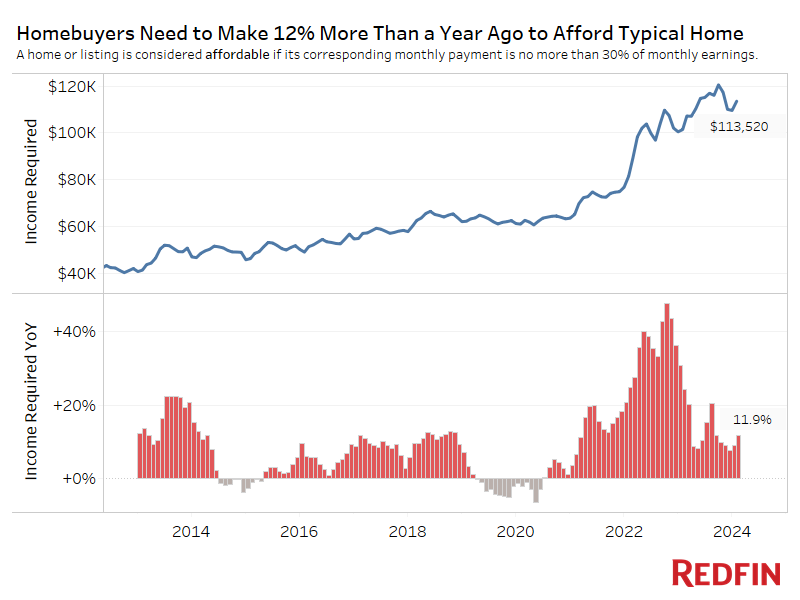
Buyers needed to earn an annual income of $113,520 to afford the median-priced U.S. home in February ($412,778). That’s 35% more than the $84,072 median household income. Mortgage rates hovered below 7% in February after peaking near 8% in late October, which has made homebuying a bit more affordable, but rates are still more than double their all-time low.
In October, when the mismatch between median income and the income needed to afford a home was highest, homebuyers needed to earn $120,500 to afford the typical home. That was a record 51% more than the $79,689 earned by the typical household.
February 2021 was the last month on record when the typical household earned more than it needed to afford the median priced home. Back then, the median household income was $69,021—6% higher than the $65,292 needed to afford the typical home.
“For over a decade, America has been slowly marching toward a housing affordability crisis due to chronic underbuilding, and that crisis was kicked into overdrive when the pandemic homebuying boom fueled a meteoric rise in housing prices,” said Redfin Senior Economist Elijah de la Campa. “Now there’s another culprit squeezing homebuyers: elevated mortgage rates. We’re slowly climbing our way out of an affordability hole, but we have a long way to go. Rates have come down from their peak, and are expected to fall again by the end of the year, which should make homebuying a little more affordable and incentivize buyers to come off the sidelines.”
Home sales fell to the lowest level in roughly three decades last year as elevated mortgage rates pushed homeownership out of reach for many Americans—especially first-time buyers, who haven’t built up equity from the sale of a previous home. Many Americans remain priced out of homeownership because rates remain elevated, and home prices continue climbing (they rose 7% year over year in February) due to a shortage of homes for sale.
Housing Affordability Remains Near Historic Lows as Housing Costs Grow Twice as Fast as Incomes
The $113,520 income needed to afford the median priced home in February was up 12% from a year earlier—the biggest annual gain since August—and still wasn’t far below October’s all-time high. It was up 39% from February 2022 and up 74% from February 2021, when mortgage rates were near their all-time low of 2.65%.
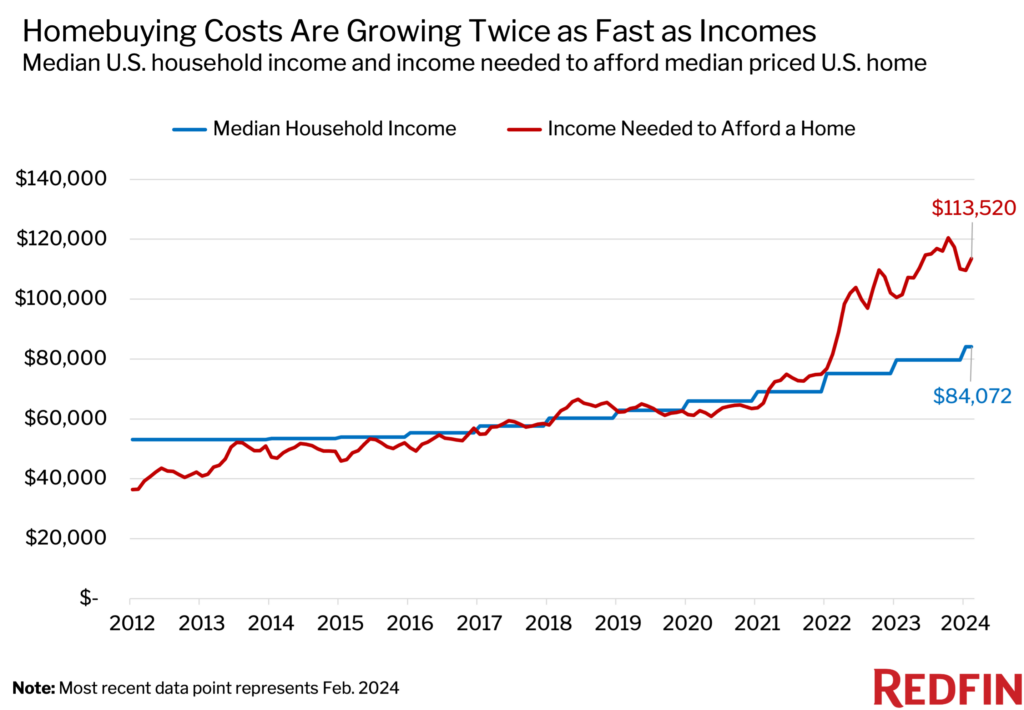
Affordability is strained today because housing costs are rising much faster than incomes. The median household income has increased 6% over the last year, half as much as the income needed to afford the median-priced home.
The median monthly housing payment for homebuyers was $2,838 in February, down from a record high of $3,012 in October but up 12% year over year.
Metro-Level Highlights: Texas Sees Smallest Gains in Income Needed to Afford a Home
Statistics below represent February 2024 and come from a list of the 50 most populous U.S. metros. Chicago is excluded due to insufficient data.
Metros with smallest increases in income needed to afford a home
In San Antonio, homebuyers in February needed to earn 1% more than a year earlier to afford the typical home—the smallest increase among the metros Redfin analyzed. Next came Detroit (3%), Austin, TX (4%), Fort Worth, TX (5%) and San Francisco (6%).
Home prices in Texas are soft, which is why many metros in the Lone Star State are seeing relatively small gains in the income needed to afford a home. The median home sale price in San Antonio fell 4% year over year in February, making it the only major metro that posted a decline. And prices in Fort Worth and Austin were up by less than 1%, making them some of the smallest gainers in the nation.
Texas has been building more homes than any other state, which has put downward pressure on prices because it means homebuyers have more options to choose from. Housing supply in Fort Worth jumped 14% year over year in February, one of the biggest increases in the U.S. In Austin, the housing market has also lost steam because an influx of out-of-towners in recent years drove housing costs to unsustainable heights, leaving many buyers priced out.
Metros with largest increases in income needed to afford a home
In Anaheim, CA, homebuyers in February needed to earn 20% more than a year earlier to afford the typical home—the biggest jump in the nation. Next came West Palm Beach, FL (18%), Fort Lauderdale, FL (18%), New Brunswick, NJ (18%) and San Diego (17%).
These metros have seen some of the biggest jumps in home prices, which is driving up the income needed to afford a home. Anaheim, the third most expensive homebuying market in the country, saw its median sale price surge 16% year over year in February—the second largest increase in the nation. West Palm Beach and Fort Lauderdale ranked third and fourth, both posting price increases of 13%.
There are 13 major metros where homebuyers can afford the typical home while making less than six figures
In Detroit, the typical household needed to earn $46,168 to afford the median priced home in February, making it the most affordable market in the country. It was followed by Cleveland ($58,186), Pittsburgh ($61,603), St. Louis ($66,755) and Philadelphia ($73,182). The other metros where homebuyers making less than $100,000 can afford the typical home are: Indianapolis, Warren, MI, Cincinnati, Milwaukee, Kansas City, MO, Virginia Beach, VA, San Antonio and Columbus, OH.
There are 11 major metros where homebuyers make more than they need to afford a home
The typical Detroit household earns $64,018, or 39% more than the $46,168 needed to afford the $165,000 median priced home. Next comes Pittsburgh, where the typical household earns 30% more than it needs to afford a home, followed by Cleveland (29%), St. Louis (29%) and Warren (21%). The other metros where the typical household earns more than it needs to afford a home are: Indianapolis (11%), Cincinnati (20%), Baltimore (9%), Milwaukee (5%), Kansas City (4%) and Minneapolis (4%).
There are seven metros where the typical household earns over 50% less than it needs to afford a home
In Los Angeles, the typical household earns $93,315, or 60% less than the $236,079 needed to afford the $874,800 median priced home. The other metros where the typical household earns over 50% less than needed to afford a home are: Anaheim (58% less), San Francisco (58%), San Jose, CA (55%), San Diego (55%), New York (52%) and Miami (51%).
Metro-Level Housing Affordability: 50 Most Populous Metros* (February 2024)
| U.S. metro area | Income needed to afford median-priced home | Income needed to afford median-priced home, YoY change | Median household income | Median home sale price | Median home sale price, YoY change | Median monthly housing payment for buyers |
|---|---|---|---|---|---|---|
| Anaheim, CA | $293,214 | 20.2% | $122,346 | $1,100,000 | 15.8% | $7,330 |
| Atlanta, GA | $106,869 | 11.6% | $94,167 | $390,000 | 6.8% | $2,672 |
| Austin, TX | $136,840 | 4.0% | $104,076 | $442,577 | 0.8% | $3,421 |
| Baltimore, MD | $100,245 | 13.5% | $109,003 | $355,000 | 9.2% | $2,506 |
| Boston, MA | $187,656 | 15.1% | $121,419 | $665,000 | 11.1% | $4,691 |
| Charlotte, NC | $105,588 | 13.3% | $86,403 | $394,995 | 7.3% | $2,640 |
| Cincinnati, OH | $78,026 | 14.8% | $86,019 | $274,000 | 9.6% | $1,951 |
| Cleveland, OH | $58,186 | 8.7% | $75,350 | $199,000 | 10.6% | $1,455 |
| Columbus, OH | $94,716 | 15.4% | $87,983 | $321,450 | 7.1% | $2,368 |
| Dallas, TX | $125,935 | 6.4% | $98,247 | $415,000 | 2.5% | $3,148 |
| Denver, CO | $153,589 | 8.5% | $110,058 | $575,000 | 2.7% | $3,840 |
| Detroit, MI | $46,168 | 3.3% | $64,018 | $165,000 | 3.1% | $1,154 |
| Fort Lauderdale, FL | $124,221 | 17.7% | $78,682 | $440,000 | 12.8% | $3,106 |
| Fort Worth, TX | $107,367 | 5.1% | $89,425 | $350,000 | 0.7% | $2,684 |
| Houston, TX | $101,727 | 7.2% | $88,870 | $330,000 | 3.1% | $2,543 |
| Indianapolis, IN | $77,943 | 6.7% | $86,180 | $281,750 | 2.5% | $1,949 |
| Jacksonville, FL | $102,843 | 13.4% | $83,778 | $372,890 | 7.8% | $2,571 |
| Kansas City, MO | $86,685 | 14.6% | $90,220 | $305,000 | 8.9% | $2,167 |
| Las Vegas, NV | $114,138 | 14.7% | $78,212 | $435,000 | 9.8% | $2,853 |
| Los Angeles, CA | $236,079 | 14.7% | $93,315 | $874,800 | 10.0% | $5,902 |
| Miami, FL | $145,612 | 14.9% | $71,840 | $526,320 | 9.7% | $3,640 |
| Milwaukee, WI | $80,120 | 6.1% | $83,989 | $275,000 | 3.8% | $2,003 |
| Minneapolis, MN | $102,492 | 9.8% | $106,561 | $359,991 | 4.7% | $2,562 |
| Montgomery County, PA | $130,804 | 15.6% | $123,613 | $450,000 | 12.5% | $3,270 |
| Nashville, TN | $118,271 | 9.8% | $91,252 | $449,990 | 4.7% | $2,957 |
| Nassau County, NY | $192,795 | 12.4% | $145,157 | $645,000 | 12.2% | $4,820 |
| New Brunswick, NJ | $150,921 | 17.6% | $119,143 | $485,000 | 12.8% | $3,773 |
| New York, NY | $199,325 | 11.2% | $96,460 | $699,000 | 9.2% | $4,983 |
| Newark, NJ | $162,671 | 16.5% | $109,401 | $525,000 | 16.5% | $4,067 |
| Oakland, CA | $247,792 | 14.6% | $135,896 | $900,000 | 10.3% | $6,195 |
| Orlando, FL | $109,897 | 8.4% | $80,204 | $399,194 | 2.8% | $2,747 |
| Philadelphia, PA | $73,182 | 15.3% | $72,933 | $255,000 | 8.5% | $1,830 |
| Phoenix, AZ | $117,880 | 11.2% | $89,521 | $453,445 | 6.7% | $2,947 |
| Pittsburgh, PA | $61,603 | 13.8% | $79,964 | $210,500 | 10.8% | $1,540 |
| Portland, OR | $147,241 | 7.7% | $101,552 | $532,000 | 3.3% | $3,681 |
| Providence, RI | $125,242 | 13.9% | $90,635 | $440,000 | 10.0% | $3,131 |
| Riverside, CA | $154,393 | 10.5% | $90,792 | $565,000 | 5.6% | $3,860 |
| Sacramento, CA | $154,865 | 11.7% | $100,278 | $565,000 | 7.0% | $3,872 |
| San Antonio, TX | $91,443 | 0.9% | $80,130 | $295,000 | -4.2% | $2,286 |
| San Diego, CA | $238,373 | 17.1% | $108,489 | $885,000 | 12.7% | $5,959 |
| San Francisco, CA | $382,576 | 5.6% | $159,867 | $1,418,444 | 0.6% | $9,564 |
| San Jose, CA | $378,736 | 16.5% | $170,249 | $1,403,000 | 12.3% | $9,468 |
| Seattle, WA | $219,458 | 16.7% | $126,470 | $796,950 | 12.2% | $5,486 |
| St. Louis, MO | $66,755 | 7.8% | $85,859 | $235,000 | 4.4% | $1,669 |
| Tampa, FL | $102,769 | 8.4% | $75,316 | $371,200 | 2.8% | $2,569 |
| Virginia Beach, VA | $90,319 | 9.8% | $88,903 | $325,000 | 4.4% | $2,258 |
| Warren, MI | $77,973 | 6.0% | $94,374 | $285,000 | 7.3% | $1,949 |
| Washington, D.C. | $149,608 | 9.9% | $137,407 | $535,000 | 5.3% | $3,740 |
| West Palm Beach, FL | $138,228 | 17.9% | $85,098 | $500,000 | 13.3% | $3,456 |
| National—U.S.A. | $113,520 | 11.9% | $84,072 | $412,778 | 6.6% | $2,838 |
*Excludes Chicago
Methodology
This is according to a Redfin analysis of U.S. incomes (incomes are estimated for 2023 and 2024) and median monthly housing payments for sold homes.
We consider a home “affordable” if a buyer taking out a mortgage spends no more than 30% of their income on their housing payment.
Monthly median housing payments are calculated using the prevailing median home sale price and average mortgage-interest rate, and assume a 15% down payment. Incomes for 2023 and 2024 are estimated using the U.S. Census Bureau’s (ACS) 2022 median household income and 12-month moving average nominal wage growth rates compiled from the Current Population Survey and reported by the Federal Reserve Bank of Atlanta.
The typical housing payments noted in this report include the mortgage principal, interest, property taxes, homeowners’ insurance and mortgage insurance. In this report, the word “homebuyer” refers to someone who is taking out a loan to finance their purchase.


