- Elevated home prices and mortgage rates, along with sluggish rents, have made low-priced homes increasingly attractive to investors.
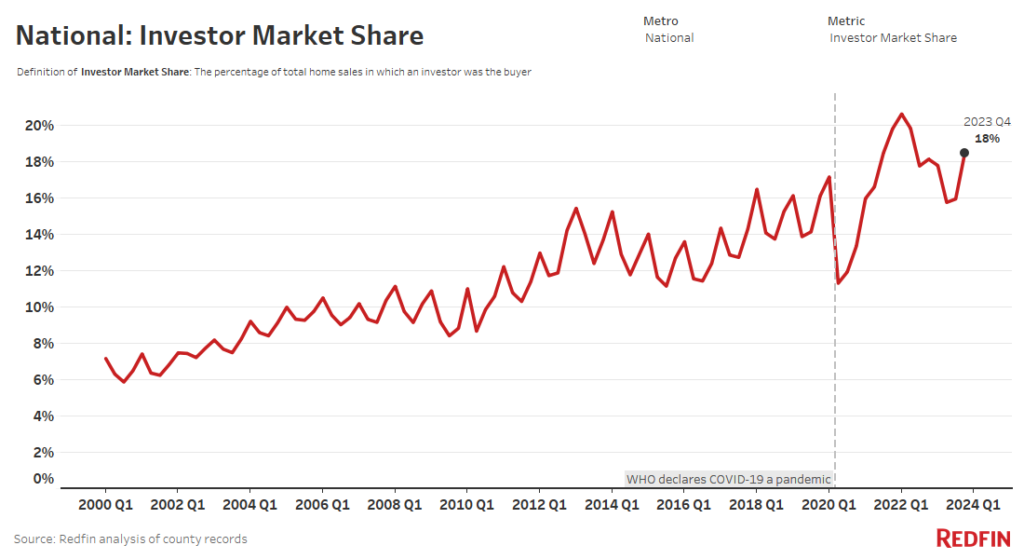
- Investors bought 18% of all homes that sold in the fourth quarter, up slightly from a year earlier.
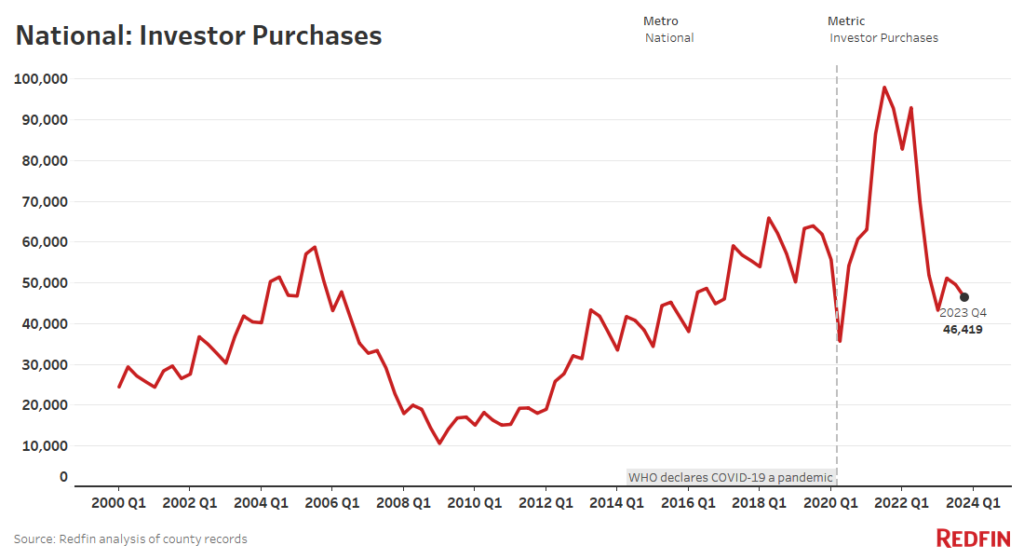
- Overall, investor home purchases dropped 11% from a year earlier, though that’s the smallest decline since they began falling in 2022.
- Redfin agents in Florida and California say many investors are hungry for homes, but can’t find properties to purchase due to an ongoing housing shortage.
Real estate investors bought 26.1% of low-priced U.S. homes that sold in the fourth quarter. That’s the highest share on record and is up from 24% a year earlier. By comparison, investors purchased 13.6% of mid-priced homes that sold (vs 14.3% a year earlier) and 15.9% of high-priced homes that sold (vs 15.4% a year earlier).
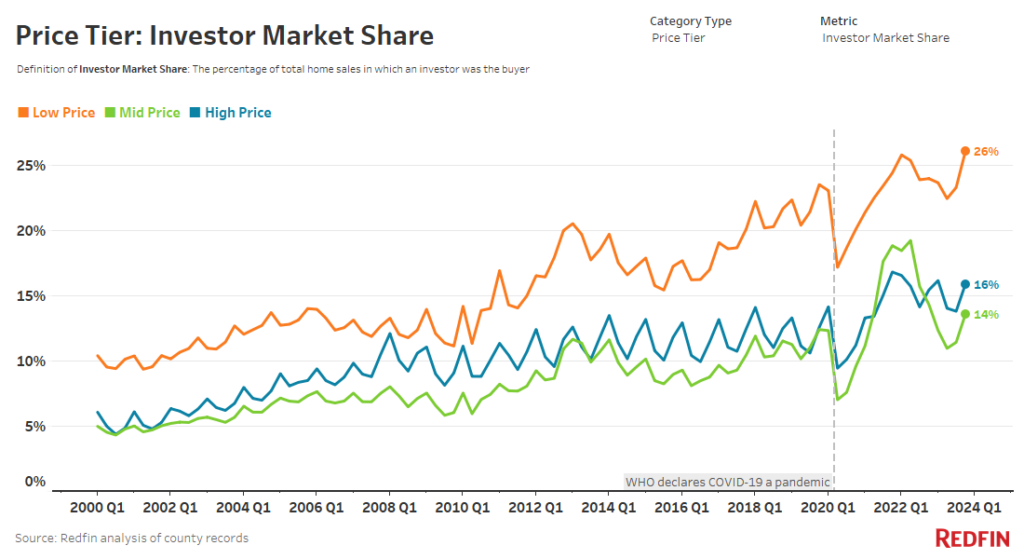
This is according to a Redfin analysis of county home purchase records across 39 of the most populous U.S. metropolitan areas. We define an investor as any institution or business that purchases residential real estate. Redfin divides home purchases into three buckets: low-priced, mid-priced and high-priced. Low-priced homes are those that fall into the bottom tercile of local sale prices, while mid-priced are those in the middle tercile and high-priced are those in the top tercile.
Investors are drawn to affordable homes for the same reason as other homebuyers: They cost less, which is especially attractive when home prices and borrowing costs remain elevated. And when housing affordability is this strained, there could be more potential for value increases in the lower price tier, meaning more potential for building equity.
Low-priced homes made up 46.5% of all investor purchases in the fourth quarter (vs 47.2% a year earlier), while mid-priced homes made up 24.6% (vs 26.4% a year earlier) and high-priced homes represented 28.8% (vs 26.5% a year earlier).
“I get tons of emails every day from investors looking for properties, but of course, they only want homes that are under market value, which are hard to come by. When they find those properties, they pile in,” said Carrie Caruthers, a Redfin Premier real estate agent in Riverside County, CA. “I’ve recently seen an uptick in foreclosures, which investors are interested in because they often sell at a discount. I just sold one foreclosed house to an investor for $400,000. It probably would’ve sold for around $500,000 if it hadn’t been a foreclosure, but the investor got a deal because foreclosure purchases come with risks.”
There is an open question about how big of an impact investors are having on the housing market. Many are concerned that investors are hurting regular buyers by driving up costs and exacerbating the shortage of homes for sale, and some lawmakers want to limit tax breaks for big corporate investors that purchase homes. A study released this month said it found “no evidence that SFRs crowd out residential home-buyers or increase home prices.” SFRs refers to single-family REITs, which are companies that invest in single-family properties.
Investor Home Purchases Dropped 11% in the Fourth Quarter
Investor purchases of U.S. homes fell 10.5% year over year in the fourth quarter to 46,419—the lowest fourth-quarter level since 2016. Overall U.S. home purchases posted a slightly larger decline, falling 12.2% to 251,462—the lowest fourth-quarter level since 2012.
Investor home purchases have fallen as high interest rates, elevated home prices and a sluggish rental market have made investing less lucrative. Some investors have shifted their money into other investments that offer good returns and lower risk, such as Treasury bonds. But Redfin agents in both California and Florida said many investors are still hungry for homes.
“There are a lot of investors out there fighting for properties,” said Juan Castro, a Redfin Premier real estate agent in Orlando, FL, which posted the third largest drop in investor purchases in the country last quarter. “There just aren’t enough properties to go around, which is putting a cap on how many homes investors can buy.”
The total supply of homes for sale in the U.S. fell 5.1% year over year in December and remained far below pre-pandemic levels as most homeowners stayed put to avoid losing the rock-bottom mortgage rate they scored during the pandemic.
The typical home purchased by investors in the fourth quarter cost $453,271, up slightly from $426,573 a year earlier, as U.S. home prices ticked up. Overall, investors bought $32.3 billion worth of U.S. homes, down just slightly from $33.6 billion a year earlier.
Most of the factors driving the drop in investor purchases are the same factors that have caused regular homebuyers to retreat. But individual homebuyers backed off a bit faster than investors in the fourth quarter, likely because mortgage rates hit the highest level in 23 years in October (they have since fallen slightly), causing homebuyer monthly mortgage payments to surge. Investors are less sensitive to mortgage rate fluctuations than regular buyers because most of them pay in cash, though they are still somewhat sensitive since they often take out different loans to cover home flipping and other expenses.
Investors Purchases Didn’t Fall Nearly as Fast as They Did Last Year
The 10.5% drop in investor home purchases in the fourth quarter marks the sixth straight year-over-year decline. But that pales in comparison to the 44.1% drop of a year earlier, and represents the smallest decrease since investor purchases started falling in the third quarter of 2022.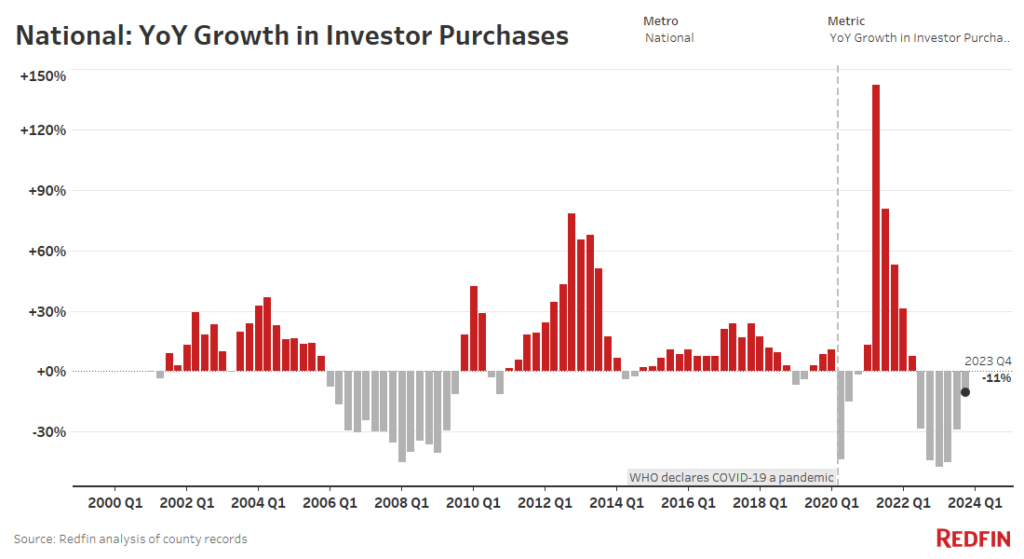
The decline in investor purchases has eased as the shock of elevated interest rates has subsided and the U.S. economy has proven to be more resilient than many expected.
“It’s too early to say that investor purchases have hit a bottom, but they’re unlikely to shoot up like they did during the pandemic anytime soon,” said Redfin Senior Economist Sheharyar Bokhari. “That’s because borrowing costs and home prices remain high, the number of homes available to buy remains low and rents remain lackluster. If the Fed cuts interest rates later this year as expected, we may see more investors wade into the housing market.”
Investors Bought Nearly 1 of Every 5 Homes That Sold in the Fourth Quarter
Investors bought 18.5% of U.S. homes that sold in the fourth quarter, up from 18.1% a year earlier. Their market share likely rose slightly because they didn’t retreat as quickly as individual buyers.
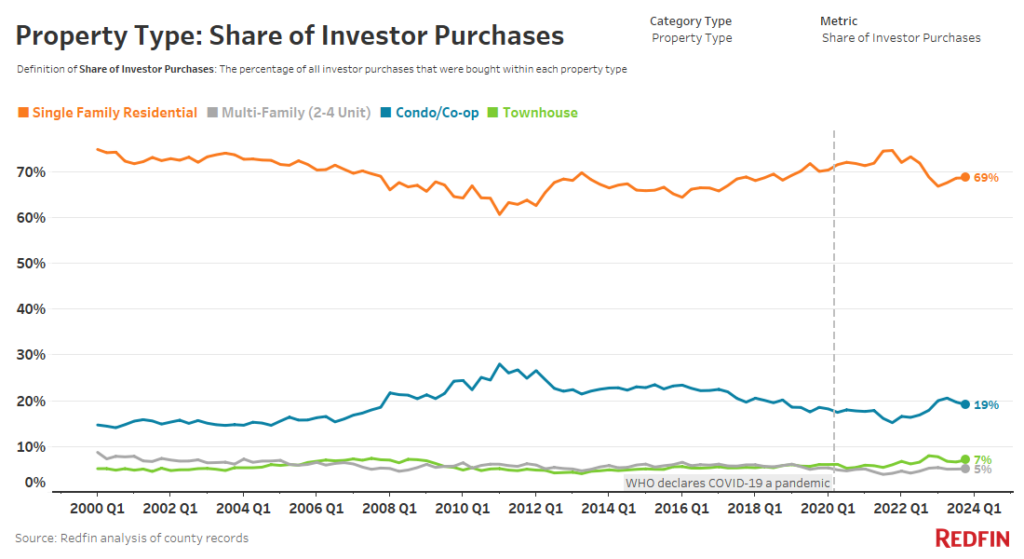
Single-Family Homes Represented Over Two-Thirds of Investor Purchases
Single-family homes represented 68.6% of investor purchases in the fourth quarter (vs 68.8% a year earlier). Condos/co-ops made up the second largest share (19.2% vs 17.9% a year earlier), followed by townhouses (7.1% vs 8% a year earlier) and multifamily properties (5.1% vs 5.3% a year earlier).
Metro-Level Highlights: Q4 2023 Investor Activity
Where investor purchases increased/decreased most from a year earlier:
- Biggest increases: Riverside, CA (+25%), Chicago (+20.9%), San Jose, CA (+18%)
- Biggest decreases: Cincinnati (-28.8%), Providence, RI (-27.7%), Orlando, FL (-26.5%)
Where investors bought the highest/lowest share of homes that sold:
- Highest share: In Miami, investors bought 31.5% of homes that sold. Next came Jacksonville, FL (25.6%) and Anaheim, CA (25.5%)
- Lowest share: Providence (9.9%), Warren, MI (10.1%), Montgomery County, PA (10.2%)
Where the share of homes bought by investors increased/decreased most from a year earlier:
- Biggest increases: In Sacramento, CA, investors bought 21.5% of homes that sold, up 4.6 percentage points from a year earlier. Next came San Diego (+4.6 ppts) and Riverside (+4.3 ppts)
- Biggest decreases: Atlanta (-3 ppts), Orlando (-2.7 ppts), Miami (-2.5 ppts)
Metro Summary: Investor Home Purchases, Q4 2023
| U.S. metro area | Investor purchases, YoY change | Total value of homes bought by investors | Median purchase price of homes bought by investors | Share of purchased homes bought by investors | Share of purchased homes bought by investors, YoY change (ppts) | |
|---|---|---|---|---|---|---|
| Anaheim, CA | 12.6% | $2,111,211,500 | $1,255,000 | 25.5% | 3.0 ppts | |
| Atlanta, GA | -24.5% | $1,234,016,860 | $262,755 | 22.0% | -3.0 ppts | |
| Baltimore, MD | -19.8% | $327,402,847 | $158,750 | 19.6% | -0.1 ppts | |
| Charlotte, NC | -15.6% | $558,481,501 | $287,500 | 21.5% | -1.1 ppts | |
| Chicago, IL | 20.9% | $827,753,276 | $234,750 | 15.5% | 2.9 ppts | |
| Cincinnati, OH | -28.8% | $195,372,894 | $165,000 | 18.2% | -1.4 ppts | |
| Cleveland, OH | -4.5% | $179,725,670 | $105,000 | 21.3% | 0.7 ppts | |
| Columbus, OH | -21.0% | $230,725,041 | $215,000 | 16.4% | -2.2 ppts | |
| Denver, CO | -9.7% | $801,839,801 | $505,000 | 15.9% | 0.4 ppts | |
| Detroit, MI | -2.6% | $100,953,881 | $87,000 | 19.3% | 1.5 ppts | |
| Fort Lauderdale, FL | -14.5% | $773,253,222 | $370,000 | 20.0% | -1.7 ppts | |
| Jacksonville, FL | -21.6% | $380,787,396 | $249,900 | 25.6% | -1.0 ppts | |
| Las Vegas, NV | -0.2% | $739,600,906 | $390,000 | 23.0% | 0.4 ppts | |
| Los Angeles, CA | 4.5% | $3,949,537,636 | $1,000,000 | 21.5% | 1.7 ppts | |
| Miami, FL | -15.8% | $1,807,631,909 | $460,000 | 31.5% | -2.5 ppts | |
| Milwaukee, WI | -19.5% | $185,865,400 | $175,000 | 15.5% | -2.3 ppts | |
| Minneapolis, MN | -0.6% | $439,229,549 | $286,450 | 12.2% | 1.3 ppts | |
| Montgomery County, PA | -17.3% | $171,485,126 | $312,000 | 10.2% | -0.1 ppts | |
| Nashville, TN | -20.1% | $466,585,430 | $373,436 | 17.8% | -1.2 ppts | |
| New Brunswick, NJ | -12.1% | $556,556,352 | $420,000 | 12.6% | 0.3 ppts | |
| New York, NY | -20.9% | $3,123,520,733 | $775,000 | 18.7% | 0.3 ppts | |
| Newark, NJ | -14.4% | $310,747,342 | $415,000 | 12.5% | 0.4 ppts | |
| Oakland, CA | -14.3% | $733,386,000 | $1,000,000 | 16.0% | 1.6 ppts | |
| Orlando, FL | -26.5% | $661,219,887 | $310,000 | 22.1% | -2.7 ppts | |
| Philadelphia, PA | -14.3% | $167,055,503 | $128,000 | 19.1% | -0.5 ppts | |
| Phoenix, AZ | -11.2% | $1,614,407,801 | $405,000 | 21.8% | 0.7 ppts | |
| Portland, OR | -7.6% | $329,613,936 | $490,000 | 14.0% | 1.7 ppts | |
| Providence, RI | -27.7% | $108,984,607 | $350,000 | 9.9% | 0.0 ppts | |
| Riverside, CA | 25.0% | $1,147,227,081 | $541,000 | 21.5% | 4.3 ppts | |
| Sacramento, CA | 11.8% | $693,348,755 | $554,000 | 21.5% | 4.6 ppts | |
| San Diego, CA | 11.5% | $1,739,445,000 | $915,000 | 25.1% | 4.6 ppts | |
| San Francisco, CA | 0.2% | $1,239,672,500 | $1,805,000 | 21.8% | 0.5 ppts | |
| San Jose, CA | 18.0% | $888,033,500 | $1,589,000 | 17.0% | 2.1 ppts | |
| Seattle, WA | -4.3% | $501,840,440 | $795,000 | 10.6% | 0.8 ppts | |
| Tampa, FL | -15.9% | $991,640,124 | $305,400 | 20.5% | -0.6 ppts | |
| Virginia Beach, VA | -15.9% | $170,757,524 | $196,000 | 12.9% | 0.8 ppts | |
| Warren, MI | 4.2% | $163,820,359 | $165,000 | 10.1% | 1.6 ppts | |
| Washington, D.C. | -6.1% | $706,685,429 | $425,000 | 10.9% | 0.3 ppts | |
| West Palm Beach, FL | -18.6% | $944,124,053 | $450,350 | 19.1% | -0.1 ppts | |
| National—U.S.A. | -10.5% | $32,273,546,771 | $453,271 | 18.5% | 0.3 ppts |
Methodology
For this analysis, we looked at county sale records for homes purchased from January 2000 through December 2023. We define an investor as any buyer whose name includes at least one of the following keywords: LLC, Inc, Trust, Corp, Homes. We also define an investor as any buyer whose ownership code on a purchasing deed includes at least one of the following keywords: association, corporate trustee, company, joint venture, corporate trust. This data may include purchases made through family trusts for personal use.
We analyzed home sales in the 50 most populous metro areas, but only included 39 metros in this report due to non-disclosure of sale prices in some counties. The national figures in this report represent an aggregation of those 39 metros.
When we refer to a “record,” the record dates back to the first quarter of 2000. Data is subject to revision.
 United States
 Canada