
Still, housing market conditions improved slightly for homebuyers as competition eased off from the records set in June.
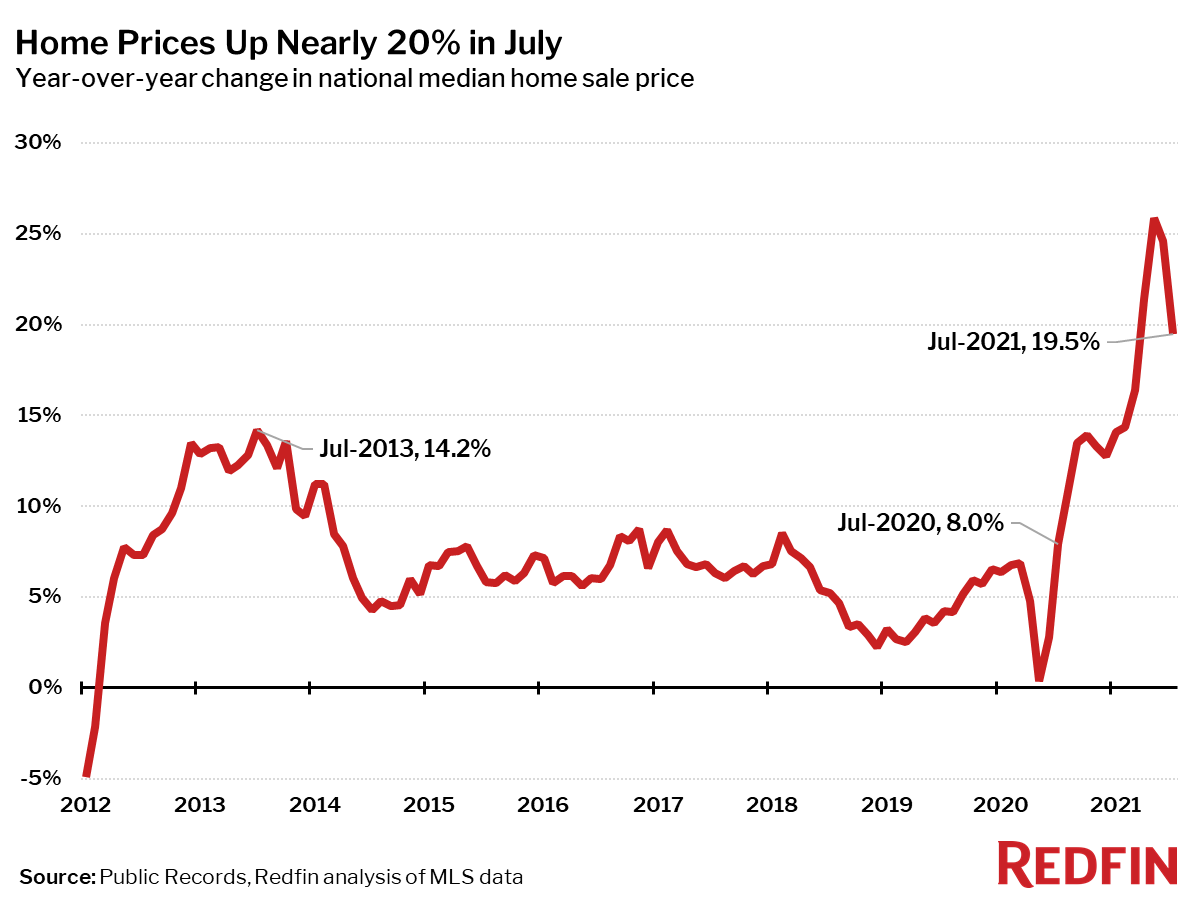
The median price of homes sold in July was up nearly 20% from a year earlier to a new all-time high of $385,600. This annual growth rate was down from a peak of 26% in May but still higher than any point on record prior to April of this year.
July was the 12th consecutive month of double digit price gains, which is significant because a year ago the housing market was already in a strong growth phase, after pausing briefly at the onset of the pandemic. One year later we are still seeing extremely strong growth, but the market is very gradually becoming less competitive for buyers.
“Home prices are still soaring at an astonishing rate,” said Redfin Chief Economist Daryl Fairweather. “Now that we’re a year out from the post-lockdown rebound, we can no longer explain away the enormous price growth by pointing to the pandemic’s earliest impacts on the housing market. While this ongoing trend continues to fuel an already severe affordability crisis, the market is becoming somewhat less competitive for homebuyers. Demand has softened enough that homes aren’t flying off the market quite as fast or for as much above list price as they were in the spring. Mortgage rates are remaining about as low as they’ve ever been, so buyers who lose out in a bidding war don’t have to fear that they’ve missed their window to buy. As more homes are being listed, it may be worth waiting for the right home at the right price.”
| Market Summary | July 2021 | Month-Over-Month | Year-Over-Year |
|---|---|---|---|
| Median sale price | $385,600 | -0.3% | 19.5% |
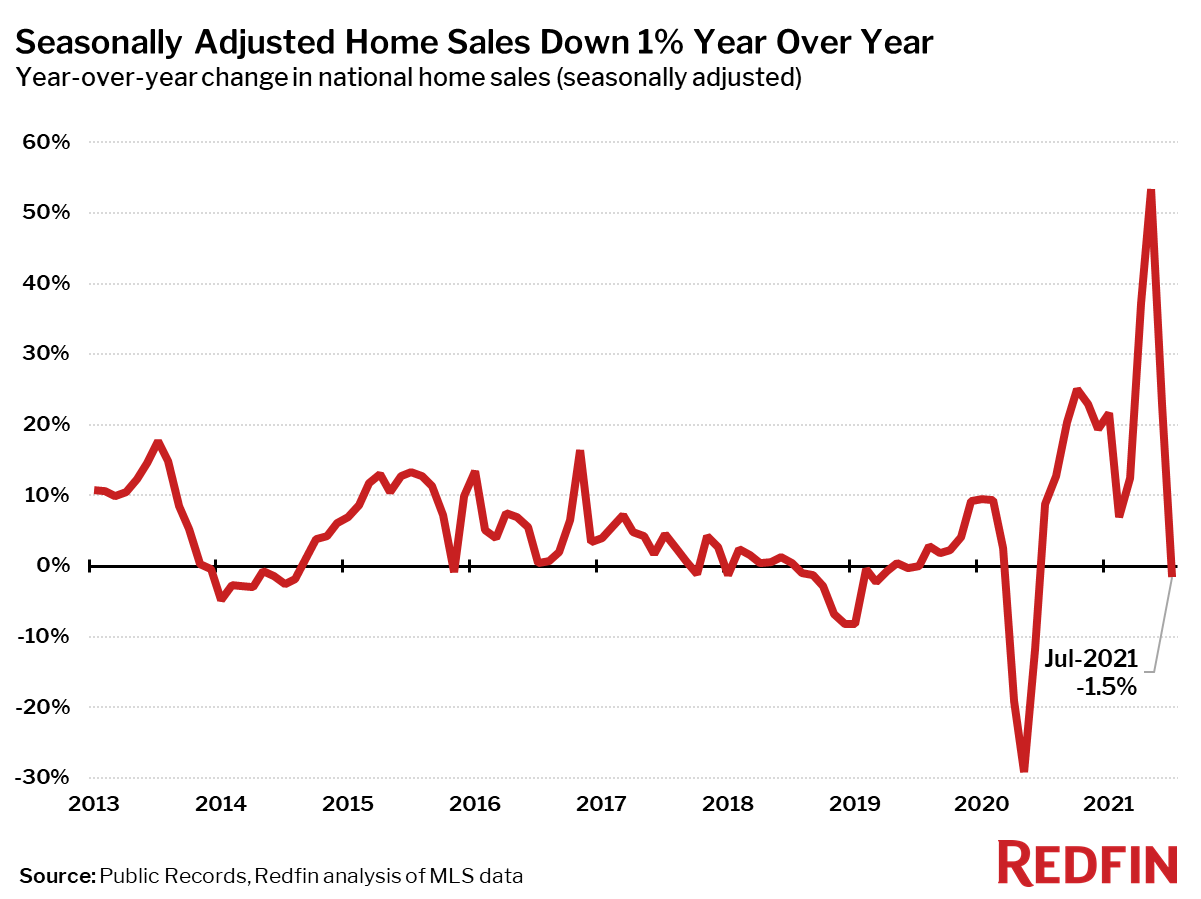
| Homes sold, seasonally-adjusted | 604,000 | -0.2% | -1.5% |
| Pending sales, seasonally-adjusted | 558,300 | 1.0% | 8.1% |
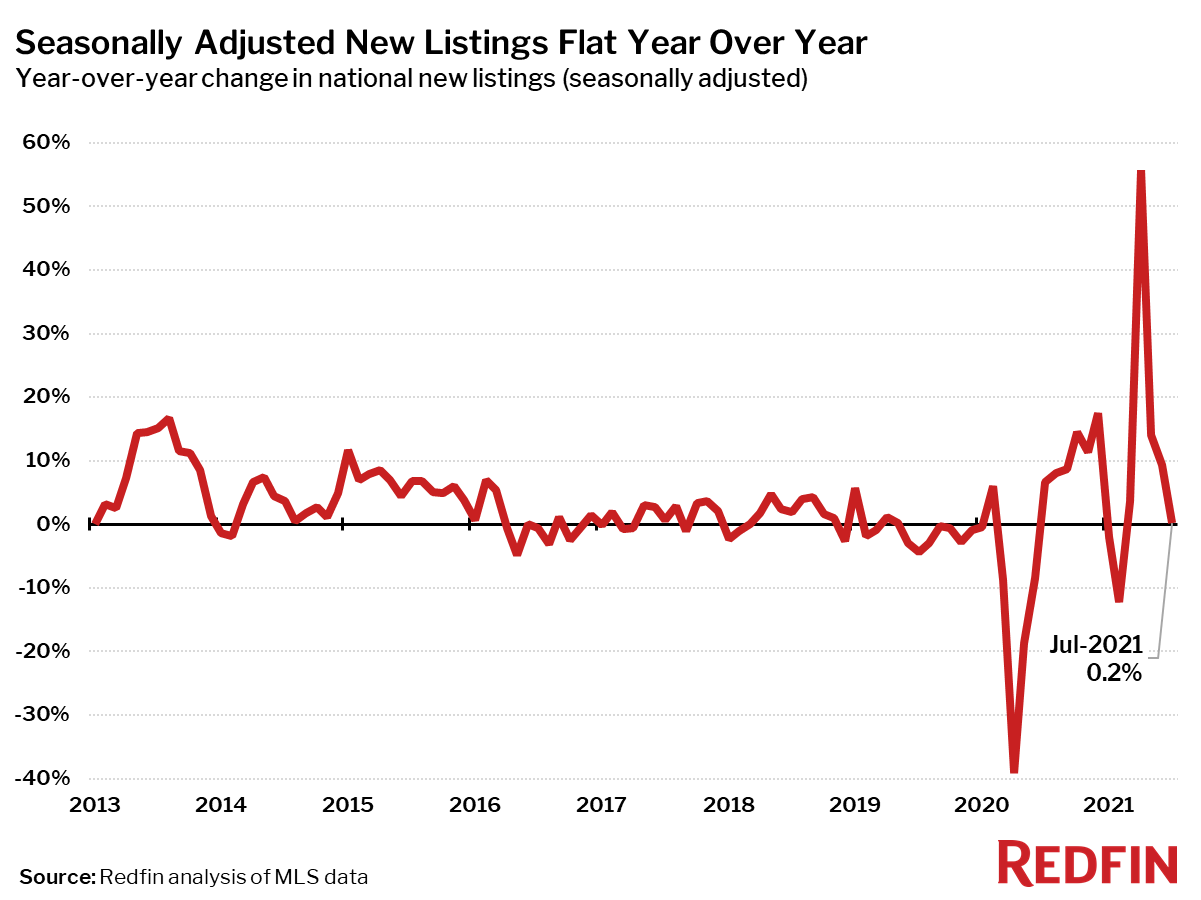
| New listings, seasonally-adjusted | 653,300 | 4.3% | 0.2% |
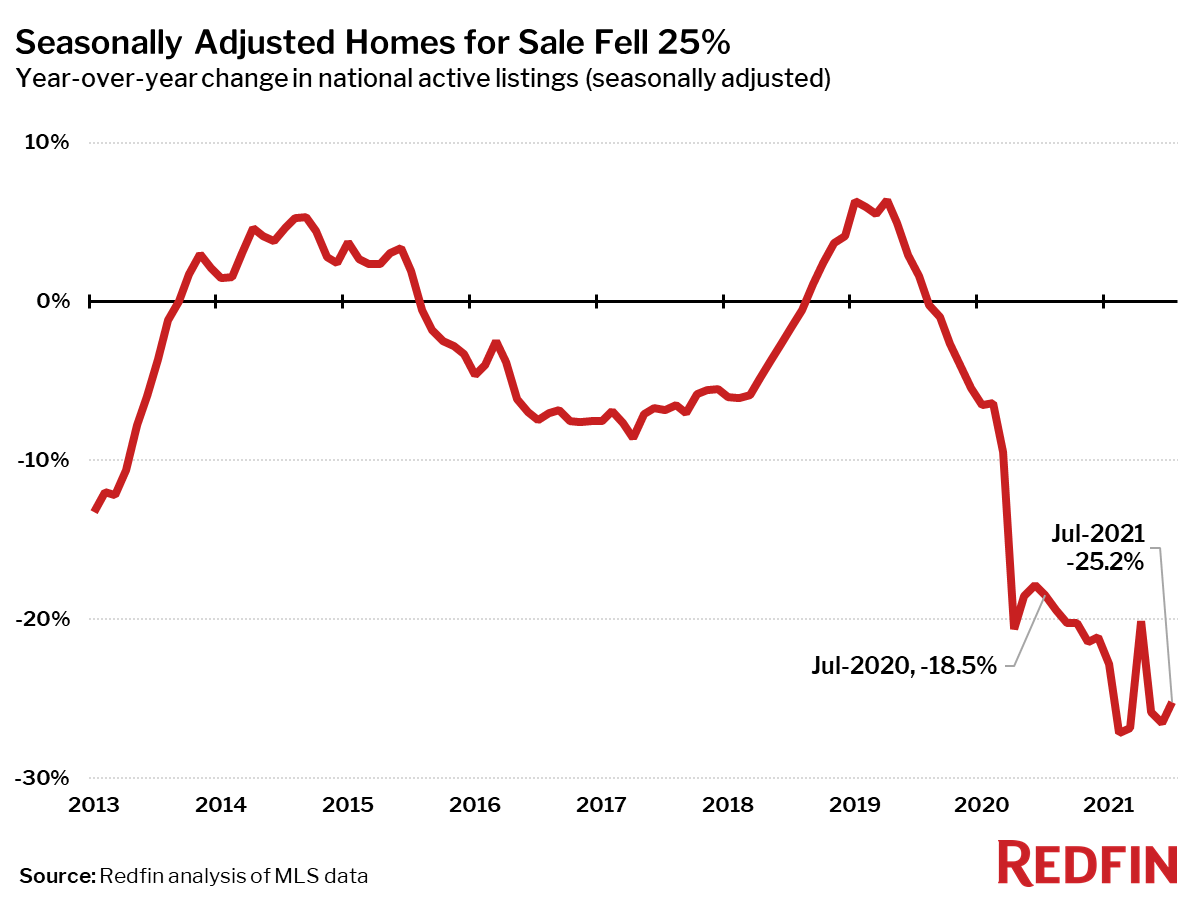
| All Homes for sale, seasonally-adjusted | 1,328,900 | -0.1% | -25.2% |
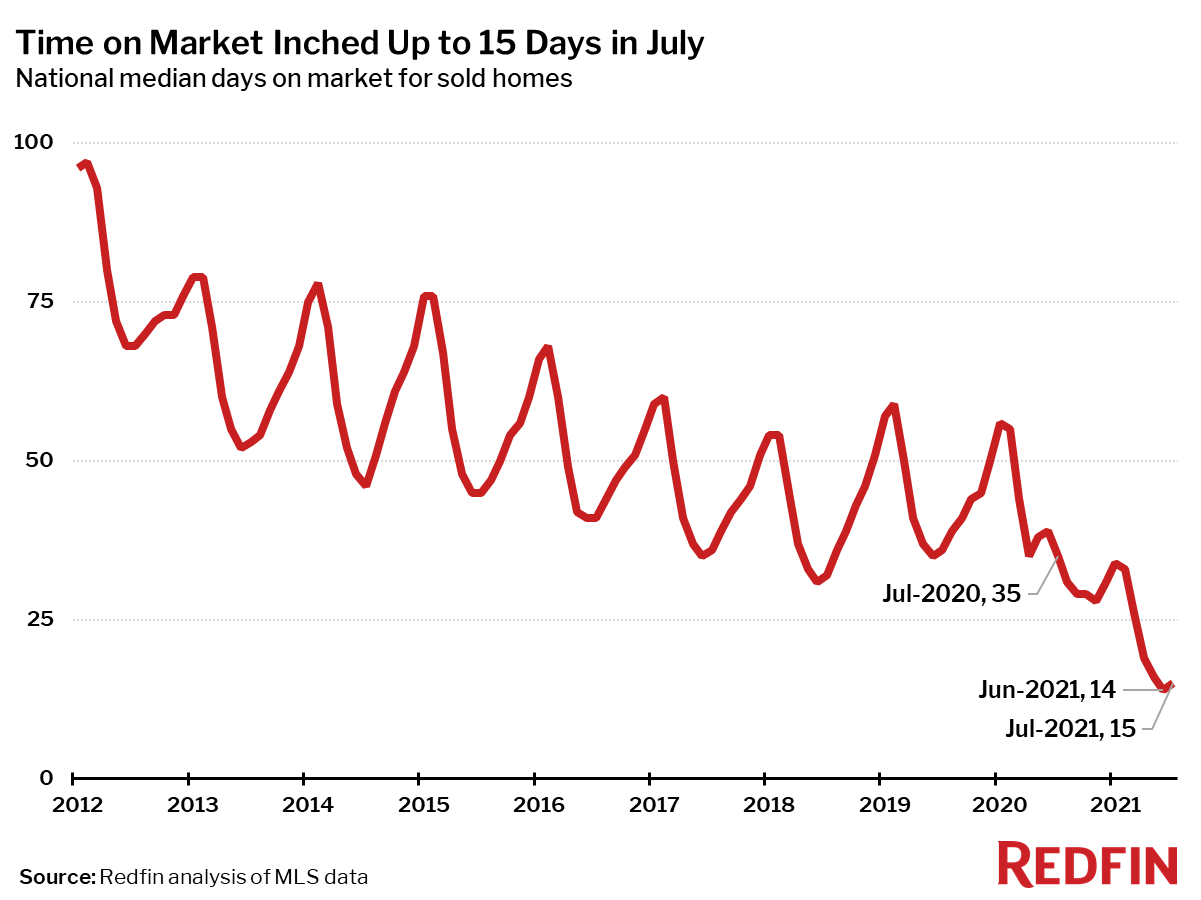
| Median days on market | 15 | 0 | -20 |
| Months of supply | 1.2 | 0.1 | -0.5 |
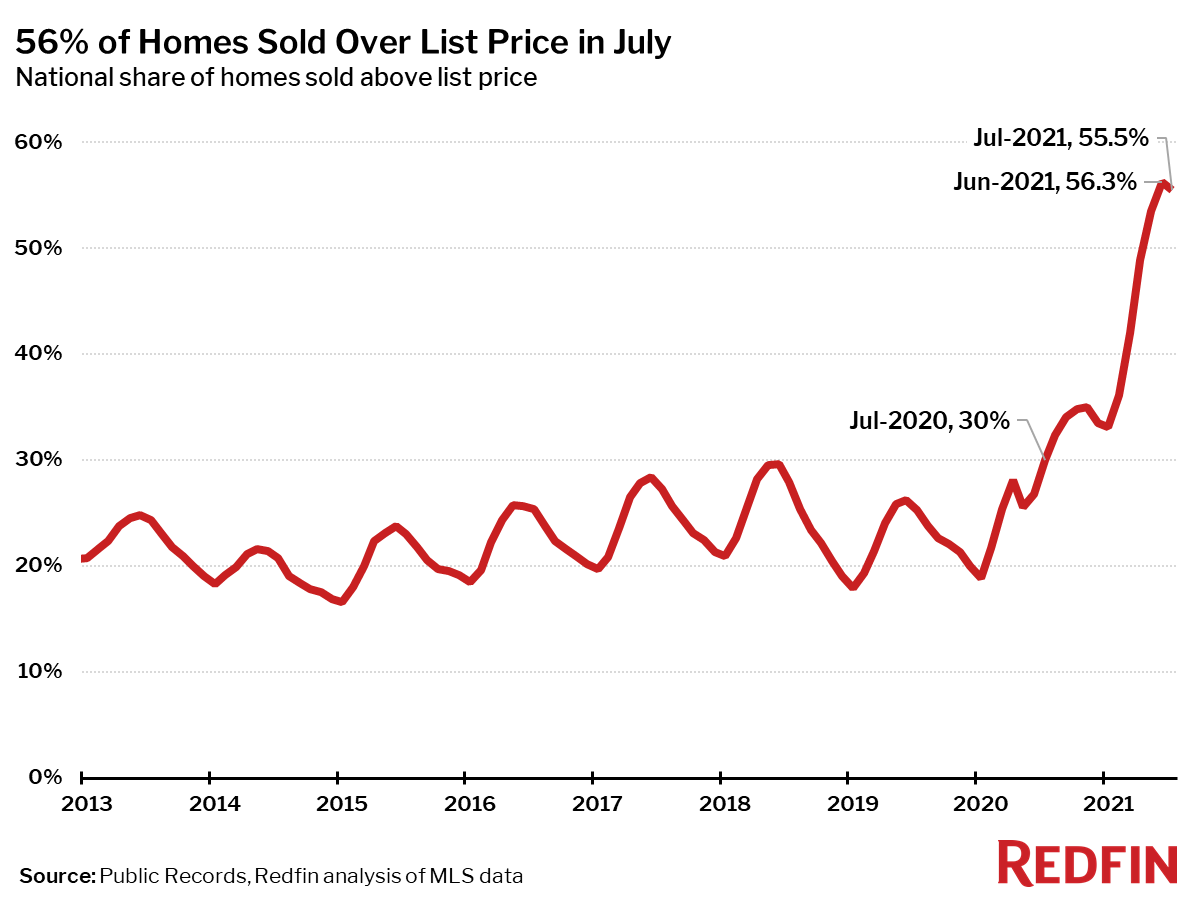
| Sold above list | 55.5% | -0.8 pts† | 25.5 pts† |
| Median Off-Market Redfin Estimate | $353,700 | 1.3% | 14.6% |
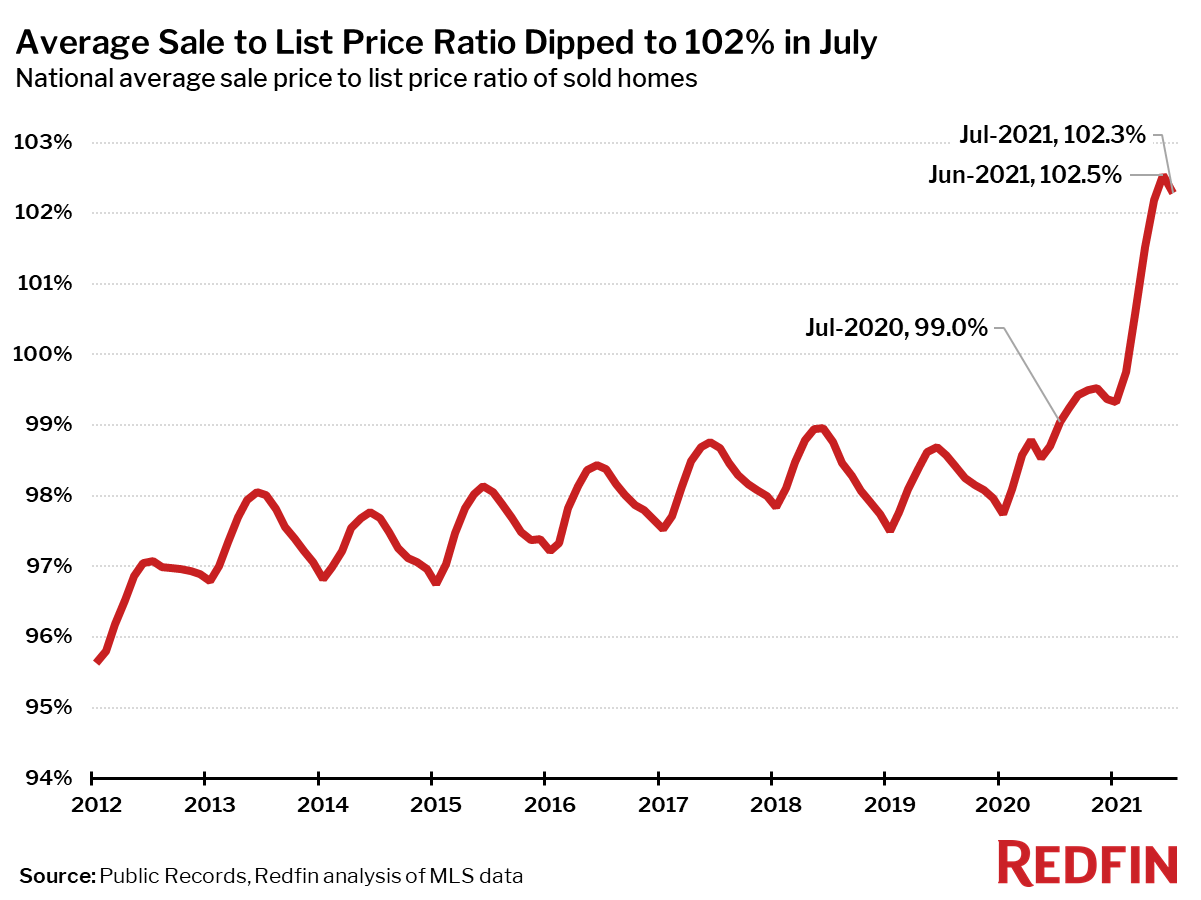
| Average Sale-to-list | 102.3% | -0.3 pts† | 3.2 pts† |
| Average 30-year fixed mortgage rate | 2.87% | -0.11 pts† | -0.15 pts† |
Median sale prices increased from a year earlier in all of the 85 largest metro areas Redfin tracks. The largest price increase was in Austin, TX (+39%), followed by Phoenix (+28%) and Salt Lake City (+26%).
The smallest price increases were posted in New Orleans (+5%), Omaha, NE (+5%) and Virginia Beach (+6%).
Seasonally-adjusted home sales in July were down 1% from a year earlier, and down 0.2% from June. Compared to July 2020, home sales fell in 55 of the 85 largest metro areas Redfin tracks. The biggest sales declines were seen in Richmond, VA (-52%), Salt Lake City (-26%) and Grand Rapids, MI (-25%). The largest gains were in places where sales were still somewhat depressed in July 2020, including New York (+79%), Nassau County, NY (+53%), and Honolulu (+37%).
Seasonally adjusted active listings—the count of all homes that were for sale at any time during the month—fell 25% year over year to their lowest level on record.
Only two of the 85 largest metros tracked by Redfin posted a year-over-year increase in the number of seasonally adjusted active listings of homes for sale: Milwaukee (+3%) and Columbus (+0.1%). The biggest year-over-year declines in active housing supply in July were in Baton Rouge, LA (-51%), North Port, FL (-51%) and Raleigh, NC (-44%).
Seasonally adjusted new listings of homes for sale were essentially flat (+0.2%) in July from a year earlier, a return to the pattern typical of the four years prior to the pandemic. New listings fell from a year ago in 41 of the 85 largest metro areas. The biggest declines were in Allentown, PA (-52%), Baton Rouge (-43%) and St. Louis, MO (-38%). New listings rose the most from a year ago in McAllen, TX (+21%), San Jose, CA (+20%) and Virginia Beach (+20%).
Measures of housing market competition based on completed home sales eased in July from all-time records the month before.
The typical home that sold in July went under contract in 15 days—less than half as much time as a year earlier, when homes sold in a median 35 days, but up one day from June.
In July, 56% of homes sold above list price, down less than a percentage point from the month before.
The average sale-to-list price ratio also dipped slightly in July to 102.3%.
Other July Highlights
Competition
- Denver, Indianapolis and Oklahoma City were the fastest markets, with half of all homes pending sale in just 5 days. Elgin, IL and Grand Rapids, MI were the next fastest markets with 6 median days on market.
- The most competitive market in July was Oakland, CA where 85.1% of homes sold above list price, followed by 80.2% in San Jose, CA, 76.6% in Rochester, NY, 75.7% in Buffalo, NY, and 73.9% in Worcester, MA.
Prices
- Austin, TX had the nation’s highest price growth, rising 38.6% since last year to $485,000. Phoenix had the second highest growth at 28.1% year-over-year price growth, followed by Salt Lake City (26.1%), Buffalo, NY (25.7%), and McAllen, TX (22.2%).
- July was the fourth month in a row in which no metros saw price declines.
Sales
- New York led the nation in year-over-year sales growth, up 79%, followed by Nassau County, NY, up 53%. Honolulu, HI rounded out the top three with sales up 37% from a year ago.
- Richmond, VA saw the largest decline in sales since last year, falling 52.3%. Home sales in Salt Lake City and Grand Rapids, MI declined by 26.1% and 24.8%, respectively.
Inventory
- Milwaukee had the highest increase in the number of homes for sale, up 3.1% year over year, followed by Columbus, OH (0.1%) and Virginia Beach, VA (-2.3%).
- Baton Rouge, LA had the largest decrease in overall active listings, falling 51.1% since last July. North Port, FL (-50.6%) and Raleigh, NC (-43.6%) also saw far fewer homes available on the market than a year ago.
Redfin Estimate
- Miami (87.6%) had the largest share of homes predicted to sell for below list price, according to Redfin Estimate data, followed by Fort Lauderdale, FL (83.5%) and West Palm Beach, FL (79.9%).
- Oakland, CA (93.3%) had the largest share of homes predicted to sell at or above list price, followed by San Jose, CA (92.4%) and San Francisco (87.4%).
Below are market-by-market breakdowns for prices, inventory, new listings and sales for markets with populations of 750,000 or more. For downloadable data on all of the markets Redfin tracks, visit the Redfin Data Center. Refer to our metrics definition page for explanations of all the metrics used in this report.
Median Sale Price
| Redfin Metro | Median Sale Price | Month-Over-Month | Year-Over-Year |
|---|---|---|---|
| Albany, NY | $271,700 | 2.5% | 13.2% |
| Allentown, PA | $275,000 | -0.4% | 15.1% |
| Anaheim, CA | $905,800 | -0.5% | 18.6% |
| Atlanta, GA | $336,000 | 0.0% | 20.3% |
| Austin, TX | $485,000 | 1.0% | 38.6% |
| Bakersfield, CA | $320,000 | 4.7% | 18.5% |
| Baltimore, MD | $350,000 | 0.0% | 9.4% |
| Baton Rouge, LA | $241,500 | -1.4% | 8.8% |
| Birmingham, AL | $265,000 | 0.0% | 8.2% |
| Boston, MA | $640,000 | -1.5% | 15.3% |
| Bridgeport, CT | $568,400 | -1.2% | 16.0% |
| Buffalo, NY | $222,500 | 8.5% | 25.7% |
| Camden, NJ | $265,000 | 0.0% | 15.3% |
| Charleston, SC | $354,700 | -1.5% | 14.4% |
| Charlotte, NC | $338,000 | -0.6% | 15.8% |
| Chicago, IL | $315,000 | -1.6% | 11.7% |
| Cincinnati, OH | $247,800 | -2.8% | 12.1% |
| Cleveland, OH | $200,000 | -1.2% | 14.3% |
| Columbus, OH | $290,000 | 0.0% | 13.7% |
| Dallas, TX | $381,100 | 0.3% | 19.1% |
| Dayton, OH | $184,500 | -5.4% | 7.1% |
| Denver, CO | $535,000 | -0.9% | 17.6% |
| Detroit, MI | $190,000 | 5.6% | 16.9% |
| El Paso, TX | $208,000 | 4.5% | 15.6% |
| Elgin, IL | $290,000 | 1.8% | 14.6% |
| Fort Lauderdale, FL | $345,000 | 1.3% | 9.9% |
| Fort Worth, TX | $318,500 | 1.9% | 20.2% |
| Frederick, MD | $505,500 | 0.9% | 12.3% |
| Fresno, CA | $365,000 | -0.1% | 15.9% |
| Grand Rapids, MI | $276,500 | -1.2% | 16.2% |
| Greensboro, NC | $225,000 | -2.2% | 10.8% |
| Greenville, SC | $268,000 | -2.2% | 13.6% |
| Hartford, CT | $290,000 | 3.0% | 13.7% |
| Houston, TX | $307,000 | -1.3% | 13.7% |
| Indianapolis, IN | $255,100 | 2.0% | 13.4% |
| Jacksonville, FL | $310,000 | 1.6% | 17.0% |
| Kansas City, MO | $285,000 | 1.8% | 11.0% |
| Knoxville, TN | $292,500 | 3.7% | 19.4% |
| Lake County, IL | $315,000 | -3.1% | 18.9% |
| Las Vegas, NV | $378,000 | 3.6% | 22.0% |
| Los Angeles, CA | $825,000 | -0.6% | 17.9% |
| Louisville, KY | $245,000 | 3.4% | 6.5% |
| McAllen, TX | $198,500 | 4.5% | 22.2% |
| Memphis, TN | $250,000 | -3.8% | 13.6% |
| Miami, FL | $415,000 | 0.0% | 21.7% |
| Milwaukee, WI | $279,300 | -0.2% | 7.4% |
| Minneapolis, MN | $350,000 | -0.1% | 11.1% |
| Montgomery County, PA | $405,000 | -0.4% | 14.0% |
| Nashville, TN | $386,900 | -0.8% | 17.7% |
| Nassau County, NY | $585,000 | 1.6% | 20.9% |
| New Brunswick, NJ | $425,000 | -0.6% | 16.4% |
| New Haven, CT | $289,000 | -3.6% | 15.6% |
| New Orleans, LA | $271,800 | -3.5% | 4.6% |
| New York, NY | $675,000 | 0.7% | 18.6% |
| Newark, NJ | $493,000 | -0.4% | 20.2% |
| North Port, FL | $375,000 | 1.8% | 21.0% |
| Oakland, CA | $965,000 | 0.5% | 19.1% |
| Oklahoma City, OK | $225,000 | -2.2% | 9.2% |
| Omaha, NE | $257,000 | -1.9% | 4.9% |
| Orlando, FL | $335,000 | 1.5% | 18.8% |
| Oxnard, CA | $760,500 | -4.9% | 15.9% |
| Philadelphia, PA | $280,000 | 0.0% | 12.9% |
| Phoenix, AZ | $410,000 | 1.9% | 28.1% |
| Pittsburgh, PA | $224,700 | -2.7% | 12.3% |
| Portland, OR | $514,100 | -0.2% | 16.9% |
| Providence, RI | $382,500 | 2.0% | 18.6% |
| Raleigh, NC | $376,500 | 0.4% | 20.5% |
| Richmond, VA | $320,100 | -3.6% | 8.5% |
| Riverside, CA | $510,000 | 0.0% | 21.4% |
| Rochester, NY | $200,000 | 0.0% | 14.3% |
| Sacramento, CA | $554,000 | -1.9% | 19.7% |
| Salt Lake City, UT | $479,000 | 0.4% | 26.1% |
| San Antonio, TX | $300,000 | 3.4% | 15.8% |
| San Diego, CA | $760,000 | -1.0% | 18.4% |
| San Francisco, CA | $1,600,000 | 0.6% | 9.1% |
| San Jose, CA | $1,365,000 | -2.5% | 14.2% |
| Seattle, WA | $749,000 | 1.7% | 20.8% |
| St. Louis, MO | $235,200 | -0.5% | 9.4% |
| Tacoma, WA | $505,000 | -0.9% | 18.8% |
| Tampa, FL | $310,000 | 0.0% | 19.2% |
| Tucson, AZ | $307,400 | -0.8% | 22.0% |
| Tulsa, OK | $225,000 | -1.5% | 9.8% |
| Honolulu, HI | $675,000 | 3.1% | 12.0% |
| Virginia Beach, VA | $290,000 | -0.2% | 5.8% |
| Warren, MI | $276,000 | -1.4% | 11.3% |
| Washington, D.C. | $509,400 | -2.0% | 8.4% |
| West Palm Beach, FL | $380,000 | 0.8% | 18.8% |
| Worcester, MA | $370,000 | 0.0% | 15.6% |
| National | $385,600 | -0.3% | 19.5% |
Homes Sold
| Redfin Metro | Homes Sold | Month-Over-Month | Year-Over-Year |
|---|---|---|---|
| Albany, NY | 1,125 | 4.4% | 16.7% |
| Allentown, PA | 1,101 | -0.8% | -2.7% |
| Anaheim, CA | 3,248 | -10.1% | 7.8% |
| Atlanta, GA | 10,897 | -6.3% | -8.6% |
| Austin, TX | 3,750 | -9.9% | -14.9% |
| Bakersfield, CA | 879 | -8.3% | -6.6% |
| Baltimore, MD | 4,765 | -12.4% | -2.6% |
| Baton Rouge, LA | 1,290 | -1.1% | -6.9% |
| Birmingham, AL | 1,702 | -12.0% | -5.4% |
| Boston, MA | 5,741 | -9.3% | 5.9% |
| Bridgeport, CT | 1,749 | -6.9% | -2.2% |
| Buffalo, NY | 1,145 | 6.1% | 28.5% |
| Camden, NJ | 2,032 | -8.6% | -8.3% |
| Charleston, SC | 1,878 | -15.2% | -15.3% |
| Charlotte, NC | 4,816 | -8.5% | -10.6% |
| Chicago, IL | 11,292 | -14.1% | 2.8% |
| Cincinnati, OH | 3,172 | -8.9% | -11.7% |
| Cleveland, OH | 3,306 | 0.9% | -2.4% |
| Columbus, OH | 3,287 | -3.0% | 0.6% |
| Dallas, TX | 6,863 | -6.1% | -19.3% |
| Dayton, OH | 1,257 | -1.6% | -2.4% |
| Denver, CO | 6,024 | -7.0% | -12.6% |
| Detroit, MI | 1,940 | -11.6% | -17.0% |
| El Paso, TX | 872 | -8.0% | -7.9% |
| Elgin, IL | 1,288 | -15.5% | -13.0% |
| Fort Lauderdale, FL | 3,858 | -12.3% | 16.2% |
| Fort Worth, TX | 3,367 | -3.1% | -19.7% |
| Frederick, MD | 2,069 | -11.8% | 2.3% |
| Fresno, CA | 843 | -12.4% | -5.4% |
| Grand Rapids, MI | 1,438 | -9.1% | -24.8% |
| Greensboro, NC | 1,139 | -4.0% | 4.1% |
| Greenville, SC | 1,379 | -10.5% | -2.5% |
| Hartford, CT | 1,948 | -4.4% | 0.0% |
| Houston, TX | 10,476 | -5.6% | -5.6% |
| Indianapolis, IN | 3,862 | -3.2% | -4.1% |
| Jacksonville, FL | 3,148 | -12.5% | -10.2% |
| Kansas City, MO | 3,948 | -7.2% | -7.7% |
| Knoxville, TN | 1,472 | -5.5% | -11.6% |
| Lake County, IL | 1,635 | -17.4% | -3.2% |
| Las Vegas, NV | 4,344 | -6.2% | 10.7% |
| Los Angeles, CA | 7,267 | -5.9% | 16.8% |
| Louisville, KY | 2,014 | -4.0% | -8.2% |
| McAllen, TX | 376 | -19.5% | -14.9% |
| Memphis, TN | 1,434 | -0.1% | -0.4% |
| Miami, FL | 3,650 | -16.0% | 30.1% |
| Milwaukee, WI | 2,383 | -2.9% | 1.3% |
| Minneapolis, MN | 6,849 | -10.9% | -3.6% |
| Montgomery County, PA | 3,017 | -7.6% | -1.9% |
| Nashville, TN | 4,061 | -8.8% | -12.4% |
| Nassau County, NY | 3,134 | 0.2% | 53.0% |
| New Brunswick, NJ | 3,790 | -4.0% | 2.2% |
| New Haven, CT | 1,291 | -3.6% | 1.3% |
| New Orleans, LA | 1,589 | -15.4% | -4.6% |
| New York, NY | 8,202 | 2.0% | 79.1% |
| Newark, NJ | 2,821 | -7.6% | 8.0% |
| North Port, FL | 2,246 | -21.4% | -6.7% |
| Oakland, CA | 3,252 | -5.9% | 14.3% |
| Oklahoma City, OK | 2,347 | -9.2% | -12.2% |
| Omaha, NE | 1,571 | -3.4% | -4.5% |
| Orlando, FL | 4,847 | -7.9% | 6.2% |
| Oxnard, CA | 950 | 1.2% | 6.9% |
| Philadelphia, PA | 2,744 | -14.4% | 6.8% |
| Phoenix, AZ | 8,619 | -11.9% | -12.4% |
| Pittsburgh, PA | 2,808 | -6.3% | -14.4% |
| Portland, OR | 4,493 | -2.4% | 1.2% |
| Providence, RI | 2,183 | -9.3% | -4.2% |
| Raleigh, NC | 2,542 | -18.9% | -17.5% |
| Richmond, VA | 925 | -18.7% | -52.3% |
| Riverside, CA | 5,962 | -3.4% | -0.8% |
| Rochester, NY | 1,251 | 1.1% | 10.3% |
| Sacramento, CA | 3,156 | -8.7% | -13.7% |
| San Antonio, TX | 3,533 | -6.4% | -14.0% |
| San Diego, CA | 3,816 | -5.9% | -0.4% |
| San Francisco, CA | 1,320 | -17.5% | 25.4% |
| San Jose, CA | 1,880 | -10.6% | 25.5% |
| Seattle, WA | 5,690 | -7.1% | 12.2% |
| St. Louis, MO | 4,576 | -6.7% | -2.5% |
| Tacoma, WA | 1,674 | -7.9% | 7.2% |
| Tampa, FL | 6,565 | -8.9% | -5.8% |
| Tucson, AZ | 1,655 | -14.2% | -11.3% |
| Tulsa, OK | 1,571 | -5.8% | -5.8% |
| Honolulu, HI | 1,052 | -8.8% | 36.6% |
| Virginia Beach, VA | 3,412 | -5.1% | 5.7% |
| Warren, MI | 4,099 | -6.3% | -17.3% |
| Washington, D.C. | 8,315 | -11.7% | 3.2% |
| West Palm Beach, FL | 3,407 | -19.9% | -2.9% |
| Worcester, MA | 1,300 | -2.8% | 1.6% |
| National | 604,000 | -0.2% | -1.5% |
New Listings
| Redfin Metro | New Listings | Month-Over-Month | Year-Over-Year |
|---|---|---|---|
| Albany, NY | 1,438 | -8.5% | 1.3% |
| Allentown, PA | 638 | -34.8% | -51.9% |
| Anaheim, CA | 3,208 | -5.9% | -13.6% |
| Atlanta, GA | 11,635 | -4.8% | 0.2% |
| Austin, TX | 4,928 | 0.1% | 9.1% |
| Bakersfield, CA | 1,051 | 3.3% | 1.8% |
| Baltimore, MD | 4,778 | -8.9% | -1.4% |
| Baton Rouge, LA | 724 | -32.1% | -42.7% |
| Birmingham, AL | 1,964 | -3.3% | 3.8% |
| Boston, MA | 5,422 | -26.6% | -14.2% |
| Bridgeport, CT | 1,734 | -13.7% | -25.9% |
| Buffalo, NY | 1,632 | -2.6% | -1.2% |
| Camden, NJ | 1,930 | -15.1% | -15.7% |
| Charleston, SC | 2,038 | 0.7% | -1.6% |
| Charlotte, NC | 3,595 | -22.8% | -31.4% |
| Chicago, IL | 13,697 | -8.3% | -1.3% |
| Cincinnati, OH | 3,754 | 0.2% | -0.3% |
| Cleveland, OH | 4,021 | -0.1% | 11.1% |
| Columbus, OH | 4,030 | 2.9% | 15.9% |
| Dallas, TX | 8,665 | 4.7% | 4.5% |
| Dayton, OH | 1,479 | 2.1% | 6.3% |
| Denver, CO | 6,221 | -14.2% | -8.9% |
| Detroit, MI | 2,745 | -0.1% | 0.3% |
| El Paso, TX | 1,092 | -8.2% | 8.0% |
| Elgin, IL | 1,527 | 0.0% | 0.7% |
| Fort Lauderdale, FL | 3,550 | -10.7% | -13.2% |
| Fort Worth, TX | 4,475 | 9.1% | 9.9% |
| Frederick, MD | 1,968 | -14.1% | -1.2% |
| Fresno, CA | 1,001 | -4.9% | 3.8% |
| Grand Rapids, MI | 1,684 | -3.7% | -11.5% |
| Greensboro, NC | 788 | -21.7% | -27.1% |
| Greenville, SC | 1,555 | -3.3% | -1.2% |
| Hartford, CT | 2,089 | -11.9% | -3.0% |
| Houston, TX | 13,368 | 0.1% | 12.0% |
| Indianapolis, IN | 4,333 | -1.0% | 6.1% |
| Jacksonville, FL | 3,507 | -4.5% | 9.7% |
| Kansas City, MO | 4,382 | -2.5% | 1.8% |
| Knoxville, TN | 1,455 | -3.8% | -0.3% |
| Lake County, IL | 1,907 | -8.1% | 4.0% |
| Las Vegas, NV | 5,044 | 4.1% | 15.1% |
| Los Angeles, CA | 8,411 | -0.9% | -0.6% |
| Louisville, KY | 2,226 | -2.2% | 2.4% |
| McAllen, TX | 555 | -3.6% | 20.7% |
| Memphis, TN | 1,611 | -1.9% | 13.8% |
| Miami, FL | 4,097 | -8.5% | 5.0% |
| Milwaukee, WI | 2,702 | -17.3% | 6.3% |
| Minneapolis, MN | 7,519 | -5.8% | 0.8% |
| Montgomery County, PA | 2,663 | -20.6% | -20.4% |
| Nashville, TN | 4,091 | 0.9% | -12.2% |
| Nassau County, NY | 3,767 | -11.0% | -18.1% |
| New Brunswick, NJ | 4,384 | -9.2% | -16.2% |
| New Haven, CT | 1,559 | 0.3% | 2.8% |
| New Orleans, LA | 1,920 | 3.1% | 10.1% |
| New York, NY | 8,973 | -14.2% | -26.6% |
| Newark, NJ | 3,027 | -14.7% | -14.7% |
| North Port, FL | 2,227 | -5.0% | -6.6% |
| Oakland, CA | 3,753 | -1.8% | 18.0% |
| Oklahoma City, OK | 2,910 | 1.0% | 9.7% |
| Omaha, NE | 1,473 | -8.5% | -5.1% |
| Orlando, FL | 5,331 | 0.0% | 4.5% |
| Oxnard, CA | 983 | -2.7% | 2.3% |
| Philadelphia, PA | 2,349 | -19.1% | -30.0% |
| Phoenix, AZ | 9,678 | -1.2% | 2.8% |
| Pittsburgh, PA | 3,428 | -1.3% | 1.4% |
| Portland, OR | 4,880 | -1.4% | 1.5% |
| Providence, RI | 2,655 | -7.8% | 3.4% |
| Raleigh, NC | 2,330 | -8.3% | -26.4% |
| Richmond, VA | 1,909 | 13.2% | -5.9% |
| Riverside, CA | 6,503 | -2.7% | 7.6% |
| Rochester, NY | 1,620 | -5.6% | 6.1% |
| Sacramento, CA | 3,768 | 0.3% | 4.1% |
| San Antonio, TX | 4,522 | 7.2% | 16.7% |
| San Diego, CA | 4,181 | -2.0% | -3.0% |
| San Francisco, CA | 1,290 | -15.1% | -24.1% |
| San Jose, CA | 2,033 | -3.3% | 20.4% |
| Seattle, WA | 6,029 | -7.4% | -0.9% |
| St. Louis, MO | 2,999 | -32.3% | -38.5% |
| Tacoma, WA | 1,941 | 1.0% | 5.4% |
| Tampa, FL | 7,334 | -1.8% | 10.5% |
| Tucson, AZ | 1,819 | -0.9% | 7.8% |
| Tulsa, OK | 1,938 | -0.5% | 16.3% |
| Honolulu, HI | 812 | -25.6% | -17.0% |
| Virginia Beach, VA | 3,835 | 2.9% | 20.0% |
| Warren, MI | 5,256 | -3.1% | -1.0% |
| Washington, D.C. | 7,683 | -16.2% | -11.1% |
| West Palm Beach, FL | 3,554 | -3.9% | -7.1% |
| Worcester, MA | 1,406 | -16.7% | 7.4% |
| National | 653,300 | 4.3% | 0.2% |
All Homes for Sale
| Redfin Metro | All Homes for Sale | Month-Over-Month | Year-Over-Year |
|---|---|---|---|
| Albany, NY | 3,281 | 0.9% | -8.5% |
| Allentown, PA | 1,608 | -19.2% | -41.5% |
| Anaheim, CA | 7,139 | -6.9% | -32.1% |
| Atlanta, GA | 22,985 | -0.5% | -30.4% |
| Austin, TX | 9,674 | 5.5% | -4.1% |
| Bakersfield, CA | 2,110 | 4.0% | -14.1% |
| Baltimore, MD | 8,934 | -5.1% | -25.8% |
| Baton Rouge, LA | 2,145 | -17.8% | -51.1% |
| Birmingham, AL | 4,838 | -0.2% | -19.9% |
| Boston, MA | 12,017 | -9.0% | -19.3% |
| Bridgeport, CT | 5,798 | -5.7% | -26.0% |
| Buffalo, NY | 2,779 | 2.9% | -11.5% |
| Camden, NJ | 4,093 | -8.4% | -29.5% |
| Charleston, SC | 5,458 | -2.1% | -29.3% |
| Charlotte, NC | 9,601 | -11.9% | -38.6% |
| Chicago, IL | 33,175 | 2.5% | -9.4% |
| Cincinnati, OH | 9,247 | 1.9% | -9.6% |
| Cleveland, OH | 8,665 | 5.0% | -4.6% |
| Columbus, OH | 8,894 | 5.3% | 0.1% |
| Dallas, TX | 16,632 | 5.5% | -29.7% |
| Dayton, OH | 2,885 | 6.0% | -8.7% |
| Denver, CO | 9,408 | -2.6% | -28.7% |
| Detroit, MI | 5,717 | 4.3% | -18.2% |
| El Paso, TX | 2,611 | -3.9% | -19.4% |
| Elgin, IL | 2,677 | 6.7% | -24.5% |
| Fort Lauderdale, FL | 11,756 | -8.0% | -31.9% |
| Fort Worth, TX | 8,387 | 11.6% | -22.1% |
| Frederick, MD | 3,696 | -7.4% | -22.1% |
| Fresno, CA | 1,815 | 0.8% | -7.0% |
| Grand Rapids, MI | 2,673 | 1.4% | -27.9% |
| Greensboro, NC | 1,956 | -13.8% | -40.3% |
| Greenville, SC | 3,995 | -1.0% | -23.5% |
| Hartford, CT | 5,585 | -4.7% | -15.9% |
| Houston, TX | 28,392 | 5.5% | -18.1% |
| Indianapolis, IN | 6,926 | 2.9% | -13.2% |
| Jacksonville, FL | 7,552 | 0.0% | -26.6% |
| Kansas City, MO | 8,482 | 3.5% | -8.7% |
| Knoxville, TN | 4,027 | -0.9% | -20.3% |
| Lake County, IL | 4,176 | 3.3% | -17.3% |
| Las Vegas, NV | 10,416 | 4.7% | -22.4% |
| Los Angeles, CA | 21,009 | -1.4% | -12.7% |
| Louisville, KY | 4,133 | -2.0% | -22.6% |
| McAllen, TX | 1,763 | -1.1% | -25.8% |
| Memphis, TN | 3,557 | 1.4% | -4.2% |
| Miami, FL | 15,562 | -5.4% | -22.6% |
| Milwaukee, WI | 7,571 | 2.2% | 3.1% |
| Minneapolis, MN | 13,979 | 2.1% | -15.1% |
| Montgomery County, PA | 5,330 | -9.9% | -35.1% |
| Nashville, TN | 8,570 | 2.8% | -37.2% |
| Nassau County, NY | 10,627 | -0.1% | -24.2% |
| New Brunswick, NJ | 10,540 | 0.2% | -24.0% |
| New Haven, CT | 4,150 | -1.6% | -12.3% |
| New Orleans, LA | 4,417 | 3.1% | -17.5% |
| New York, NY | 37,697 | -3.1% | -14.7% |
| Newark, NJ | 8,892 | 1.1% | -13.2% |
| North Port, FL | 3,786 | -5.5% | -50.6% |
| Oakland, CA | 6,075 | 4.2% | -3.0% |
| Oklahoma City, OK | 5,184 | 9.6% | -18.4% |
| Omaha, NE | 2,405 | -4.1% | -18.7% |
| Orlando, FL | 9,640 | 1.0% | -30.8% |
| Oxnard, CA | 2,291 | 0.8% | -18.0% |
| Philadelphia, PA | 6,180 | -13.8% | -34.8% |
| Phoenix, AZ | 19,470 | 0.6% | -16.0% |
| Pittsburgh, PA | 10,235 | 1.6% | -12.4% |
| Portland, OR | 8,154 | 4.3% | -16.2% |
| Providence, RI | 5,718 | 2.8% | -12.6% |
| Raleigh, NC | 5,036 | -9.5% | -43.6% |
| Richmond, VA | 3,088 | 26.5% | -28.8% |
| Riverside, CA | 14,020 | -1.8% | -18.9% |
| Rochester, NY | 2,594 | 0.3% | -15.3% |
| Sacramento, CA | 6,390 | 6.0% | -16.3% |
| San Antonio, TX | 8,682 | 5.9% | -23.7% |
| San Diego, CA | 7,443 | 0.2% | -18.9% |
| San Francisco, CA | 2,998 | -6.8% | -23.9% |
| San Jose, CA | 3,618 | -1.6% | -4.9% |
| Seattle, WA | 9,027 | -1.3% | -17.0% |
| St. Louis, MO | 7,811 | -15.4% | -37.2% |
| Tacoma, WA | 2,866 | 5.3% | -8.8% |
| Tampa, FL | 12,389 | -1.1% | -26.6% |
| Tucson, AZ | 4,297 | -1.8% | -14.2% |
| Tulsa, OK | 3,478 | 7.3% | -14.3% |
| Honolulu, HI | 3,065 | -9.4% | -27.1% |
| Virginia Beach, VA | 7,505 | 1.9% | -2.3% |
| Warren, MI | 9,857 | 6.5% | -18.9% |
| Washington, D.C. | 15,723 | -8.5% | -18.2% |
| West Palm Beach, FL | 10,382 | -5.1% | -36.7% |
| Worcester, MA | 2,859 | -4.1% | -10.7% |
| National | 1,328,900 | -0.1% | -25.2% |
Median Off-Market Redfin Estimate
| Redfin Metro | Estimate | Month-Over-Month | Year-Over-Year |
|---|---|---|---|
| Albany, NY | $225,600 | 1.5% | 12.7% |
| Allentown, PA | $246,100 | 1.8% | 14.5% |
| Anaheim, CA | $862,900 | 2.1% | 16.4% |
| Atlanta, GA | $278,000 | 2.4% | 17.6% |
| Austin, TX | $404,800 | 4.6% | 32.2% |
| Bakersfield, CA | $227,000 | 2.5% | 13.7% |
| Baltimore, MD | $310,600 | 1.4% | 13.1% |
| Baton Rouge, LA | $146,500 | 0.9% | 12.1% |
| Birmingham, AL | $155,700 | 1.6% | 13.4% |
| Boston, MA | $597,300 | 1.5% | 12.1% |
| Bridgeport, CT | $435,100 | 1.3% | 10.2% |
| Buffalo, NY | $176,300 | 1.6% | 14.6% |
| Camden, NJ | $246,800 | 2.0% | 17.7% |
| Charleston, SC | $277,100 | 2.0% | 14.6% |
| Charlotte, NC | $259,800 | 2.2% | 20.8% |
| Chicago, IL | $288,100 | 1.6% | 9.1% |
| Cincinnati, OH | $193,000 | 1.7% | 14.4% |
| Cleveland, OH | $164,000 | 1.7% | 13.8% |
| Columbus, OH | $228,600 | 1.4% | 12.6% |
| Dallas, TX | $302,500 | 2.2% | 15.9% |
| Dayton, OH | $146,800 | 1.6% | 14.3% |
| Denver, CO | $482,000 | 1.9% | 13.2% |
| Detroit, MI | $121,300 | 2.0% | 11.8% |
| Elgin, IL | $258,900 | 1.8% | 11.2% |
| Fort Lauderdale, FL | $311,200 | 1.4% | 12.2% |
| Fort Worth, TX | $257,400 | 2.1% | 14.9% |
| Frederick, MD | $470,100 | 1.4% | 12.1% |
| Fresno, CA | $312,100 | 1.8% | 17.8% |
| Grand Rapids, MI | $211,900 | 2.3% | 20.3% |
| Greensboro, NC | $165,300 | 1.7% | 18.5% |
| Greenville, SC | $187,100 | 1.7% | 14.2% |
| Hartford, CT | $247,200 | 1.2% | 9.1% |
| Houston, TX | $230,400 | 1.9% | 14.5% |
| Indianapolis, IN | $193,000 | 1.8% | 14.5% |
| Jacksonville, FL | $252,300 | 2.1% | 16.9% |
| Kansas City, MO | $213,500 | 1.6% | 14.4% |
| Knoxville, TN | $215,300 | 2.3% | 18.4% |
| Lake County, IL | $245,300 | 1.7% | 11.4% |
| Las Vegas, NV | $334,700 | 2.6% | 16.1% |
| Los Angeles, CA | $751,000 | 1.6% | 14.8% |
| Louisville, KY | $195,100 | -1.0% | 8.4% |
| Memphis, TN | $177,400 | 1.9% | 17.1% |
| Miami, FL | $357,400 | 1.4% | 12.2% |
| Milwaukee, WI | $236,200 | 1.6% | 12.1% |
| Minneapolis, MN | $308,800 | 1.4% | 11.1% |
| Montgomery County, PA | $371,800 | 1.7% | 13.2% |
| Nashville, TN | $321,600 | 2.3% | 13.7% |
| Nassau County, NY | $553,700 | 1.4% | 13.9% |
| New Brunswick, NJ | $402,300 | 1.7% | 15.1% |
| New Haven, CT | $253,900 | 1.5% | 12.3% |
| New Orleans, LA | $194,000 | 1.2% | 12.0% |
| Newark, NJ | $424,700 | 1.3% | 14.3% |
| North Port, FL | $281,800 | 2.3% | 17.5% |
| Oakland, CA | $937,900 | 2.1% | 19.3% |
| Oklahoma City, OK | $165,600 | 1.2% | 11.2% |
| Omaha, NE | $220,100 | 1.4% | 14.1% |
| Orlando, FL | $270,500 | 1.8% | 13.1% |
| Oxnard, CA | $702,200 | 1.9% | 15.8% |
| Philadelphia, PA | $224,200 | 1.7% | 14.7% |
| Phoenix, AZ | $344,900 | 2.8% | 23.6% |
| Pittsburgh, PA | $151,800 | 1.1% | 13.4% |
| Portland, OR | $464,500 | 1.7% | 14.4% |
| Providence, RI | $348,800 | 1.8% | 16.2% |
| Raleigh, NC | $302,400 | 2.5% | 15.1% |
| Richmond, VA | $269,100 | 1.6% | 11.4% |
| Riverside, CA | $411,700 | 2.6% | 22.5% |
| Rochester, NY | $166,200 | 1.6% | 12.7% |
| Sacramento, CA | $499,400 | 2.1% | 19.1% |
| Salt Lake City, UT | $436,100 | 3.0% | 20.2% |
| San Antonio, TX | $212,600 | 1.7% | 13.9% |
| San Diego, CA | $741,600 | 2.4% | 20.5% |
| San Francisco, CA | $1,463,900 | 1.5% | 6.6% |
| San Jose, CA | $1,354,700 | 1.3% | 16.4% |
| Seattle, WA | $684,200 | 1.7% | 18.8% |
| St. Louis, MO | $170,000 | 1.0% | 5.3% |
| Tacoma, WA | $452,300 | 1.6% | 20.0% |
| Tampa, FL | $255,600 | 1.1% | 13.7% |
| Tucson, AZ | $252,100 | 2.4% | 20.9% |
| Tulsa, OK | $149,700 | 1.5% | 11.1% |
| Honolulu, HI | $784,400 | 1.7% | 11.7% |
| Virginia Beach, VA | $262,200 | 1.3% | 10.8% |
| Warren, MI | $243,400 | 1.7% | 13.7% |
| Washington, D.C. | $455,700 | 1.4% | 12.0% |
| West Palm Beach, FL | $319,700 | 1.9% | 14.0% |
| Worcester, MA | $329,100 | 1.7% | 14.5% |
| National | $353,700 | 1.3% | 14.6% |


