
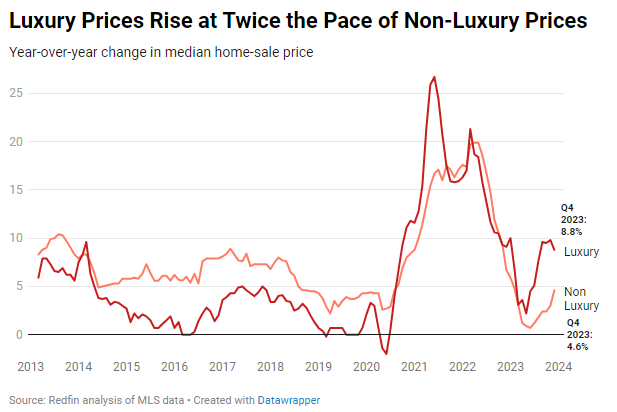
Prices of luxury homes rose at twice the pace of non-luxury homes at the end of 2023, partly because elevated mortgage rates are irrelevant to many affluent buyers. Low inventory is another factor driving prices up: Even though luxury new listings rose, overall supply is still below pre-pandemic norms.
The typical U.S. luxury home sold for a record $1.17 million in the fourth quarter, up 8.8% from a year earlier. Prices of non luxury homes increased at half the pace, rising 4.6% year over year to a record $340,000.
This is according to an analysis that divided all U.S. residential properties into tiers based on Redfin Estimates of the homes’ market values as of January 2024. This report defines luxury homes as those estimated to be in the top 5% of their respective metro area based on market value, and non luxury homes as those estimated to be in the 35th-65th percentile based on market value.
The outsized increase in luxury prices, along with a jump in luxury new listings and improving sales, signal that affluent homebuyers and sellers are becoming more active.
Share of luxury homes bought in cash hits record high
A record-high share of all-cash luxury home purchases drove the relative strength of the high-end housing market: Nearly half (46.5%) of the fourth quarter’s luxury purchases were made in cash, up from 40% a year earlier.
Luxury prices are rising at twice the rate of non-luxury prices largely because so many affluent buyers are able to buy homes in cash, rendering today’s elevated mortgage rates irrelevant. High mortgage rates have a more chilling effect on the rest of the market, upping interest payments and keeping price increases modest.
“A lot of luxury buyers are coming in with cash, snapping up expensive homes,” said Heather Mahmood-Corley, a Redfin Premier agent in Phoenix. “High-end homes are selling fast, especially in desirable areas like luxurious Scottsdale, or Tempe, which West Coast transplants love because it’s centrally located. One client recently bought a house in Tempe, flipped it, and it sold for $1.4 million in two days.”
Low inventory is another factor pushing luxury prices up. Even though the supply of luxury homes surged from a year earlier, it’s still well below pre-pandemic levels, leading to competition from well-heeled buyers over a limited number of homes.
New listings climb nearly 20% year over year to pre-pandemic levels
New listings of luxury homes jumped 19.7% year over year in the fourth quarter, the biggest increase in over two years. The increase brings the number of U.S. new luxury listings to just under 53,000, comparable to fourth-quarter levels in 2018 and 2019, just before the pandemic started.
By comparison, new listings of non luxury homes fell roughly 3% from a year earlier–though that’s the smallest decline in a year and a half.

Luxury new listings soared for several reasons:
- High-end sellers put their homes on the market to cash out while prices were high.
- The mortgage-rate lock-in effect doesn’t hold back affluent buyers as much as middle-income buyers.
- New listings had a lot of room to grow, as they were sitting at their lowest level in a decade at the end of 2022.
The total number of luxury homes for sale also soared, rising 13% year over year. Total non-luxury inventory dropped 9.7%.

Despite the big year-over-year jump, total luxury inventory is still below typical fourth-quarter levels. But the total supply of luxury homes is likely to rise more in 2024. That’s because new listings have already increased significantly, and more high-end homeowners are likely to jump on the selling bandwagon because they can command record-high prices.
“More luxury listings will temper price growth as the year goes on,” said Redfin Senior Economist Sheharyar Bokhari. “Overall, that’s a good thing for the high-end market: Sellers will still fetch fair prices, buyers will have more to choose from and sales should tick up.”
Luxury sales fall 2% from a year earlier–the smallest decline in over 2 years
Sales of luxury homes dropped 1.7% year over year in the fourth quarter, the smallest decline since the middle of 2021. That’s compared to an 8.1% decline for non-luxury homes, the smallest since the start of 2022–but four times bigger than the decline in luxury sales.
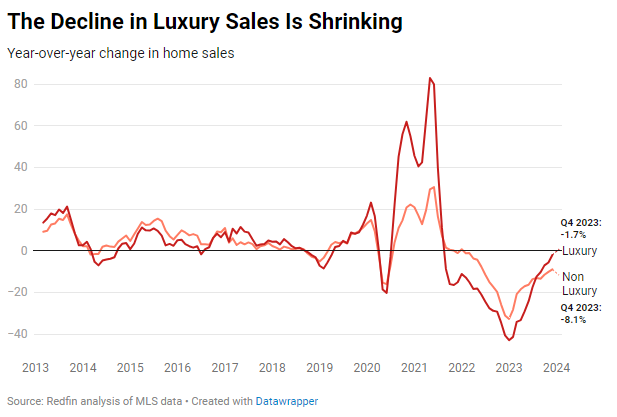
High-end sales posted a relatively small decline because of the uptick in new listings: More homes on the market lead to more sales. The lesser impact of high mortgage rates on affluent buyers is another reason luxury sales declined much less than non-luxury sales.
Metro-Level Luxury Highlights: Q4 2023
Redfin’s metro-level luxury data includes the 50 most populous U.S. metro areas. Some metros are removed from time to time, to ensure data accuracy. All changes noted below are year-over-year changes.
- Prices: The median sale price of luxury homes rose most in Newark, NJ (11.6%), New Brunswick, NJ (10.9%) and Orlando (10.8%). It fell in just eight metros, with the biggest declines in Austin, TX (-8.6%), Las Vegas (-6.1%) and Jacksonville, FL (-2.3%).
- New listings: New listings of luxury homes rose most in Phoenix (42.3%), Tampa, FL (41.6%) and New York (31.6%). They fell most in Milwaukee (-16.7%), Baltimore, MD (-10.2%) and Chicago (-4.4%).
- Active listings: The total number of luxury homes for sale increased most in Austin, TX (44.5%), San Antonio, TX (33.1%) and Tampa, FL (30.4%). It fell most in Detroit, MI (-14.7%), Oakland, CA (-12.6%) and Newark, NJ (-11.9%).
- Home sales: Luxury home sales increased most in Las Vegas (33.9%), Tampa, FL (24.3%) and Pittsburgh, PA (21.5%). They fell most in New York (-21%), Charlotte, NC (-21%) and Kansas City, MO (-20.8%).
10 Most Expensive U.S. Home Sales: Q4 2023
-
- Miami, FL (Indian Creek Village): $79M
- New York, NY: $75M
- New York, NY: $65.6M
- Aspen, CO (Glenwood Springs): $60M
- New York, NY: $47M
- Aspen, CO (Glenwood Springs): $42.3M
- San Francisco, CA (Atherton): $40M
- Fort Lauderdale, FL: $40M
- Miami, FL (Miami Beach): $35.4M
- Los Angeles, CA: $34.6M
| Luxury Housing-Market Summary by Metro Area: Q4 2023 | ||||||
| Median sale price | Median sale price, YoY | Active listings, YoY | New listings, YoY | Homes sold, YoY | Days on market | |
| Anaheim, CA | $4,050,000 | 9.1% | 12.4% | 23.2% | 16.8% | 59 |
| Atlanta, GA | $1,312,500 | 10.8% | -0.7% | 5.8% | 3.4% | 38 |
| Austin, TX | $1,690,000 | -8.6% | 44.5% | 28.0% | 13.5% | 91 |
| Baltimore, MD | $1,125,000 | 7.1% | -8.8% | -10.2% | -6.9% | 33 |
| Boston, MA | $2,244,500 | 2.3% | 11.8% | 9.9% | -3.2% | 33 |
| Charlotte, NC | $1,350,000 | 8.9% | 6.8% | 26.4% | -21.0% | 43 |
| Chicago, IL | $1,200,000 | 9.1% | -11.6% | -4.4% | -1.6% | 73 |
| Cincinnati, OH | $793,750 | 5.3% | -10.1% | 7.3% | -2.6% | 19 |
| Cleveland, OH | $700,000 | 2.9% | -0.7% | 11.2% | -5.7% | 35 |
| Columbus, OH | $855,000 | 8.2% | 13.1% | 14.0% | 4.5% | 45 |
| Dallas, TX | $1,400,000 | 6.5% | 18.7% | 15.0% | 4.4% | 46 |
| Denver, CO | $1,625,000 | -0.8% | 26.4% | 15.1% | -1.7% | 32 |
| Detroit, MI | $610,000 | 1.7% | -14.7% | 5.9% | -12.8% | 22 |
| Fort Lauderdale, FL | $1,685,000 | 8.7% | 11.7% | 20.8% | 7.7% | 85 |
| Fort Worth, TX | $1,018,000 | -0.7% | 26.6% | 26.4% | 11.0% | 51 |
| Houston, TX | $1,153,600 | 5.5% | 9.7% | 15.1% | -6.4% | 39 |
| Indianapolis, IN | $849,065 | 6.6% | 11.3% | 7.2% | -3.0% | 24 |
| Jacksonville, FL | $1,320,000 | -2.3% | 24.7% | 28.3% | 8.1% | 45 |
| Kansas City, MO | $869,900 | 3.8% | 12.1% | 5.8% | -20.8% | 33 |
| Las Vegas, NV | $1,150,000 | -6.1% | -8.0% | 20.4% | 33.9% | 64 |
| Los Angeles, CA | $3,525,000 | 3.7% | 11.3% | 8.4% | -1.4% | 61 |
| Miami, FL | $2,825,000 | 8.7% | 12.0% | 20.3% | -5.4% | 119 |
| Milwaukee, WI | $910,000 | 7.1% | -1.8% | -16.7% | -1.3% | 56 |
| Minneapolis, MN | $987,500 | 0.6% | 20.8% | 26.6% | 2.5% | 35 |
| Montgomery County, PA | $1,300,000 | 8.3% | -7.5% | -2.3% | -15.1% | 37 |
| Nashville, TN | $1,630,922 | 5.9% | 29.0% | 22.5% | -4.2% | 84 |
| Nassau County, NY | $2,500,000 | 6.0% | 5.0% | 26.4% | -8.3% | 71 |
| New Brunswick, NJ | $1,875,000 | 10.9% | -8.7% | 9.5% | -9.1% | 51 |
| New York, NY | $3,500,000 | 0.4% | 9.3% | 31.6% | -21.0% | 142 |
| Newark, NJ | $1,600,000 | 11.6% | -11.9% | -3.9% | 0.0% | 34 |
| Oakland, CA | $2,760,000 | 7.8% | -12.6% | 8.0% | -8.6% | 14 |
| Orlando, FL | $1,163,250 | 10.8% | 16.2% | 30.1% | -0.4% | 29 |
| Philadelphia, PA | $1,000,000 | 2.6% | 9.0% | 20.1% | -18.2% | 38 |
| Phoenix, AZ | $1,630,000 | 4.8% | 13.5% | 42.3% | 19.5% | 52 |
| Pittsburgh, PA | $749,900 | -2.2% | 22.8% | 23.0% | 21.5% | 63 |
| Portland, OR | $1,295,000 | -0.1% | 19.2% | 3.9% | 0.3% | 43 |
| Providence, RI | $1,410,000 | 8.5% | 3.2% | 6.2% | 2.5% | 51 |
| Riverside, CA | $1,400,000 | 5.7% | 9.8% | 16.2% | 17.6% | 50 |
| Sacramento, CA | $1,481,500 | 5.5% | 7.3% | 21.8% | 14.2% | 44 |
| San Antonio, TX | $950,000 | 3.3% | 33.1% | 24.0% | -9.7% | 63 |
| San Diego, CA | $3,235,000 | 10.2% | 12.1% | 9.6% | 1.7% | 59 |
| San Francisco, CA | $4,850,000 | 2.1% | 10.8% | 0.8% | 15.6% | 31 |
| San Jose, CA | $4,559,500 | 9.5% | -11.6% | 5.9% | 3.7% | 15 |
| Seattle, WA | $2,618,000 | -0.1% | 4.5% | 11.7% | 8.8% | 21 |
| St. Louis, MO | $838,207 | 6.0% | -2.8% | -1.5% | -5.8% | 20 |
| Tampa, FL | $1,385,800 | 2.7% | 30.4% | 41.6% | 24.3% | 24 |
| Virginia Beach, VA | $1,034,450 | 8.9% | -4.3% | 3.6% | -7.8% | 31 |
| Warren, MI | $850,000 | 4.9% | -0.3% | 8.5% | -12.7% | 32 |
| Washington, DC | $1,700,000 | 4.6% | 6.8% | 6.2% | -4.6% | 37 |
| West Palm Beach, FL | $2,750,000 | 3.8% | 25.3% | 31.6% | 3.8% | 71 |
| U.S. | $1,170,000 | 8.8% | 13.0% | 19.7% | -1.7% | 50 |


