As the job market strengthened for lower-wage workers, mortgage forbearance came to an end and investors ramped up purchases, sales and supply rose in the most affordable part of the housing market at the end of last year. Meanwhile, sales of luxury homes fell.
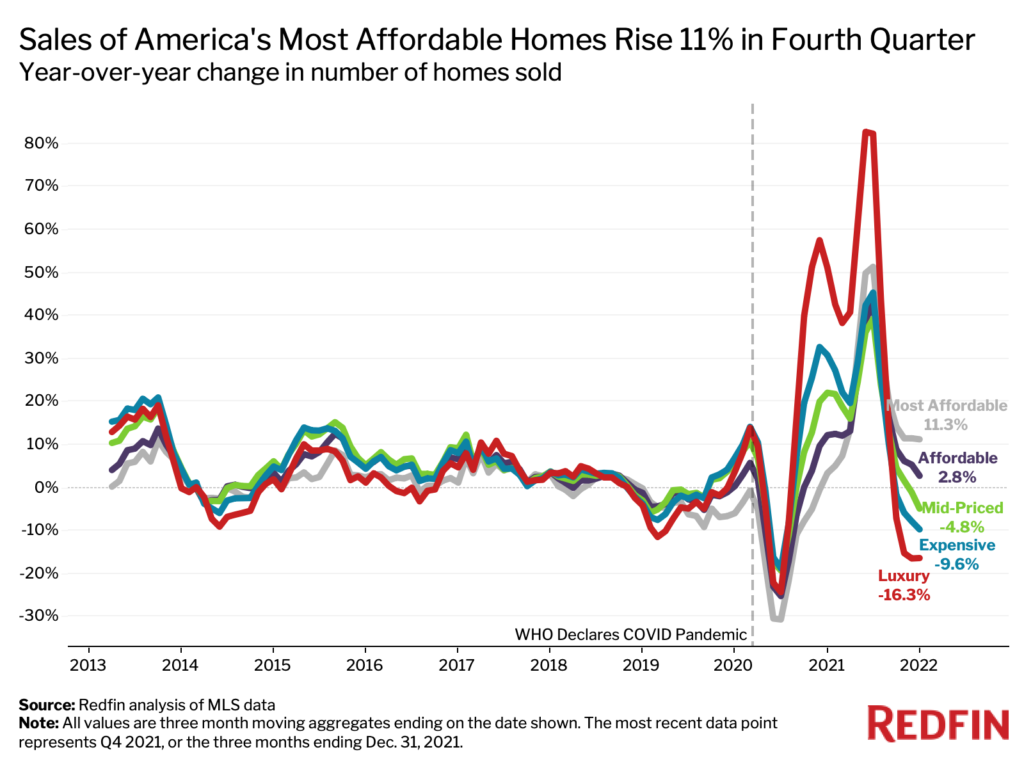
Sales of the most affordable homes in the U.S. rose 11.3% year over year in the fourth quarter of 2021, while sales of luxury homes dropped 16.3%.
That’s according to an analysis that divides all U.S. residential properties into five price tiers—luxury, expensive, mid-priced, affordable and most affordable—based on Redfin Estimates of the homes’ market value. The methodology section at the bottom of this report has more information about how we determined which homes were placed in each bucket.
Sales of affordable homes are on the rise as the job market strengthens, especially for lower-wage workers, and real estate investors buy a record share of U.S. homes. At the same time, inventory in the most affordable price tier is up as the end of pandemic-driven mortgage forbearance and foreclosure moratorium policies encourages Americans to put their homes on the market.
“The market for homes at lower price points is booming for a few reasons. Not only is there demand from workers who are now earning higher wages, but investors, who have an appetite for lower-priced homes, are buying up properties at record rates,” said Redfin Chief Economist Daryl Fairweather. “And with the end of both mortgage forbearance and the foreclosure moratorium, many homeowners who don’t have much cash in the bank are choosing to sell their homes to clear their mortgage debt, providing plenty of supply to meet the high demand.”
For luxury homes, the big year-over-year sales drop is partly due to a surge during the fourth quarter of 2020, when affluent Americans took advantage of low mortgage rates and remote work to buy high-end homes. Sales are also constrained by a lack of supply. Luxury sales are still elevated above pre-pandemic levels—sales were up by nearly 27% from the last quarter of 2019 to the last quarter of 2021—but the initial pandemic-driven frenzy for high-end homes is calming down.
Before the onset of the pandemic in early 2020, sales growth was similar for all five price tiers.
But as luxury sales increased throughout the second half of 2020, sales of the most affordable homes grew much more slowly as many lower-income Americans lost their jobs and struggled financially.
| U.S. Housing Market Summary, Q4 2021 | |||||
| Luxury | Expensive | Mid-Priced | Affordable | Most Affordable | |
| Homes sold, YoY change | -16.3% | -9.6% | -4.8% | 2.8% | 11.3% |
| Number of homes for sale (active listings), YoY change | -21% | -14.7% | -10.8% | -1.9% | 18.6% |
| Number of new listings, YoY change | -7.1% | -8.3% | -7.5% | 4.4% | 31% |
| Median sale price | $1,038,200 | $470,000 | $310,000 | $215,600 | $127,500 |
| Median sale price, YoY change | 17.3% | 15.8% | 18.8% | 16.5% | 10.9% |
| Median days on market | 39 (-18 YoY) | 26 (-9 YoY) | 22 (-5 YoY) | 24 (-4 YoY) | 28 (-6 YoY) |
Supply is up for affordable homes, down for luxury homes
The number of the most affordable homes for sale rose 18.6% in the fourth quarter, making it the only tier to experience an inventory increase. Supply of luxury homes fell 21% during the same time period, the biggest drop of all five price tiers.
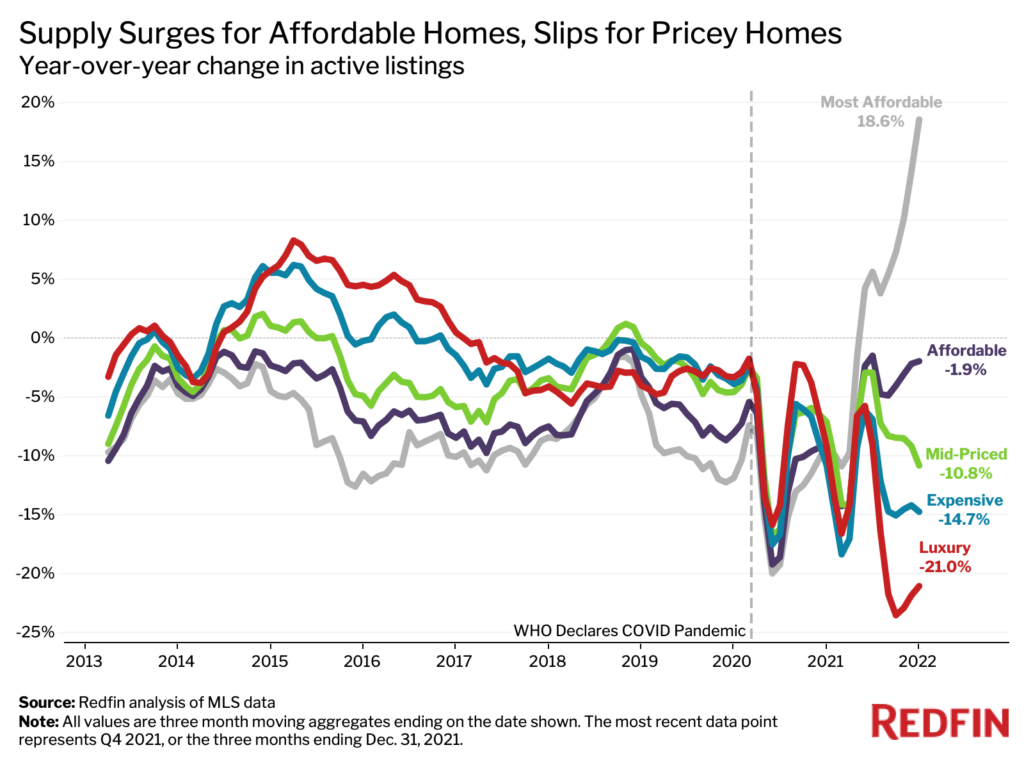
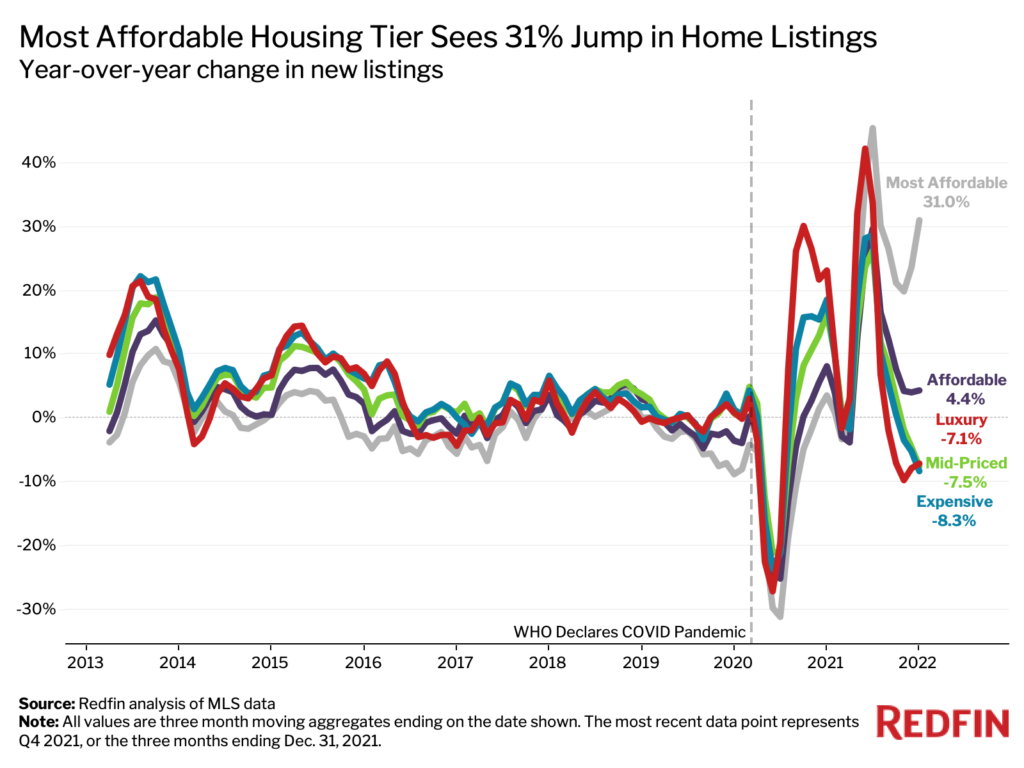
The uptick in affordable homes for sale is partly because of owners putting their homes on the market due to the end of mortgage forbearance and the foreclosure moratorium, as discussed above. New listings of the most affordable homes rose 31% year over year in the fourth quarter, while new listings in the other tiers either declined or grew by less than 5%.
“Some experts were worried the end of forbearance would cause a glut of housing supply and eventually lead to a housing-market crash, but there’s plenty of demand to snap up the inventory,” Fairweather said. “The fact that both supply and sales of the most affordable homes shot up at the end of 2021 is solid evidence of that.”
In the luxury and mid-priced segments of the market, the supply deficit is due largely to a lack of homes hitting the market. New listings of luxury homes for sale fell 7.1% year over year in the fourth quarter, while new listings of mid-priced homes fell by 7.5%.
Sale prices continued to rise in every segment of the market
Sale prices increased by double digits in all five tiers as home prices soared throughout the country in response to a shortage of supply and relatively low mortgage rates.
The median sale price for mid-priced homes jumped 18.8% year over year to $310,000, the biggest increase of all the price tiers. Prices of luxury homes increased 17.3% to about $1 million, while prices of the most affordable homes rose 10.9% to $127,500.
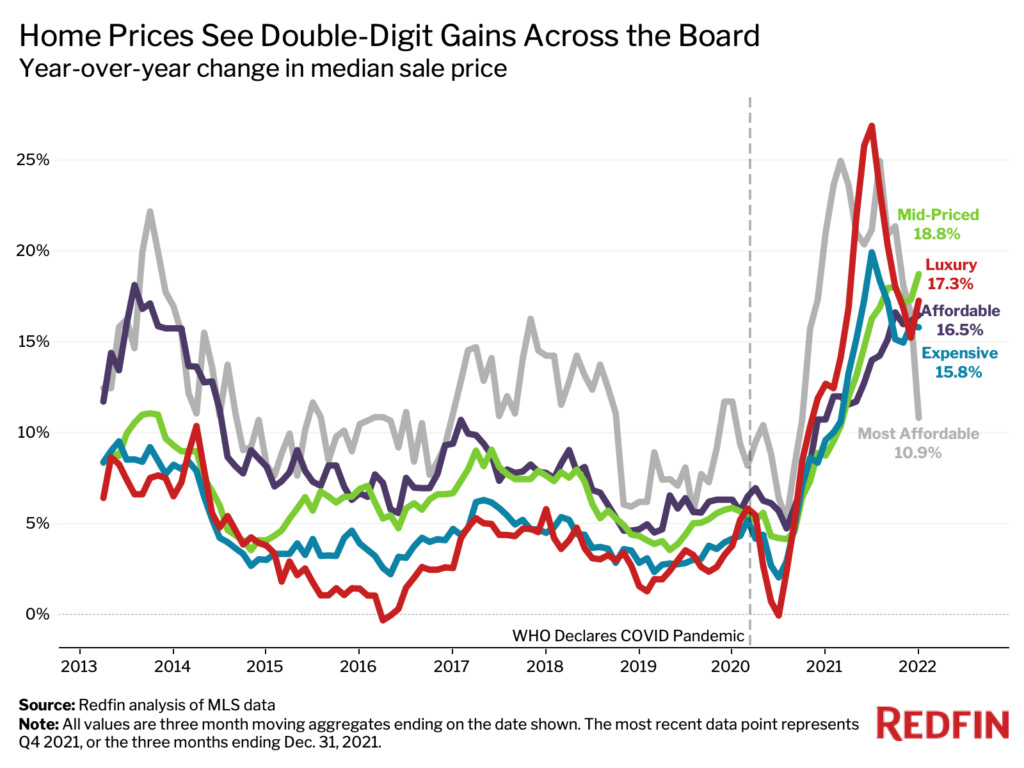
Home prices are up significantly in every tier because of strong demand across the board. Price growth for the most affordable homes slowed from the beginning of the year because of the uptick in the number of affordable homes for sale.
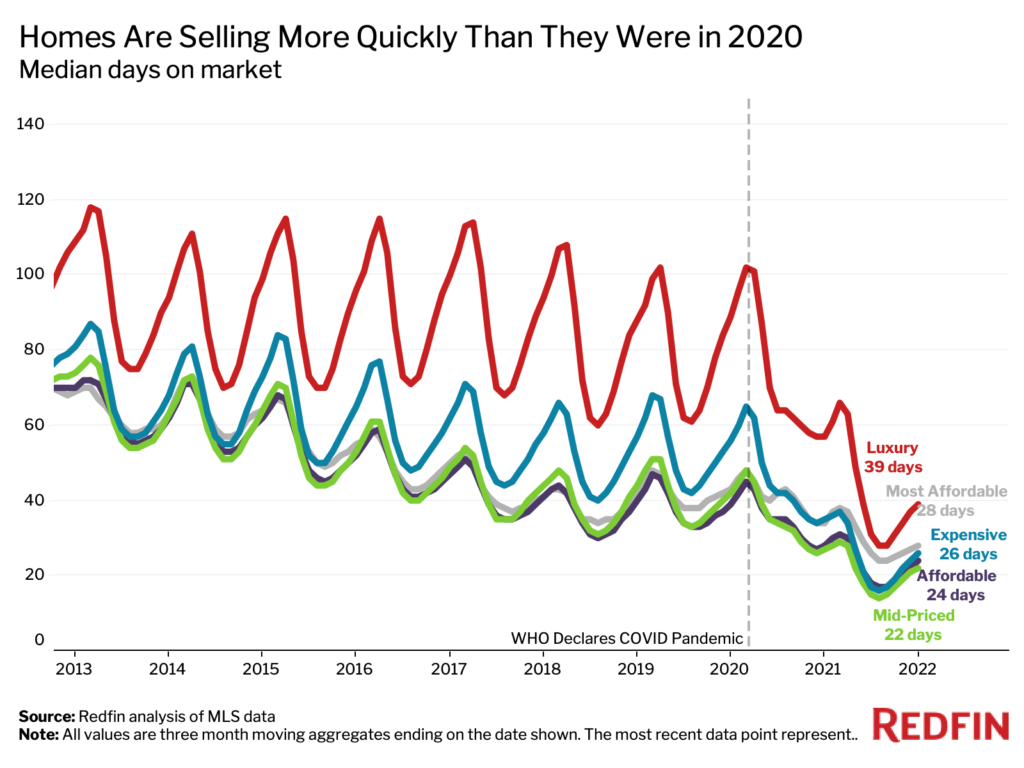
Homes are selling faster than a year ago
The typical luxury home that was for sale during the fourth quarter spent 39 days on the market, 18 fewer days than a year earlier. The most affordable homes spent less time on the market (28), as is typical for lower-priced homes. That’s six fewer days than the year before.
The severe supply shortage in the luxury market is one cause of high-end homes picking up speed quicker than their more affordable counterparts. With a major dip in the number of luxury homes for sale, there’s more competition for the ones that are available.
Local highlights, fourth quarter 2021
Below are metro-level takeaways for the luxury and most affordable price tiers for the fourth quarter of 2021. We analyzed the 50 most populous U.S. metropolitan areas.
Sales
- Sales of luxury homes dropped most in Nassau County, NY (-46% YoY), Newark, NJ (-40.8%) and Sacramento, CA (-38.7%). Sales of luxury homes increased most in New York (69.2%), San Francisco (16.2%) and St. Louis (7.2%).
- Sales of the most affordable homes increased most in St. Louis (74.4%), Charlotte, NC (67.5%) and Jacksonville, FL (52.1%). Sales of the most affordable homes dropped most in San Diego (-38.9%), Pittsburgh (-27.2%) and Detroit (-20%).
Supply
- The number of luxury homes for sale dropped most in three California metros: Sacramento (-50.9%), Anaheim (-40.1%) and Oakland (-39.8%). The number of luxury homes for sale increased in just two metros: Warren, MI (15.3%) and San Antonio (8.5%).
- The number of the most affordable homes for sale rose most in Pittsburgh (114.6%), Philadelphia (106.1%) and Detroit (93.5%). The number dropped most in West Palm Beach (-37.7%), San Diego (-37.5%) and Fort Lauderdale (-30.7%).
Prices
- Luxury home prices increased in all the metros in this analysis. They rose most in Miami (31.9%), Riverside, CA (29.7%) and Austin (28.7%). Luxury home prices increased the least in New York (5.5%), Philadelphia (5.9%) and St. Louis (6.3%).
- Prices of the most affordable homes rose most in Jacksonville (51.1%), St. Louis (50%) and Atlanta (37.5%). Prices of the most affordable homes dropped in just one metro: San Francisco (-0.8%).
Speed
- Luxury homes sold fastest in Indianapolis (5 days), Seattle (6) and Oakland (9). Luxury homes sold slowest in New York (103), Miami (93) and Pittsburgh (74).
- The most affordable homes sold fastest in Denver, Seattle and Tampa (10 days apiece). The most affordable homes sold slowest in New York (72), Pittsburgh (70) and Milwaukee (57).
Methodology
We divided all U.S. residential properties into five buckets. There are three equal-sized tiers, as well as tiers for the bottom 5% and top 5% of the market, based on Redfin Estimates of the homes’ market values. The top 5% of the market by price is considered “luxury” for the purposes of this report, while the bottom 5% is titled “most affordable.” The “affordable” tier is homes estimated to be in the 5th-35th percentile. The “mid-priced” tier represents homes estimated to be in the 35th-65th percentile. The “expensive” tier represents homes estimated to be in the 65th-95th percentile. By using Redfin Estimates of homes’ market value, we are able to use the same group of homes to report on price, sales and inventory.