
National home sales rose by an annual rate of 1 percent in March, the smallest increase in sixteen months, while new listings grew 6.8 percent compared to last year.
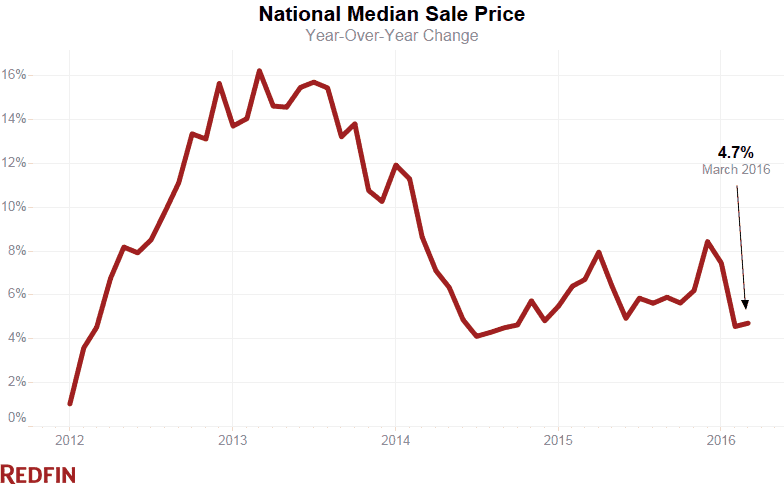
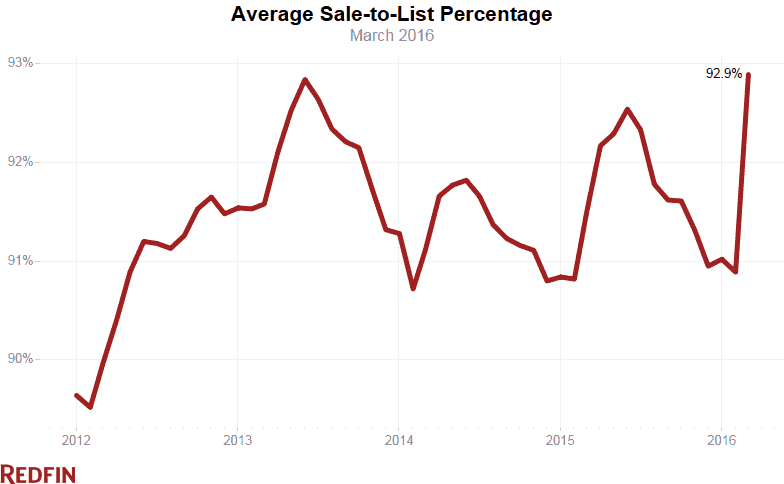
The median sale price rose 4.7 percent year over year, about the same rate as in February and below the 12-month average of 6.1 percent growth. The average sale-to-list price ratio climbed to 92.9 percent, the highest level we’ve seen since we began tracking it in 2009.
| Market Summary | March 2016 | Month-Over-Month | Year-Over-Year |
|---|---|---|---|
| Median sale price | $265,200 | 5.7% | 4.7% |
| Homes sold | 164,600 | 29.5% | 1.0% |
| New listings | 267,600 | 24.1% | 6.8% |
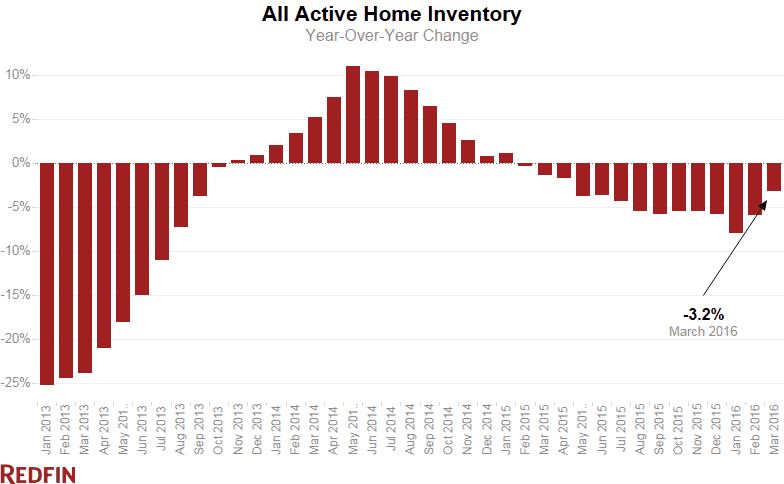
| All Homes for sale | 521,600 | 5.6% | -3.2% |
| Median days on market | 38 | -9 | -6 |
| Months of supply | 3.2 | -0.7 | -0.1 |
| Sold above list | 21.6% | 3.6% | 2.9% |
| Average Sale-to-list | 92.9% | 2.0% | 1.2% |
Overall inventory fell year over year by 3.2 percent, the 14th consecutive month of declines despite a 6.8 percent increase in new listings.
Is San Francisco Previewing What’s to Come?
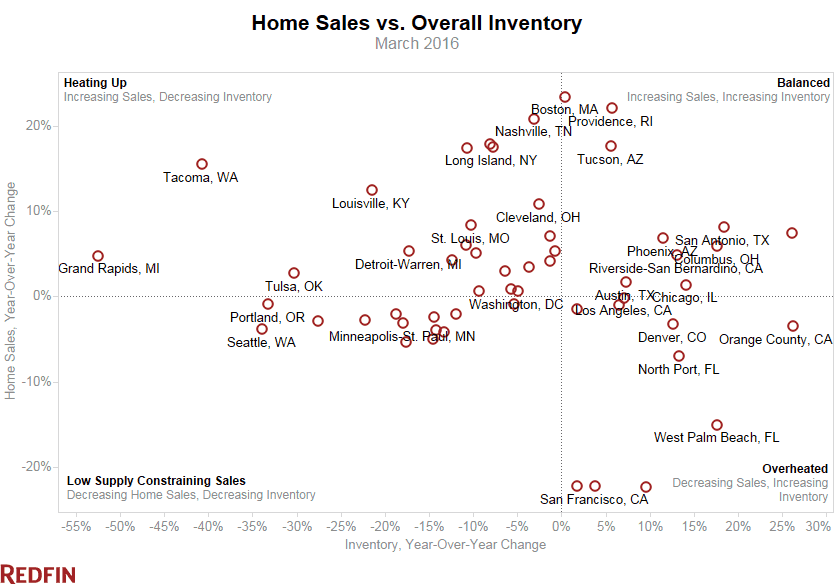
The story emerging elsewhere in 2016 is one of historically low inventory in select regions driving record-setting competition and beginning to constrain home sales. In hot markets like Seattle, Portland and Minneapolis, which saw double-digit sales growth in 2015, sales are now falling for the first time since mid-2014 as a result of inventory declines greater than 30 percent in some places.
“Last year sales grew 7 percent nationally, but there simply aren’t enough homes for sale to maintain such a torrid pace again this year,” says Redfin chief economist Nela Richardson. “No matter how high homebuyer demand is, it takes two to tango, and many sellers are sitting this year out.”
In San Francisco, home prices fell for the first time in four years. The median sale price, which averaged 15 percent growth in 2015, fell by 1.8 percent year over year to $1,042,500. At the same time, sales plummeted 22.1% percent. With nearly every listing in a bidding war, virtually nothing to buy and most homes selling for over $1,000,000, San Francisco could be affirming that at some point, the pressure will burst.
“For years San Francisco has been one of, if not the most, competitive markets in the country,” said Richardson. “Now we are seeing this white hot market start to cool and contract. The share of Redfin offers facing competition dropped to 77 percent in March from 94 percent last year. This suggests that the price drop is not about inventory, it’s about buyers fed up with high Bay Area prices and crazy competition.”
Other markets like Tacoma, WA, Grand Rapids, MI and Louisville, KY, are following the same trend of decreasing inventory. However because the trend started later, and with prices remaining relatively affordable, sales are continuing to grow.
Something to note about last month’s relatively low growth in home sales is that the Easter holiday, which typically puts a damper on home-buying activity, occurred on the last weekend of March, and may have pushed some sales into April.
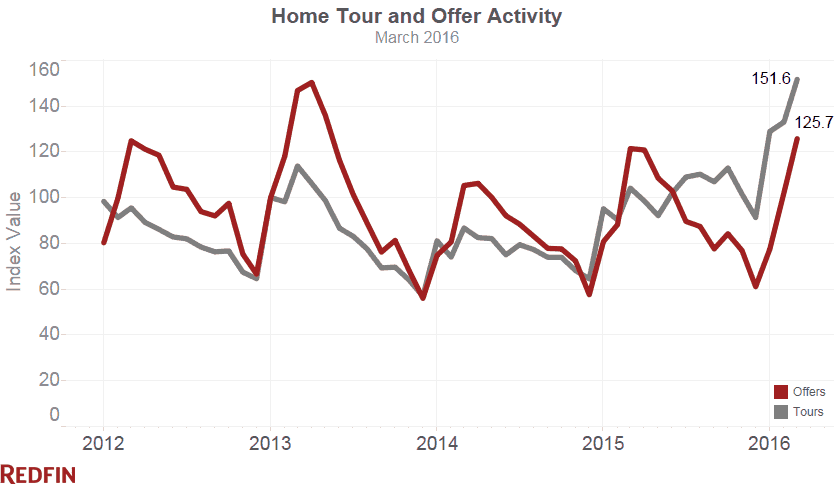
With demand remaining strong, more homes selling above asking price and nearly a third of new listings selling in less than two weeks, increased growth in April and May listings – which are typically the most active months of the year for housing – will push sales higher again. The Redfin home tour index reached its highest level for the third month straight, and offers surged to their highest level in almost three years. But in markets that have already seen double-digit drops in inventory, new listing growth will need to be at least as high as it was in February and March to meet demand.
Other March Highlights
Prices
- Portland, OR had the nation’s highest price growth, rising 16.1% since last year to $325,000. Jacksonville, FL prices rose 13.5% to $185,000 and in Tampa the median sale price rose 12.1% to $176,000.
- While San Francisco had the highest median sale price in the nation at $1,042,500, that number actually fell 1.8% year over year, and declined by 0.7% month over month, an unusual change from February to March. In neighboring San Jose, prices rose 3% to $860,000 and Oakland rose 5.4% to $590,000
Sales
- Boston led the nation in year-over-year sales growth, rising 23.4%, followed by Providence, RI, rising 22.1%.
- Dallas saw the largest decline in sales since last year, falling 22.4% since March of 2015. Home sales in San Jose and San Francisco both declined by 22.2%.
- Most metro regions in the West saw year-over-year declines in home sales, including Denver (-3.2%), Fresno (-2.1%), Oakland (-4.1%), Orange County (-3.5%), Portland (-1.0%), San Diego (-2.5%), San Francisco (-22.2%), San jose (-22.2%), and Seattle (-3.8%). Sales were relatively flat in Los Angeles (-0.2%), Sacramento (-0.9%) and Ventura County (0.8%), and rose by 4.2% in Las Vegas, 6.8% in Phoenix and 4.9% in Riverside-San Bernardino.
Competition
- Denver and Seattle were the fastest markets, with half of all homes pending sale in just 7 and 8 days, respectively. Median days on market in Denver was the same as in March of 2015, but 6 days faster in Seattle. Portland was the next fastest market with 11 median days on market.
- 77.5% of homes in San Francisco sold above list price, followed by 72.4% in San Jose and 71.8% in Oakland. In Indianapolis, only 8.7% of homes sold over asking, and 8.8% in West Palm Beach, FL.
- Seattle, (up 2.5 percentage points to 101.6%), Tacoma, WA (up 2.1 percentage points to 98.2%), and Portland (up 2 percentage points to 100.1%) had the largest annual increases in the average sale-to-asking percentage, while San Francisco retained the highest figure with the average home selling for 106.9% of the asking price.
Inventory
- Grand Rapids continued to see the largest decrease in overall inventory, falling 52.5% since last March. Tacoma (-40.7%), Seattle (-33.9%), and Portland (-33.2%) also continued seeing far fewer homes available on the market than a year ago.
- Orange County, CA and Houston both had the highest increases in the number of homes for sale, each up 26.2% year over year.
You can download data from the March Market Tracker in an Excel Spreadsheet.
For additional local analysis, see: Chicago | Los Angeles | Miami | San Francisco | Washington, D.C.
Median Sale Price
| Redfin Metro | Median Sale Price | Month-Over-Month | Year-Over-Year |
|---|---|---|---|
| Akron, OH | $112,450 | -2.2% | 0.4% |
| Albany, NY | $180,000 | 3.0% | 0.1% |
| Allentown, PA | $165,100 | 2.5% | 3.2% |
| Atlanta, GA | $200,000 | 5.3% | 6.4% |
| Austin, TX | $277,500 | 2.8% | 6.7% |
| Baltimore, MD | $235,000 | 4.4% | 3.0% |
| Boston, MA | $324,000 | 6.3% | 3.3% |
| Buffalo, NY | $120,000 | 1.7% | 6.0% |
| Charleston, SC | $238,000 | 0.0% | 3.5% |
| Charlotte, NC | $205,000 | 9.0% | 4.3% |
| Chicago, IL | $205,000 | 10.8% | 5.1% |
| Cincinnati, OH | $150,000 | 12.6% | 11.1% |
| Cleveland, OH | $115,800 | 10.3% | 5.3% |
| Columbus, OH | $165,500 | 4.1% | 8.9% |
| Dallas-Fort Worth, TX | $225,000 | 3.2% | 8.7% |
| Denver, CO | $345,000 | 5.2% | 9.5% |
| Detroit-Warren, MI | $132,750 | 10.6% | 11.0% |
| Fort Lauderdale, FL | $203,000 | -1.5% | 9.7% |
| Fresno, CA | $229,000 | 9.8% | 6.5% |
| Grand Rapids, MI | $144,800 | 3.5% | 9.7% |
| Greenville, SC | $170,000 | 0.0% | 4.2% |
| Hampton Roads, VA | $202,800 | 2.3% | 0.4% |
| Honolulu, HI | $515,000 | -2.8% | 3.0% |
| Houston, TX | $213,000 | 5.4% | 1.5% |
| Indianapolis, IN | $151,125 | 9.9% | 5.8% |
| Jacksonville, FL | $185,000 | 10.1% | 13.5% |
| Las Vegas, NV | $200,000 | -1.3% | 5.3% |
| Little Rock, AR | $141,538 | -2.4% | -4.0% |
| Long Island, NY | $370,000 | 0.0% | 2.8% |
| Los Angeles, CA | $509,000 | 2.8% | 8.3% |
| Louisville, KY | $156,250 | 8.5% | 0.8% |
| Memphis, TN | $145,000 | 5.1% | 7.4% |
| Miami, FL | $237,514 | -1.9% | 5.3% |
| Minneapolis-St. Paul, MN | $219,900 | 7.3% | 5.2% |
| Nashville, TN | $238,164 | 4.0% | 8.8% |
| New Orleans, LA | $187,500 | 3.6% | 5.6% |
| North Port, FL | $228,000 | 1.8% | 9.1% |
| Oakland, CA | $590,000 | 6.5% | 5.4% |
| Omaha, NE | $162,500 | 1.6% | 4.8% |
| Orange County, CA | $608,500 | 3.6% | 5.8% |
| Orlando, FL | $192,300 | 3.9% | 8.4% |
| Philadelphia, PA | $219,900 | 4.7% | 0.2% |
| Phoenix, AZ | $219,900 | 1.3% | 7.3% |
| Portland, OR | $325,000 | 6.7% | 16.1% |
| Providence, RI | $205,000 | 5.1% | 11.7% |
| Richmond, VA | $208,000 | 7.2% | 1.5% |
| Riverside-San Bernardino, CA | $312,000 | 4.0% | 5.8% |
| Rochester, NY | $123,000 | 11.9% | 4.3% |
| Sacramento, CA | $330,000 | 3.9% | 9.3% |
| San Antonio, TX | $199,815 | 4.9% | 7.4% |
| San Diego, CA | $487,000 | 4.3% | 5.9% |
| San Francisco, CA | $1,042,500 | -0.7% | -1.8% |
| San Jose, CA | $860,000 | 6.2% | 3.0% |
| Seattle, WA | $420,000 | 5.6% | 10.4% |
| St. Louis, MO | $158,950 | 6.0% | 3.5% |
| Tacoma, WA | $264,900 | 6.0% | 9.0% |
| Tampa, FL | $176,000 | 3.5% | 12.1% |
| Tucson, AZ | $180,000 | 5.1% | 2.6% |
| Tulsa, OK | $145,000 | 0.0% | 0.6% |
| Ventura County, CA | $520,000 | -0.6% | 7.0% |
| Washington, DC | $355,000 | 4.4% | 1.4% |
| West Palm Beach, FL | $231,000 | 2.7% | 10.0% |
| Wilmington, DE | $197,800 | 4.4% | 0.1% |
| National | $265,200 | 5.7% | 4.7% |
Homes Sold
| Redfin Metro | Homes Sold | Month-Over-Month | Year-Over-Year |
|---|---|---|---|
| Akron, OH | 724 | 38.2% | 3.0% |
| Albany, NY | 634 | 21.7% | 17.8% |
| Allentown, PA | 536 | 14.3% | -2.7% |
| Atlanta, GA | 8,499 | 29.5% | 4.3% |
| Austin, TX | 2,498 | 33.7% | 1.7% |
| Baltimore, MD | 2,802 | 21.4% | 5.1% |
| Boston, MA | 5,046 | 29.7% | 23.4% |
| Buffalo, NY | 675 | -4.7% | -4.4% |
| Charleston, SC | 1,288 | 27.7% | -1.5% |
| Charlotte, NC | 2,590 | 33.9% | 2.7% |
| Chicago, IL | 8,595 | 35.5% | 1.4% |
| Cincinnati, OH | 1,823 | 31.3% | 3.5% |
| Cleveland, OH | 2,050 | 27.9% | 10.8% |
| Columbus, OH | 2,015 | 42.4% | 5.9% |
| Dallas-Fort Worth, TX | 5,524 | -5.2% | -22.4% |
| Denver, CO | 3,918 | 30.8% | -3.2% |
| Detroit-Warren, MI | 5,313 | 19.7% | 5.3% |
| Fort Lauderdale, FL | 2,923 | 23.7% | -3.7% |
| Fresno, CA | 691 | 16.1% | -2.1% |
| Grand Rapids, MI | 924 | 34.9% | 4.8% |
| Greenville, SC | 778 | 41.5% | -1.0% |
| Hampton Roads, VA | 1,741 | 29.7% | 7.1% |
| Honolulu, HI | 792 | 43.5% | 17.3% |
| Houston, TX | 6,353 | 30.5% | 7.4% |
| Indianapolis, IN | 2,210 | 31.5% | -2.9% |
| Jacksonville, FL | 2,002 | 25.8% | -2.1% |
| Las Vegas, NV | 3,456 | 30.5% | 4.2% |
| Little Rock, AR | 760 | 26.2% | 5.3% |
| Long Island, NY | 1,855 | 5.0% | 17.5% |
| Los Angeles, CA | 5,852 | 37.1% | -0.2% |
| Louisville, KY | 1,160 | 22.5% | 12.4% |
| Memphis, TN | 991 | 30.6% | 6.8% |
| Miami, FL | 2,622 | 20.1% | -16.2% |
| Minneapolis-St. Paul, MN | 3,775 | 44.1% | -3.1% |
| Nashville, TN | 2,761 | 36.4% | 20.8% |
| New Orleans, LA | 1,181 | 27.4% | 3.5% |
| North Port, FL | 1,836 | 38.5% | -7.0% |
| Oakland, CA | 2,095 | 44.7% | -4.1% |
| Omaha, NE | 873 | 32.3% | -5.3% |
| Orange County, CA | 2,495 | 38.9% | -3.5% |
| Orlando, FL | 3,490 | 25.4% | -5.0% |
| Philadelphia, PA | 3,349 | 20.6% | 6.0% |
| Phoenix, AZ | 8,055 | 45.4% | 6.8% |
| Portland, OR | 3,127 | 36.6% | -1.0% |
| Providence, RI | 818 | 20.6% | 22.1% |
| Richmond, VA | 1,228 | 31.6% | -4.0% |
| Riverside-San Bernardino, CA | 4,709 | 37.1% | 4.9% |
| Rochester, NY | 713 | 5.6% | -2.1% |
| Sacramento, CA | 2,524 | 31.3% | -0.9% |
| San Antonio, TX | 2,325 | 26.2% | 8.1% |
| San Diego, CA | 2,958 | 34.0% | -2.5% |
| San Francisco, CA | 981 | 44.7% | -22.2% |
| San Jose, CA | 1,161 | 53.4% | -22.2% |
| Seattle, WA | 3,575 | 37.0% | -3.8% |
| St. Louis, MO | 2,492 | 41.0% | 8.3% |
| Tacoma, WA | 1,225 | 47.4% | 15.5% |
| Tampa, FL | 5,055 | 25.6% | 0.7% |
| Tucson, AZ | 1,374 | 37.0% | 17.6% |
| Tulsa, OK | 1,095 | 34.2% | 2.7% |
| Ventura County, CA | 728 | 48.9% | 0.8% |
| Washington, DC | 5,694 | 28.6% | 0.6% |
| West Palm Beach, FL | 2,725 | 27.9% | -15.0% |
| Wilmington, DE | 569 | 6.0% | -0.9% |
| National | 164,600 | 29.5% | 1.0% |
New Listings
| Redfin Metro | New Listings | Month-Over-Month | Year-Over-Year |
|---|---|---|---|
| Akron, OH | 1,232 | 26.2% | 0.0% |
| Albany, NY | 1,493 | 34.5% | 11.7% |
| Allentown, PA | 1,532 | 40.6% | 14.4% |
| Atlanta, GA | 11,063 | 28.8% | 9.8% |
| Austin, TX | 3,845 | 27.1% | 11.8% |
| Baltimore, MD | 5,904 | 52.2% | 19.8% |
| Boston, MA | 11,305 | 65.4% | 24.9% |
| Buffalo, NY | 1,489 | 33.5% | 8.3% |
| Charleston, SC | 2,266 | 24.2% | 9.6% |
| Chicago, IL | 19,976 | 20.5% | 2.7% |
| Cincinnati, OH | 3,411 | 25.8% | -0.2% |
| Cleveland, OH | 3,663 | 26.0% | 2.3% |
| Columbus, OH | 2,990 | 32.8% | -0.7% |
| Dallas-Fort Worth, TX | 10,584 | 17.5% | 14.3% |
| Denver, CO | 5,360 | 31.5% | -1.9% |
| Detroit-Warren, MI | 8,523 | 19.1% | -5.6% |
| Fresno, CA | 1,031 | 22.4% | -8.9% |
| Grand Rapids, MI | 1,362 | 31.3% | -2.4% |
| Greenville, SC | 1,196 | 32.7% | 2.9% |
| Hampton Roads, VA | 3,395 | 18.0% | 11.6% |
| Honolulu, HI | 1,132 | 4.7% | -2.6% |
| Houston, TX | 11,466 | 13.2% | 22.0% |
| Indianapolis, IN | 4,117 | 38.2% | 7.4% |
| Jacksonville, FL | 3,122 | 13.8% | 8.9% |
| Las Vegas, NV | 5,127 | 13.5% | 3.7% |
| Little Rock, AR | 1,425 | 8.2% | 6.9% |
| Long Island, NY | 4,409 | 34.5% | 4.3% |
| Los Angeles, CA | 10,040 | 18.3% | 9.8% |
| Louisville, KY | 1,988 | 40.1% | 6.0% |
| Memphis, TN | 1,627 | 17.9% | 8.3% |
| Minneapolis-St. Paul, MN | 7,740 | 35.3% | -0.6% |
| Nashville, TN | 4,575 | 22.6% | 11.0% |
| New Orleans, LA | 2,037 | 16.0% | 1.8% |
| North Port, FL | 2,557 | -8.5% | -0.1% |
| Oakland, CA | 3,120 | 23.7% | -4.2% |
| Omaha, NE | 1,672 | 38.6% | -1.1% |
| Orange County, CA | 4,347 | 21.4% | 14.4% |
| Orlando, FL | 4,953 | 8.5% | -3.6% |
| Philadelphia, PA | 7,809 | 38.0% | 6.8% |
| Phoenix, AZ | 10,611 | 5.4% | 7.3% |
| Portland, OR | 4,185 | 16.6% | -6.1% |
| Providence, RI | 1,786 | 55.7% | 23.3% |
| Richmond, VA | 2,520 | 37.7% | 8.7% |
| Riverside-San Bernardino, CA | 8,008 | 13.8% | 13.0% |
| Rochester, NY | 1,907 | 39.0% | 9.3% |
| San Antonio, TX | 3,820 | 26.4% | 24.8% |
| San Diego, CA | 4,596 | 8.5% | -4.2% |
| San Francisco, CA | 1,570 | 16.6% | -1.1% |
| San Jose, CA | 2,023 | 38.7% | 9.9% |
| Seattle, WA | 5,150 | 35.3% | 0.9% |
| St. Louis, MO | 4,605 | 27.5% | -1.0% |
| Tacoma, WA | 1,575 | 25.1% | -5.6% |
| Tampa, FL | 6,886 | 5.2% | 1.1% |
| Tucson, AZ | 1,957 | 5.8% | -0.9% |
| Tulsa, OK | 1,885 | 8.8% | -1.7% |
| Ventura County, CA | 1,155 | 23.4% | 2.8% |
| Washington, DC | 12,762 | 63.3% | 16.6% |
| West Palm Beach, FL | 4,433 | -0.8% | 4.0% |
| Wilmington, DE | 1,283 | 40.2% | 4.9% |
| National | 267,600 | 24.1% | 6.8% |
All Homes for Sale
| Redfin Metro | All Homes for Sale | Month-Over-Month | Year-Over-Year |
|---|---|---|---|
| Akron, OH | 3,182 | 3.6% | -6.4% |
| Albany, NY | 4,197 | 1.4% | -8.1% |
| Allentown, PA | 3,883 | -14.2% | -22.2% |
| Atlanta, GA | 20,102 | 0.9% | -12.4% |
| Austin, TX | 5,580 | 7.8% | 7.3% |
| Baltimore, MD | 11,272 | 3.7% | -9.6% |
| Boston, MA | 17,436 | 7.8% | 0.5% |
| Buffalo, NY | 3,645 | -28.9% | -47.5% |
| Charleston, SC | 6,567 | 5.8% | 1.8% |
| Chicago, IL | 45,902 | 20.7% | 14.1% |
| Cincinnati, OH | 9,998 | 8.6% | -3.6% |
| Cleveland, OH | 10,270 | 6.2% | -2.6% |
| Columbus, OH | 6,597 | 34.2% | 17.6% |
| Dallas-Fort Worth, TX | 14,904 | 9.3% | 9.6% |
| Denver, CO | 5,289 | 8.4% | 12.7% |
| Detroit-Warren, MI | 14,459 | -10.5% | -17.2% |
| Fresno, CA | 1,700 | -6.9% | -18.7% |
| Grand Rapids, MI | 2,020 | -4.2% | -52.5% |
| Greenville, SC | 3,182 | 21.5% | 6.5% |
| Hampton Roads, VA | 8,786 | 5.3% | -1.3% |
| Honolulu, HI | 3,349 | -5.1% | -10.7% |
| Houston, TX | 23,283 | 1.9% | 26.2% |
| Indianapolis, IN | 8,405 | 3.2% | -27.5% |
| Jacksonville, FL | 7,598 | -0.4% | -11.9% |
| Las Vegas, NV | 15,012 | 2.1% | -1.2% |
| Little Rock, AR | 4,480 | 10.9% | -0.7% |
| Long Island, NY | 13,602 | 4.2% | -7.8% |
| Los Angeles, CA | 15,796 | 10.0% | 7.1% |
| Louisville, KY | 3,332 | 1.3% | -21.4% |
| Memphis, TN | 4,226 | 3.0% | -2.9% |
| Minneapolis-St. Paul, MN | 11,865 | 6.8% | -18.0% |
| Nashville, TN | 8,427 | 4.6% | -3.1% |
| North Port, FL | 8,146 | 4.5% | 13.3% |
| Oakland, CA | 2,554 | 9.8% | -13.3% |
| Omaha, NE | 2,164 | 2.8% | -17.6% |
| Orange County, CA | 7,547 | 23.6% | 26.2% |
| Orlando, FL | 11,874 | -0.9% | -14.5% |
| Philadelphia, PA | 19,447 | 6.3% | -10.8% |
| Phoenix, AZ | 24,116 | 9.1% | 11.5% |
| Portland, OR | 4,224 | -1.3% | -33.2% |
| Providence, RI | 3,941 | 4.5% | 5.7% |
| Richmond, VA | 4,110 | 2.9% | -14.2% |
| Riverside-San Bernardino, CA | 17,771 | 4.7% | 13.1% |
| San Antonio, TX | 7,525 | 8.4% | 18.4% |
| San Diego, CA | 6,144 | -1.4% | -14.4% |
| San Francisco, CA | 2,060 | 7.1% | 3.8% |
| San Jose, CA | 2,491 | 27.1% | 1.8% |
| Seattle, WA | 3,904 | 2.0% | -33.9% |
| St. Louis, MO | 9,783 | 6.5% | -10.2% |
| Tacoma, WA | 1,837 | -7.0% | -40.7% |
| Tampa, FL | 16,372 | 2.7% | -9.3% |
| Tucson, AZ | 5,868 | 15.4% | 5.6% |
| Tulsa, OK | 4,206 | -27.1% | -30.2% |
| Ventura County, CA | 1,645 | 6.3% | -5.7% |
| Washington, DC | 17,465 | 12.9% | -4.9% |
| West Palm Beach, FL | 14,441 | 8.5% | 17.6% |
| Wilmington, DE | 3,653 | 5.3% | -5.4% |
| National | 521,600 | 5.6% | -3.2% |
Methodology: Redfin’s National Market Tracker follows housing trends in the country’s largest metropolitan areas (those with population 500,000 or greater) served by Redfin agents. Analysis by Redfin is based on all residential home sales transacted on the multiple-listing service and supplemented by county recorder data where available. Data may be subject to revision. Metropolitan divisions are based the latest definitions released by the Bureau of Labor Statistics. To view a breakdown of these regions, click here.
For more information, contact Redfin journalist services
Phone: 206-588-6863
Email: press@redfin.com
To be added to Redfin’s press release distribution list, subscribe here.
Other popular posts:
1. The Parent’s Guide to Creating a Baby-Safe Home Interior
2. How-To-Guide for Helping Your Kids Become City Dwellers
3. The Art and Science of Homeschooling: What You Need to Know


