
Nationwide, a record share of homebuyers are relocating, many in search of affordability as prices and mortgage rates soar.
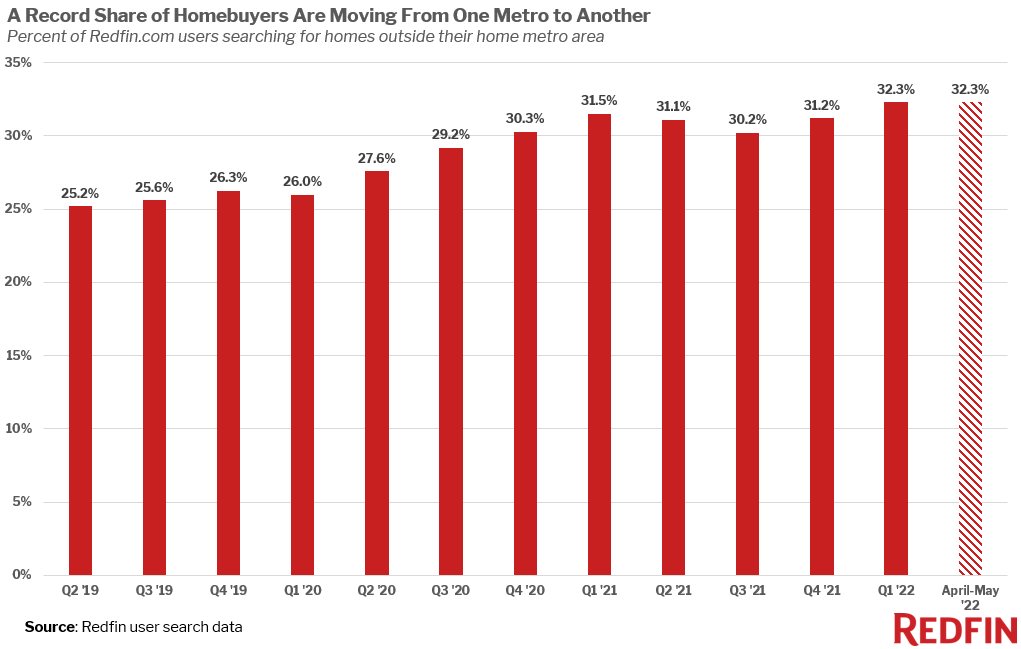
Homebuyer migration remained at an all-time high in April and May, with 32.3% of Redfin.com users nationwide looking to move to a different metro area. While that’s unchanged from the record set in the first quarter, it’s up from about 26% before the pandemic began.
Even as the housing market cools down from the pandemic-driven frenzy, many homebuyers are keen on moving from one part of the country to another. That’s largely because homebuyers are chasing affordability, moving to places like the Southwest and parts of Florida where homes are more affordable than pricey coastal metros.
Housing costs have skyrocketed and mortgage rates have shot up, making buying a home in expensive places like the Bay Area and New York even less attainable for the typical American. And because many buyers now work from home permanently, it’s more feasible to relocate to relatively affordable places like parts of the Sun Belt.
Florida is the most popular location for relocating homebuyers
Two Florida metros topped the list of most popular destinations for homebuyers moving from one metro to another in April and May: Miami and Tampa. That’s measured by net inflow, or how many more Redfin.com users looked to move into an area than leave.
Miami has topped the list all year, and Tampa just surpassed Phoenix for the number-two spot. Phoenix had held the number-two spot since last fall; now it comes in at number three, followed by Sacramento and Las Vegas.
Tampa is becoming more popular with relocating homebuyers largely because it’s relatively affordable, with the typical home selling for $370,000 in April. Although Tampa prices were up nearly 28% year over year, they were still well below the national median of $424,000. It’s the only metro on the top-five list where that’s the case. The typical home sells for $475,000 in Miami, $480,000 in Phoenix, $605,000 in Sacramento and $445,000 in Las Vegas.
Migration into Tampa has steadily ticked up since the pandemic began. Tampa had a net inflow of more than 11,000 homebuyers in the first quarter, up from roughly 7,600 a year earlier and about 4,000 two years earlier.
Redfin agents say Tampa is still seeing a pandemic-driven boom of people moving in from out of town, mostly from New York and other parts of the Northeast where homes are more expensive. Some are moving to Tampa permanently to work remotely, while others are investors buying properties to rent out.
San Antonio, the 9th most popular destination in April and May, has also seen a big increase in relocating homebuyers. Nearly 5,000 homebuyers looked to move to San Antonio in April and May, up from about 3,200 a year earlier. San Antonio is relatively affordable, with the typical home selling for $330,000 in April.
| Top 10 Metros by Net Inflow of Users and Their Top Origins | |||||||
| Rank | Metro* | Net Inflow, April & May 2022† | Net Inflow, April & May 2021 | Portion of Searches from Users Outside the Metro, April & May 2022 | Portion of Searches from Users Outside the Metro, April & May 2021 | Top Origin | Top Out-of-State Origin
|
| 1 | Miami, FL | 11,350 | 7,338 | 33.8% | 32.0% | New York, NY | New York, NY |
| 2 | Tampa, FL | 8,756 | 6,530 | 50.3% | 59.8% | Orlando, FL | New York, NY |
| 3 | Phoenix, AZ | 8,706 | 9,493 | 36.6% | 38.5% | Los Angeles, CA | Los Angeles, CA |
| 4 | Sacramento, CA | 8,362 | 7,656 | 42.6% | 48.5% | San Francisco, CA | Seattle, WA |
| 5 | Las Vegas, NV | 7,434 | 9,011 | 46.5% | 53.4% | Los Angeles, CA | Los Angeles, CA |
| 6 | Cape Coral, FL | 6,073 | 5,420 | 67.4% | 77.0% | Chicago, IL | Chicago, IL |
| 7 | North Port, FL | 5,710 | 4,013 | 67.3% | 79.0% | Chicago, IL | Chicago, IL |
| 8 | San Diego, CA | 5,200 | 2,673 | 31.5% | 29.5% | Los Angeles, CA | Seattle, WA |
| 9 | San Antonio, TX | 4,802 | 3,260 | 42.7% | 46.7% | Austin, TX | Los Angeles, CA |
| 10 | Dallas, TX | 4,518 | 7,211 | 25.1% | 32.1% | Los Angeles, CA | Los Angeles, CA
|
| *Combined statistical areas with at least 500 users in April & May 2022
†Negative values indicate a net outflow; among the two million users sampled for this analysis only |
|||||||
Homebuyers are moving away from San Francisco, Los Angeles and New York
San Francisco, Los Angeles and New York saw more homebuyers looking to leave than any other metro in April and May. Washington, D.C. and Seattle round out the top five. That’s based on net outflow, a measure of how many more Redfin.com users looked to leave an area than move in.
It’s worth noting that fewer homebuyers are leaving New York than a year ago. New York had a net outflow of about 30,000 in April and May, down from more than 45,000 a year earlier. Migration out of New York is slowing as some workers return to the offices, cultural events ramp back up and housing prices soar in the suburbs.
Expensive coastal job centers perennially top the list of metros homebuyers are leaving. As discussed above, that trend has picked up during the pandemic as remote work has become more popular and people are able to move to more affordable parts of the country.
| Top 10 Metros by Net Outflow of Users and Their Top Destinations | |||||||
| Rank | Metro* | Net Outflow, April & May 2022† | Net Outflow, April & May 2021 | Portion of Local Users Searching Elsewhere, April & May 2022 | Portion of Local Users Searching Elsewhere, April & May 2021 | Top Destination | Top Out-of-State Destination
|
| 1 | San Francisco, CA | 41,474 | 32,308 | 22.9% | 23.0% | Sacramento, CA | Seattle, WA |
| 2 | Los Angeles, CA | 33,571 | 25,857 | 19.1% | 19.0% | San Diego, CA | Las Vegas, NV |
| 3 | New York, NY | 30,076 | 45,971 | 28.2% | 36.5% | Philadelphia, PA | Philadelphia, PA |
| 4 | Washington, DC | 20,808 | 14,952 | 16.7% | 15.0% | Salisbury, MD | Salisbury, MD |
| 5 | Seattle, WA | 17,851 | 5,838 | 17.9% | 15.5% | Phoenix, AZ | Phoenix, AZ |
| 6 | Boston, MA | 10,581 | 3,288 | 17.9% | 14.9% | Portland, ME | Portland, ME |
| 7 | Detroit, MI | 5,947 | 2,235 | 33.8% | 26.7% | Cleveland, OH | Cleveland, OH |
| 8 | Chicago, IL | 5,166 | 6,264 | 13.8% | 13.3% | Cape Coral, FL | Cape Coral, FL |
| 9 | Denver, CO | 4,770 | 8,616 | 29.2% | 31.8% | Chicago, IL | Chicago, IL |
| 10 | Portland, OR | 2,359 | -1,066 | 18.0% | 17.2% | Seattle, WA | Seattle, WA
|
| *Combined statistical areas with at least 500 users in April & May 2022
†Among the two million users sampled for this analysis only |
|||||||
Methodology
The latest migration analysis is based on a sample of about two million Redfin.com users who searched for homes across more than 100 metro areas so far in the second quarter, excluding searches unlikely to precede an actual relocation or home purchase. Popularity of migration destinations is measured by net inflow, or how many more Redfin.com users looked to move into an area than leave. The list of places people are leaving is ranked by net outflow, a measure of how many more Redfin.com users looked to leave an area than move in.
To be included in this dataset, a Redfin.com user must have viewed at least 10 homes in a particular metro area, and homes in that area must have made up at least 80% of the user’s searches. Redfin’s migration data goes back to 2017.


