- Las Vegas, Florida and Sacramento are the most popular destinations for U.S. residents who are moving to a different metro area.
- 9 of the 10 top migration destinations are in the Sun Belt; the exception is Spokane.
- Los Angeles, New York and Seattle are losing house hunters faster than anywhere else.
- Nationwide, 19% of house hunters are looking to move to a different metro area.
Las Vegas is America’s hottest destination. It topped the list of metro areas house hunters looked to move to in the second quarter, followed by three Florida metros: North Port, Orlando and Miami. Redfin ranks by net inflow: how many more Redfin.com house hunters are looking to move in than move out.
Los Angeles, New York and Seattle are losing more house hunters than anywhere else in the country. This is based on net outflow: how many more Redfin.com house hunters are looking to move out than move in.

This is from a Redfin analysis of Redfin.com homebuyers and renters searching outside their home metro area. A Redfin.com user counts as a migrant if they viewed at least 20 for-sale homes in an origin-destination pair in the relevant month. Please see the end of this report for more on methodology.
All in all, nine of the 10 most popular destinations are in the Sun Belt: Sacramento, CA, Cape Coral, FL, Tampa, FL, Myrtle Beach, SC, Spokane, WA and San Antonio round out the list. One reason people are moving to the Sun Belt is, well, the sun. But the bigger reason is affordability. The typical Las Vegas home sells for $447,000, compared with $922,000 in Los Angeles, the most common origin of people moving into Sin City.
| Top 10 Metros House Hunters Are Moving Into, Q2 2026
Ranked by net inflow of Redfin.com home searchers Top 100 U.S. metros |
||||
| Rank | Metro area | Net inflow | Top origin | Top out-of-state origin |
| 1 | Las Vegas, NV | 9,581 | Los Angeles, CA | Los Angeles, CA |
| 2 | North Port, FL | 5,873 | Chicago, IL | Chicago, IL |
| 3 | Orlando, FL | 5,742 | New York, NY | New York, NY |
| 4 | Miami, FL | 5,239 | New York, NY | New York, NY |
| 5 | Sacramento, CA | 5,227 | San Jose, CA | Seattle, WA |
| 6 | Cape Coral, FL | 4,776 | Chicago, IL | Chicago, IL |
| 7 | Tampa, FL | 4,260 | New York, NY | New York, NY |
| 8 | Myrtle Beach, SC | 3,820 | Washington, D.C. | Washington, D.C. |
| 9 | Spokane, WA | 3,712 | Seattle, WA | Los Angeles, CA |
| 10 | San Antonio, TX | 3,685 | Austin, TX | Los Angeles, CA |
House Hunters Are Saying Goodbye to Expensive Coastal Cities
As noted above, house hunters are most commonly looking to leave Los Angeles, New York and Seattle. Next up are three other job hubs—the Bay Area, Chicago and D.C.
The takeaway: people are trading pricey coastal cities as they chase affordability in other parts of the country. Compare New York to Philadelphia, the most common destination for house hunters leaving the Big Apple: The typical home in New York costs $832,000, while the typical home in Philadelphia costs $309,000.
| Top 10 Metros House Hunters Are Leaving, Q2 2026
Ranked by net outflow of Redfin.com home searchers Top 100 U.S. metros |
||||
| Rank | Metro area | Net outflow | Top destination | Top out-of-state destination |
| 1 | Los Angeles, CA | -28,652 | San Diego, CA | Las Vegas, NV |
| 2 | New York, NY | -27,143 | Philadelphia, PA | Philadelphia, PA |
| 3 | Seattle, WA | -24,728 | Portland, OR | Portland, OR |
| 4 | San Jose, CA | -22,353 | Sacramento, CA | Seattle, WA |
| 5 | Chicago, IL | -18,290 | Milwaukee, WI | Milwaukee, WI |
| 6 | Washington, DC | -17,787 | Salisbury, MD | Salisbury, MD |
| 7 | Boston, MA | -7,611 | Portland, ME | Portland, ME |
| 8 | Denver, CO | -5,816 | Fort Collins, CO | Los Angeles, CA |
| 9 | Minneapolis, MN | -1,893 | Chicago, IL | Chicago, IL |
| 10 | Detroit, MI | -1,538 | Grand Rapids, MI | Chicago, IL |
The Sunshine State Is No. 1 For Relocating House Hunters
Zooming out to the state level, Florida drew in more house hunters than any other state in the second quarter, by far. The Sunshine State attracted more Redfin.com home searchers than Arizona, South Carolina and Tennessee–the next-most popular destinations–combined.
Nevada, home to Las Vegas–the number-one most popular metro for house hunters– rounds out the five most popular states.
| State-Level Summary, Q2 2026: Top 10 States House Hunters Are Moving Into
Ranked by net inflow of Redfin.com home searchers |
||
| Rank | State | Net Inflow |
| 1 | Florida | 38,922 |
| 2 | South Carolina | 13,764 |
| 3 | Arizona | 11,929 |
| 4 | Tennessee | 9,872 |
| 5 | Nevada | 8,918 |
| 6 | Idaho | 8,846 |
| 7 | North Carolina | 7,414 |
| 8 | Texas | 6,306 |
| 9 | Maine | 4,912 |
| 10 | Wisconsin | 4,683 |
California’s net outflow is nearly twice as big as New York, the No. 2 state on the list. Next come three northern job centers: Illinois, Washington and Massachusetts.
| State-Level Summary, Q2 2026: Top 10 States House Hunters Are Leaving
Ranked by net outflow of Redfin.com home searchers |
||
| Rank | State | Net outflow |
| 1 | California | -56,548 |
| 2 | New York | -29,838 |
| 3 | Illinois | -22,253 |
| 4 | Washington | -17,091 |
| 5 | Massachusetts | -10,730 |
| 6 | Virginia | -7,205 |
| 7 | Washington, D.C. | -3,196 |
| 8 | Colorado | -2,893 |
| 9 | Minnesota | -2,394 |
| 10 | Maryland | -2,311 |
Almost 1 in 5 House Hunters Are Looking to Leave Their Hometown
Nationwide, nearly one in five (18.7%) house hunters looked to move from one part of the country to another in the second quarter. That’s up slightly from 18.1% a year earlier and the highest second-quarter share in records dating back to 2021.
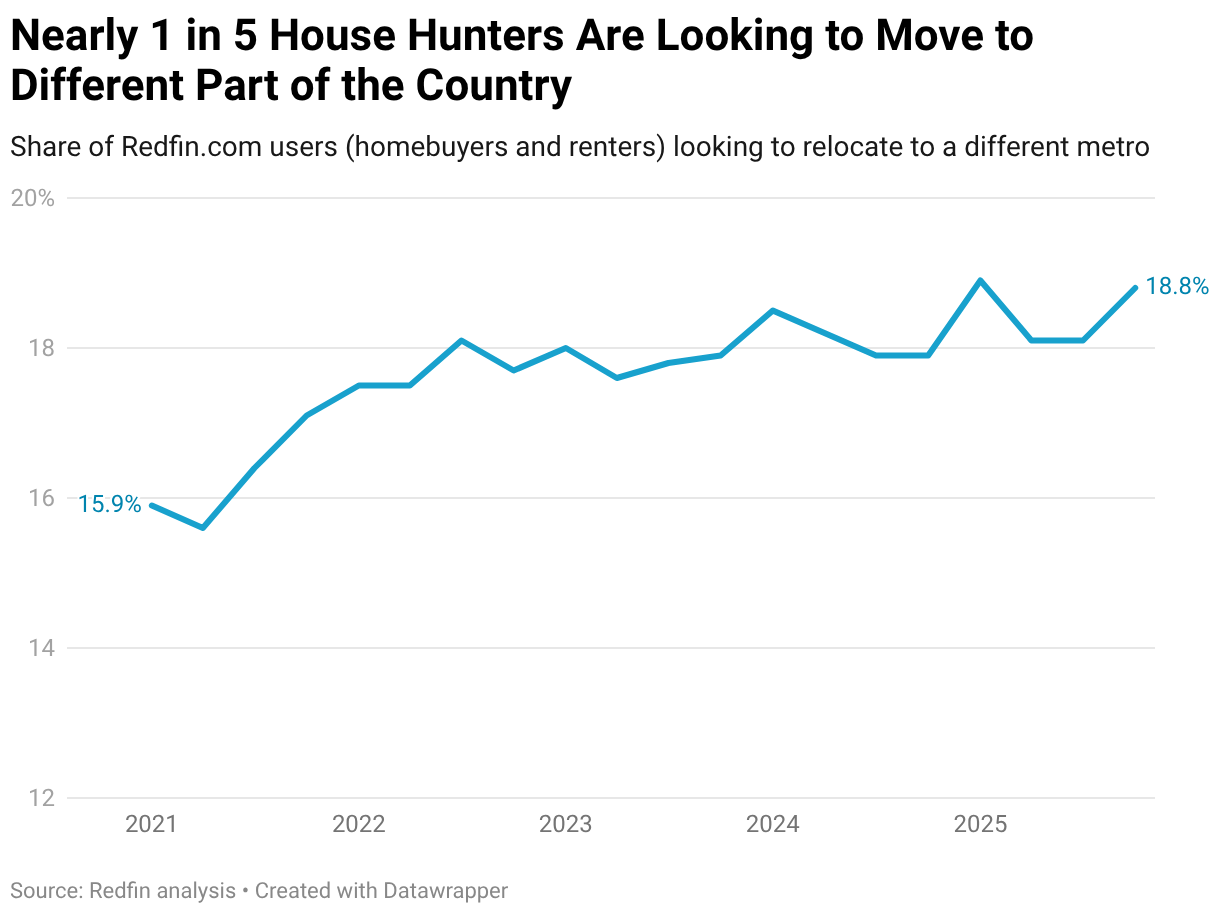
House hunters are increasingly willing to relocate as they chase affordability in cheaper metros, a shift made easier by remote and hybrid work sticking around well after the pandemic.
Note that a higher share of house hunters looking to relocate doesn’t mean a higher number are. Overall homebuying is sluggish, so with a smaller pool of buyers overall, the actual number of relocators is likely still below 2021-2022 levels.
For more migration data, including migration patterns for each major U.S. metro area, please visit Redfin’s data center.
Methodology
This is from a Redfin analysis of Redfin.com users–both homebuyers and renters–searching outside their home metro area.
Our migration analysis is based on Redfin.com users searching for homes across more than 100 metro areas in the U.S. For this analysis, a metro area is defined at the Combined Statistical Area (CSA) level, which includes multiple Metropolitan Statistical Areas (MSAs). The analysis is from January 2021 to June 2026.
We identify potential migrants as users who search for homes outside their current metro area. A Redfin.com user must view at least 20 for-sale or for-rent homes in a destination metro during a one-month period to be counted as looking to relocate there.
If a user views homes in multiple metros, we proportionally allocate their migration based on search activity. For example, if a Seattle-based user views 40 homes—20 in Phoenix and 20 in San Diego—they count as half a migrant to Phoenix and half to San Diego. This approach allows us to measure both the volume and direction of migration interest across the country.
Note that this data can include people searching for vacation homes and/or investment properties outside their home metro area.