- 21% of U.S. home sellers dropped their asking price during the four weeks ending September 20, up slightly from 19.8% a year earlier and the highest share for this time of year in our records.
- But even as bidding wars fade and homes linger on the market, the price-drop rate has risen only slightly. That’s a sign that some homeowners are waiting to list, some are delisting if they don’t get their asking price, and some are pricing realistically from the start.
- Price drops are most common in Denver, which is a buyer’s market but less so than other places. Sellers there are still adjusting their expectations.
- Price drops are least common in San Francisco, where AI wealth is driving a hot market.
Price drops are becoming slightly more common, the latest symbol of today’s buyer-friendly housing market. But they’re only becoming slightly more common in the face of the strongest buyer’s market on record–a sign that many would-be sellers are waiting to put their home on the market and others are delisting if they don’t get their asking price. Additionally, some sellers have adjusted their expectations and are pricing realistically from the start.
Just over one in five (21.1%) U.S. home sellers with active listings cut their asking price during the four weeks ending September 20. That’s the highest share for this time of year in our records, which date back to the start of 2022–but it’s up only slightly from a year earlier, when 19.8% of sellers dropped their price.
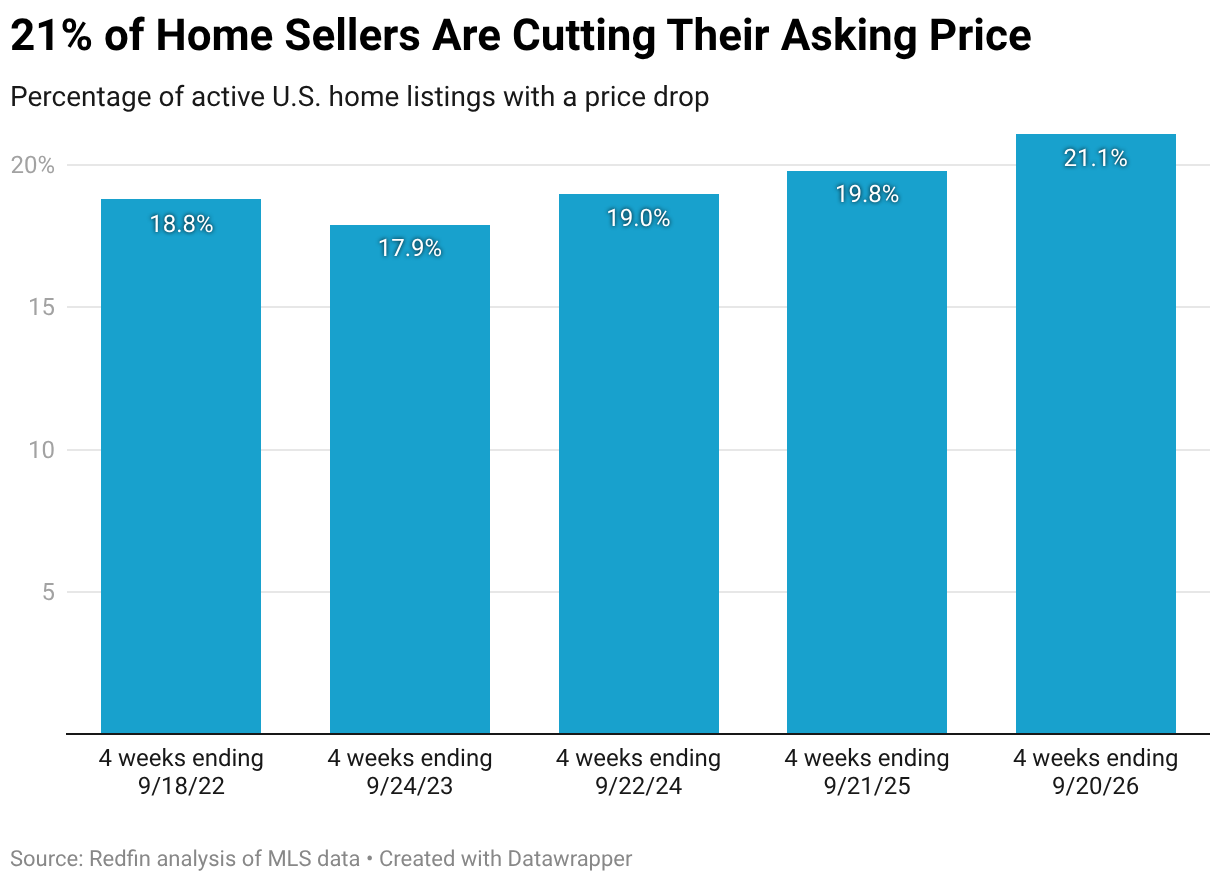
This is based on a Redfin analysis of MLS data. The data is seasonal, which is why we compare the four weeks ending September 20 to the same period in years past.
Typically, a rising share of sellers dropping their prices means they priced too high and a soft market forced them to correct themselves. This time is different: Even as bidding wars have faded and homebuying demand stalls, leaving homes to linger on the market, the price-drop rate has risen only marginally. That signals that some homeowners have decided to keep their home off the market altogether, and some sellers are delisting their homes rather than settle for a lower price. Other sellers are adjusting their expectations before listing rather than after: The national housing market has been slow for several years, and a fair amount of sellers are now pricing based on today’s market conditions rather than anchoring their hopes to 2021 conditions.
“Those who sell their homes quickly are the ones who are getting savvier about pricing right from day one,” said Redfin Senior Economist Asad Khan. “Sellers who price too high may be working off outdated comps, or feel overly optimistic about the chance of sparking a bidding war, despite data that says it’s unlikely. Many are eventually cutting their price as they come to terms with reality: Mortgage rates are sitting above 7%, the economy is uncertain, and many homes are lingering on the market.”
For sellers, a price cut isn’t a failure. It’s a sign that the initial price was too ambitious–and homeowners thinking about listing now should remember that it’s typically better to get the number right the first time than to chase buyers with a lower price when the listing grows stale. One way to arrive at the right asking price is through Redfin Early Access: Sellers can use the service to test the market before officially listing their home.
For buyers, the price-drop rate flattening doesn’t mean they have less power. It means that buyers’ power is showing up earlier, in asking prices themselves rather than markdowns after a listing goes live. Homebuyers should still consider offering below asking price on homes that have been sitting on the market for more than a month. House hunters should also consider asking for concessions: Nearly half of U.S. homebuyers are getting concessions from sellers, including money toward repairs, closing costs and/or mortgage-rate buydowns.
Denver Leads the Nation in Price Cuts, With Texas Metros Close Behind
Price drops are more common in some parts of the country than others.
In Denver, roughly three in 10 (30.9%) home sellers cut their asking price during the four weeks ending September 20, a bigger share than anywhere else in the country, followed closely by Indianapolis (29.9%). Next come three Texas metros: San Antonio (26.8%), Dallas (26.6%) and Austin (26.1%).
San Antonio, Dallas and Austin are three of the strongest buyer’s markets in the nation, with more than twice as many sellers as buyers. In those places, it’s often necessary for sellers to cut prices to compete.
Denver and Indianapolis are also buyer’s markets, but less-strong buyer’s markets. Sellers in those metros are still adjusting their expectations.
“Today’s buyers have enough options that they can afford to be picky, so it’s critical for sellers to price correctly and attract buyers from the get-go,” said Chandra Gordon, a Redfin Premier agent in Seattle, where 24.3% of sellers are cutting prices, higher than the national average. “But I meet a lot of sellers whose instinct is to do the opposite. They’ll say, ‘let’s price higher so we have room to negotiate down.’ I understand the reasoning, but overpricing a home is a fast way to deter buyers. Pricing in line with the market from day one is the best way for sellers to meet buyers where they are, rather than watch their listing go stale.”
San Francisco Sellers Rarely Cut Prices, Thanks to AI-Driven Hot Market
Just under 10% of San Francisco home sellers are dropping their asking price, the smallest share in the country. San Francisco is one of just five seller’s markets in the country; its hot market is fueled by AI wealth, with buyers competing for homes rather than sellers competing for buyers. It’s also worth noting that San Francisco typically has a fairly low share of sellers dropping their price due to local market dynamics, though it’s lower than usual for this time of year.
Newark, NJ is next, with 12.2% of home sellers dropping their asking prices. Newark is one of the country’s other five seller’s markets. Chicago (13.3%), New York (13.6%) and Miami (13.7%) round out the five metros with the smallest share of sellers cutting their asking prices.
| Metro-Level Summary: Price Cuts
4 weeks ending September 20, 2026 50 most populous U.S. metros |
||
| U.S. metro area | Share of active listings with a price drop | Share of active listings with a price drop, year-over-year change (percentage points) |
| Anaheim, CA | 19.5% | 3.2 pts. |
| Atlanta, GA | 22.7% | 1.5 pts. |
| Austin, TX | 26.1% | 0 pts. |
| Baltimore, MD | 22% | 1.6 pts. |
| Boston, MA | 23.8% | 7.6 pts. |
| Charlotte, NC | 23.7% | 2 pts. |
| Chicago, IL | 13.3% | -0.3 pts. |
| Cincinnati, OH | 20.4% | 1.8 pts. |
| Cleveland, OH | 22.5% | 2.8 pts. |
| Columbus, OH | 22.6% | 2.2 pts. |
| Dallas, TX | 26.6% | 1.1 pts. |
| Denver, CO | 30.9% | 3.1 pts. |
| Detroit, MI | 20.4% | 1.1 pts. |
| Fort Lauderdale, FL | 16.4% | 0 pts. |
| Fort Worth, TX | 24.2% | 0.2 pts. |
| Houston, TX | 23.9% | -0.6 pts. |
| Indianapolis, IN | 29.9% | 2.0 pts. |
| Jacksonville, FL | 23.8% | 0.3 pts. |
| Kansas City, MO | 23.6% | 1.0 pts. |
| Las Vegas, NV | 22.4% | 2.3 pts. |
| Los Angeles, CA | 16.5% | 2.1 pts. |
| Miami, FL | 13.7% | 0.2 pts. |
| Milwaukee, WI | 15.1% | 1.1 pts. |
| Minneapolis, MN | 25.3% | 3.7 pts. |
| Montgomery County, PA | 17.1% | 0.4 pts. |
| Nashville, TN | 20% | 0.8 pts. |
| Nassau County, NY | 14.5% | 1.0 pts. |
| New Brunswick, NJ | 15.2% | 1.4 pts. |
| New York, NY | 13.6% | 0.4 pts. |
| Newark, NJ | 12.2% | 1.5 pts. |
| Oakland, CA | 17.9% | 2.3 pts. |
| Orlando, FL | 20.9% | -1.2 pts. |
| Philadelphia, PA | 21.9% | 0.8 pts. |
| Phoenix, AZ | 23.3% | 3.4 pts. |
| Pittsburgh, PA | 21.7% | 1.6 pts. |
| Portland, OR | 25.9% | 0.9 pts. |
| Providence, RI | 17.4% | 3.3 pts. |
| Riverside, CA | 17.8% | 1.7 pts. |
| Sacramento, CA | 22.3% | 0.6 pts. |
| San Antonio, TX | 26.8% | 0.7 pts. |
| San Diego, CA | 21.7% | 2.9 pts. |
| San Francisco, CA | 9.6% | -1.3 pts. |
| San Jose, CA | 16.8% | 2.3 pts. |
| Seattle, WA | 24.3% | 3.5 pts. |
| St. Louis, MO | 21.7% | 1.3 pts. |
| Tampa, FL | 23.4% | -2 pts. |
| Virginia Beach, VA | 18.1% | 1 pts. |
| Warren, MI | 23.4% | 3.2 pts. |
| Washington, DC | 19.8% | 2.1 pts. |
| West Palm Beach, FL | 15.8% | -0.7 pts. |