
Twenty-two percent of Redfin.com users searched for homes outside their home metro in the third quarter of 2017, up slightly from 21 percent in the second quarter and 20 percent in the first quarter. The analysis is based on a sample of more than one million Redfin.com users searching for homes across 75 metro areas from July through September. Redfin began systematically tracking homebuyer migration at the beginning of this year, so we do not yet have enough historical data to understand whether the current trends follow a seasonal pattern.
While 78 percent of Redfin.com home searchers looked to stay in their current metro, several key trends emerged among those looking to move to another metro:
- Nashville made the list of top migration destinations for the first time, joining several more affordable, mid-tier metros like Sacramento, Phoenix and Atlanta that continue to draw prospective homebuyers from expensive coastal cities, such as San Francisco, New York and Los Angeles;
- The metros with the highest net inflow of home buyers tended to be places that are building more homes per capita than the national average;
- The South and Sunbelt continued to see more incoming than outgoing searches; and
- The Rust Belt cities of Detroit, Dayton and Milwaukee experienced a net outflow of user searches.
Moving Out – Metros with the Highest Net Outflow of Users
San Francisco, New York and Los Angeles ranked highest for net outflow for the third consecutive quarter. Among people leaving the Bay Area, 22.7 percent searched in Sacramento and 9.1 percent searched in Seattle. New Yorkers looked to Boston (18.7%) and Atlanta (8.8%), while Los Angelenos searched for homes in San Diego (26.5%) and Las Vegas (8.1%).
| Table: Top Metros by Net Outflow of Users and Their Top Destinations | |||||
| Rank | Metro* | Net Outflow† | Portion of Local Users Searching Elsewhere | Top Destination | Top Out-of-State Destination |
|---|---|---|---|---|---|
| 1 | San Francisco, CA | -15,977 | 18.2% | Sacramento, CA | Seattle, WA |
| 2 | New York, NY | -14,827 | 34.5% | Boston, MA | Boston, MA |
| 3 | Los Angeles, CA | -13,785 | 15.3% | San Diego, CA | Las Vegas, NV |
| 4 | Washington, DC | -5,266 | 10.8% | Philadelphia, PA | Philadelphia, PA |
| 5 | Chicago, IL | -2,289 | 8.6% | Los Angeles, CA | Los Angeles, CA |
| 6 | Houston, TX | -287 | 24.7% | Austin, TX | Los Angeles, CA |
| 7 | Detroit, MI | -251 | 24.8% | Chicago, IL | Chicago, IL |
| 8 | Dayton, OH | -65 | 37.6% | Cincinnati, OH | Washington, DC |
| 9 | Milwaukee, WI | -12 | 33.4% | Chicago, IL | Chicago, IL |
| *Combined statistical areas with at least 500 users in Q3 2017 †Among the one million users sampled for this analysis only |
|||||
Moving In – Metros with the Highest Net Inflow of Users
San Diego and Sacramento ranked first and second by net inflow in the third quarter. The lion’s share of long-distance searches for San Diego homes were from Los Angeles at 63.6 percent. Three in four searches by out-of-towners for Sacramento homes originated in the Bay Area.
Beyond California, metros in the Sun Belt (Phoenix and Las Vegas) and the South (Atlanta, Dallas, Nashville, Tampa and Miami) were top destinations for home searchers. Nashville appeared among the top 10 migration destinations for the first time last quarter. Nearly a third of all users searching for homes in Nashville were searching from another metro the area, among which just over a quarter (25.6%) searched from New York.
“We help people from across the country search for homes in Nashville,” said Redfin Nashville agent Phillip Bernier, who has recently worked with buyers relocating from Chicago, San Diego and San Francisco.
“The cost of living is low, there is plenty to do downtown, but at the same time there is still a lot of natural beauty. You can be on a horse, on a lake or on a trail within a five-minute drive from downtown. The city is growing quickly. We have a running joke that the new state bird is the crane. If you look at the Nashville skyline, you can see 10 to 12 cranes at any given time.”
| Table: Top 10 Metros by Net Inflow of Users and Their Top Origins | |||||
| Rank | Metro* | Net Inflow† | Portion of Searches from Users Outside the Metro | Top Origin | Top Out-of-State Origin |
|---|---|---|---|---|---|
| 1 | San Diego, CA | 4,887 | 29.3% | Los Angeles, CA | Seattle, WA |
| 2 | Sacramento, CA | 4,578 | 37.0% | San Francisco, CA | Seattle, WA |
| 3 | Las Vegas, NV | 3,453 | 43.2% | Los Angeles, CA | Los Angeles, CA |
| 4 | Phoenix, AZ | 2,967 | 29.1% | Los Angeles, CA | Los Angeles, CA |
| 5 | Atlanta, GA | 2,809 | 25.3% | New York, NY | New York, NY |
| 6 | Boston, MA | 1,978 | 13.2% | New York, NY | New York, NY |
| 7 | Dallas, TX | 1,734 | 21.2% | Los Angeles, CA | Los Angeles, CA |
| 8 | Nashville, TN | 1,667 | 32.1% | New York, NY | New York, NY |
| 9 | Tampa, FL | 1,501 | 43.1% | Orlando, FL | Washington, DC |
| 10 | Miami, FL | 1,363 | 21.5% | New York, NY | New York, NY |
| *Combined statistical areas with at least 500 users in Q3 2017 †Among the one million users sampled for this analysis only |
|||||
If You Build It They Will Come
Many of the cities experiencing a high net inflow of homebuyers are also places with higher than average rates of residential construction activity per capita.
Conversely, metros experiencing net outflow tend to have lower than average rates of new construction. According to a Redfin analysis of new construction data, nationally, there were 10.7 new residential housing units permitted to be built per 10,000 residents in September 2017.
Seven of the 10 metros with the highest net inflow have more permitted units than the national average. Nashville is among the metros with the highest rates of new permit activity at 27 permitted new residential units per 10,000 residents. The metro areas poised to build the most new homes in the coming months are Houston (10,000), Dallas (9,400), Phoenix (7,800), and Atlanta (7,700).
With the exception of Houston and Washington, D.C., the areas with highest net outflow have lower rates of new residential building activity than the national average. In Los Angeles just 5.6 units were permitted to be built per 10,000 residents.
| Net Inflow | Metro Area | Permitted Units per 10K Residents | Total Permit Units |
| San Diego | 10.9 | 3,645 | |
| Sacramento | 10.5 | 2,446 | |
| Las Vegas | 16.5 | 3,631 | |
| Phoenix | 16.3 | 7,765 | |
| Atlanta | 13.1 | 7,684 | |
| Boston | 6.8 | 3,935 | |
| Dallas | 12.9 | 9,422 | |
| Nashville | 27.5 | 4,920 | |
| Tampa | 13.7 | 3,980 | |
| Miami | 9.4 | 2,569 | |
| Net Outflow | San Francisco | 8.5 | 1,624 |
| New York | 7.3 | 6,784 | |
| Los Angeles | 5.7 | 5,775 | |
| Washington, DC | 11 | 6,754 | |
| Chicago | 5.6 | 4,809 | |
| Houston | 14.6 | 10,094 | |
| Detroit | 4 | 1,704 | |
| Dayton | 5.1 | 427 | |
| Milwaukee | 4.5 | 714 |
Staying Put
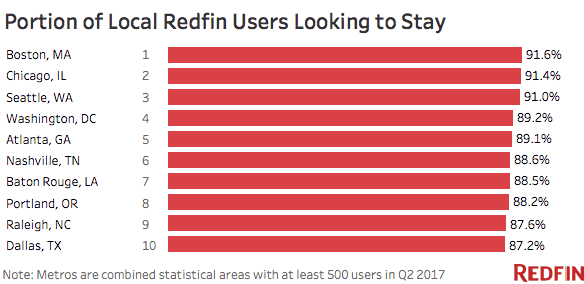
Across the 75 metro areas in the analysis, 78 percent of Redfin.com users looked for homes primarily within their home metro. Boston, Chicago and Seattle topped the ranking of most loyal residents for the third quarter in a row, with more than 9 in 10 searching for a home in their current location.
As factors influencing people’s decisions regarding where to live evolve, Redfin search data reveal emerging migration patterns with home seekers shifting their search to lower-cost, second-tier markets and away from expensive coastal cities. We will continue to track migration using Redfin’s proprietary user dataset each quarter.
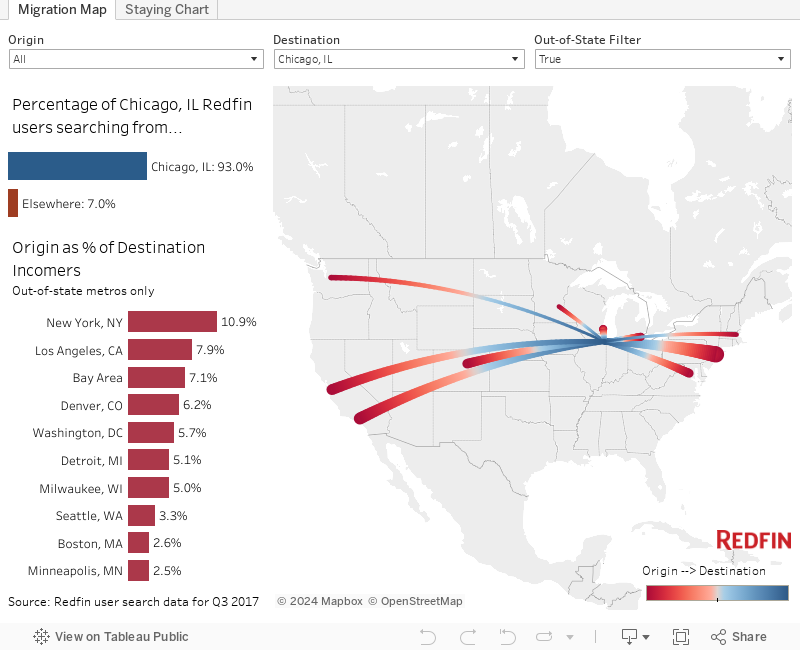
Find your Metro: On the below interactive map, select one metro area origin (or destination) to see the top 10 destinations (or origins) for that metro.
If you’d like more information about this analysis or its underlying data, please email press@redfin.com.
Methodology
Redfin analyzed a sample of more than one million Redfin.com users searching for homes across 75 metro areas from July through September. Users must have viewed at least 10 listings during the quarter. We also excluded locations that in aggregate represented less than 20 percent of a user’s searches. We determined the home metro by mapping the user’s IP address of the most common location they searched from. If a user was searching in more than one metro, we accounted for the share of searches in each metro. Combined Statistical Areas (as defined here) must have had at least 500 users either searching from or in that metro during the first quarter.
It’s worth noting that net inflow and outflow data does not account for Redfin’s market share or the population of metro areas. In metros where Redfin has a larger number of website visitors, we may have a higher volume of inbound and outbound searches than in metros that are smaller or where Redfin has a smaller user base. The U.S. Census Bureau measures net migration flows, which is a common practice when analyzing migratory patterns.


