
High mortgage rates are keeping homebuyers on the sidelines, leading to declining home sales and a build-up of supply.
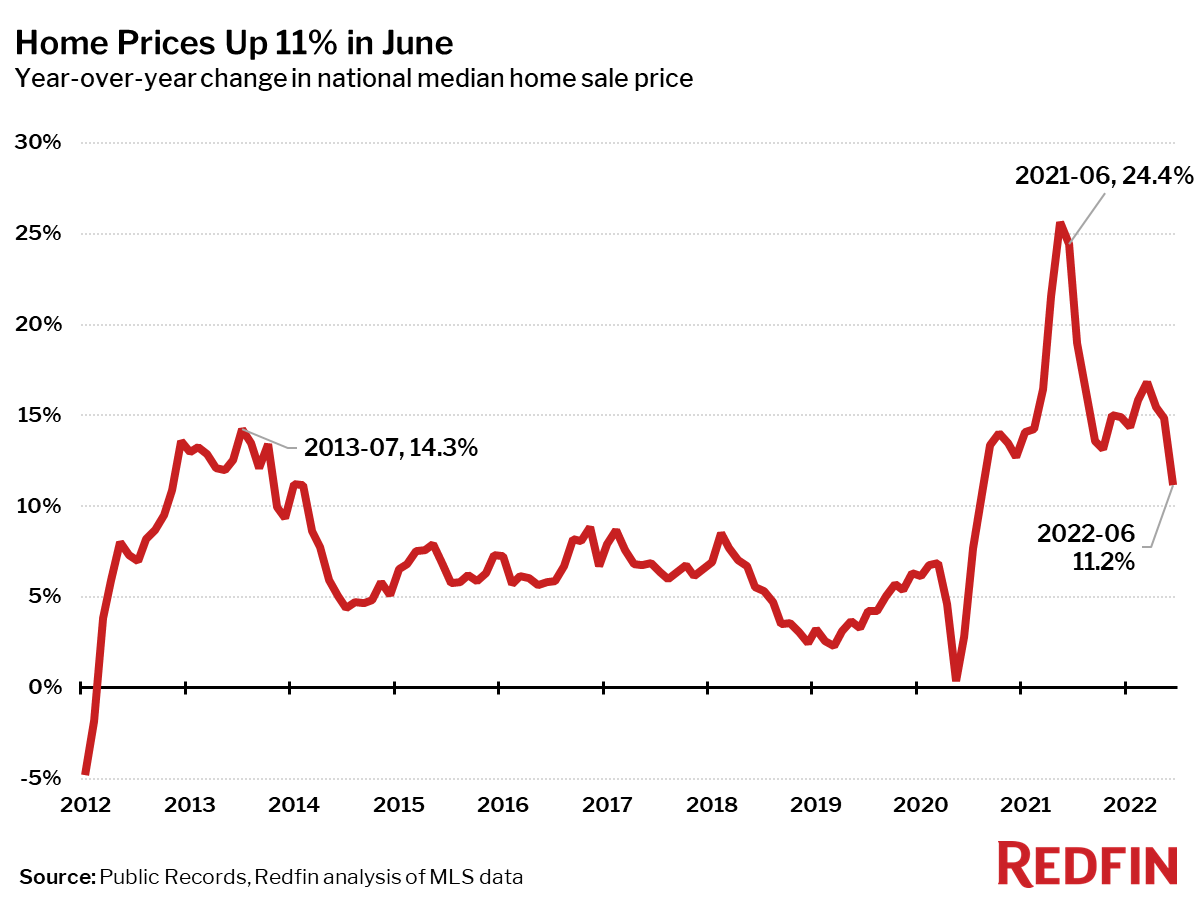
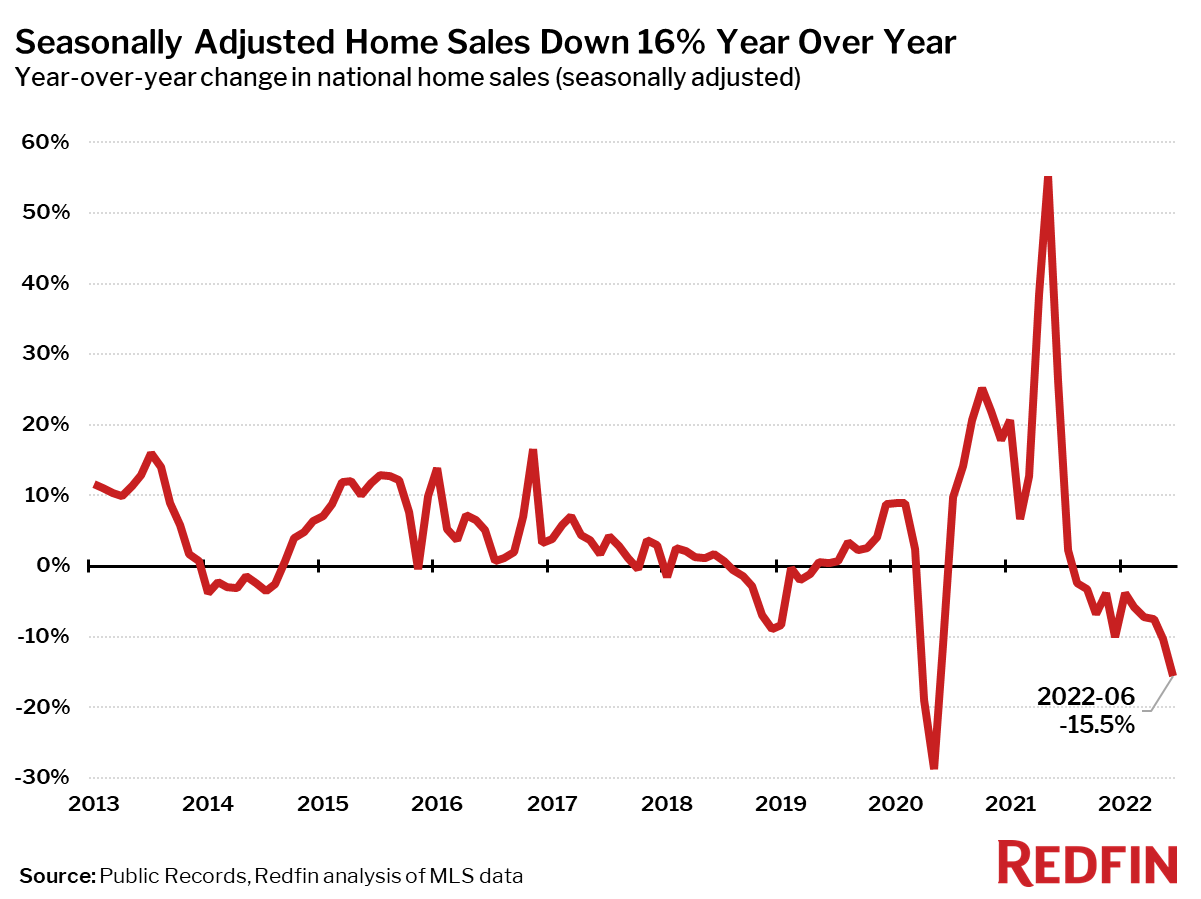
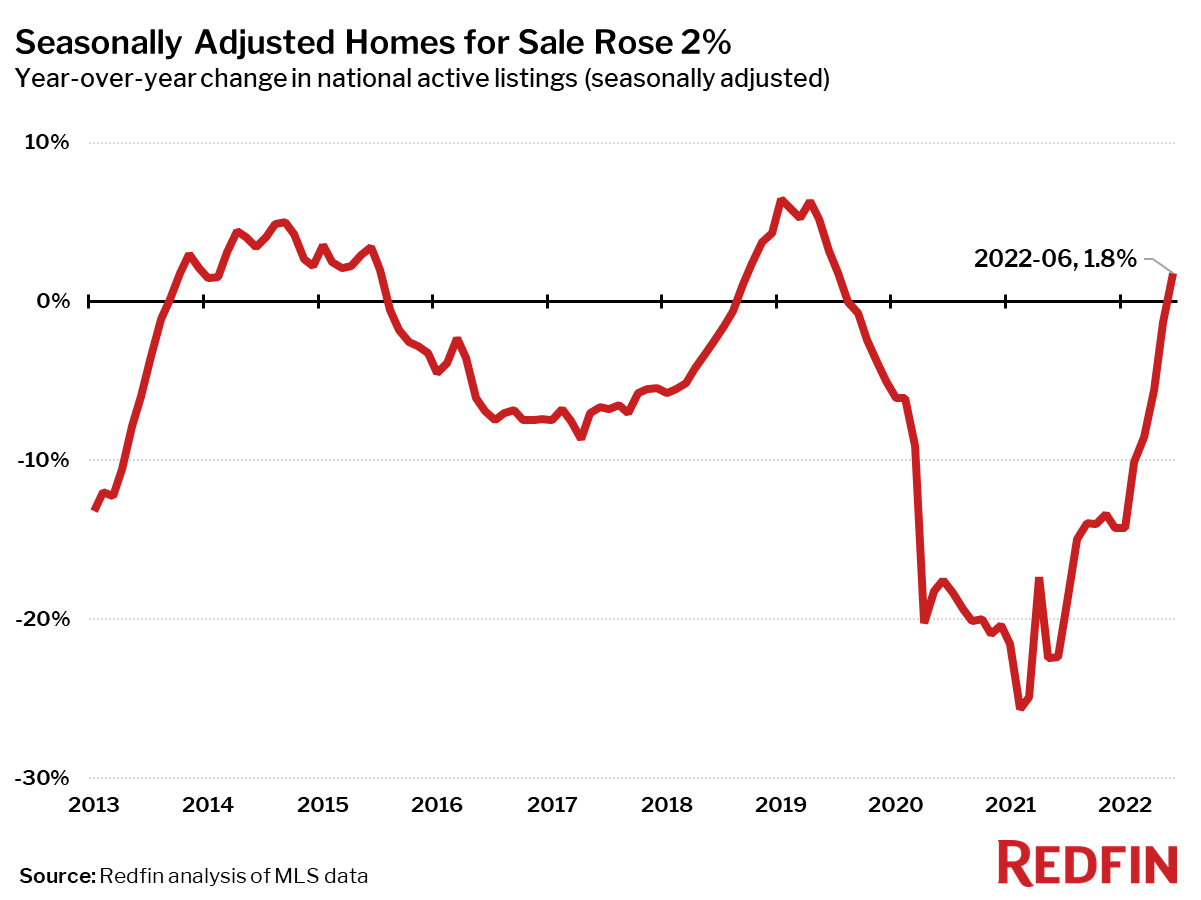
The number of homes for sale nationwide in June rose 2%. That’s the first annual increase since July 2019, before the pandemic-fueled homebuying frenzy sapped the market of available homes and sent buyers into bidding wars for nearly every listing. Now, supply has built up as the combination of 5.5%-plus mortgage rates, high home prices and a faltering economy push more buyers to the sidelines, thereby creating a more balanced market. Home sales fell nearly 16% from a year ago, the largest decline since May 2020. The shift has also started impacting sale prices: They’re still growing by double digits, but the 11% year-over-year increase is the smallest in nearly two years.
“The country’s economic woes have already cooled the housing market, and they’re likely to continue dampening demand,” said Redfin Chief Economist Daryl Fairweather. “The Fed has signaled it may increase interest rates further to combat stubbornly high inflation, which could harm consumer confidence, and lower stock prices mean fewer prospective homebuyers can afford a down payment. I advise sellers to commit: If you decide to sell, do it quickly before demand potentially falls further. And price carefully—this is not the time to test the waters. You’ll do more harm than good if you overprice and have to do a price reduction or take the home off the market.”
The market is a mixed bag for buyers. They’re seeing higher monthly housing payments than earlier this year due to comparatively high mortgage rates but facing less competition for homes, which often allows them to make less risky offers that include protections like inspection and appraisal contingencies.
| Market Summary | June 2022 | Month-Over-Month | Year-Over-Year |
|---|---|---|---|
| Median sale price | $428,400 | -0.4% | 11.2% |
| Homes sold, seasonally-adjusted | 524,200 | -4.3% | -15.5% |
| Pending sales, seasonally-adjusted | 500,000 | -1.5% | -12.6% |
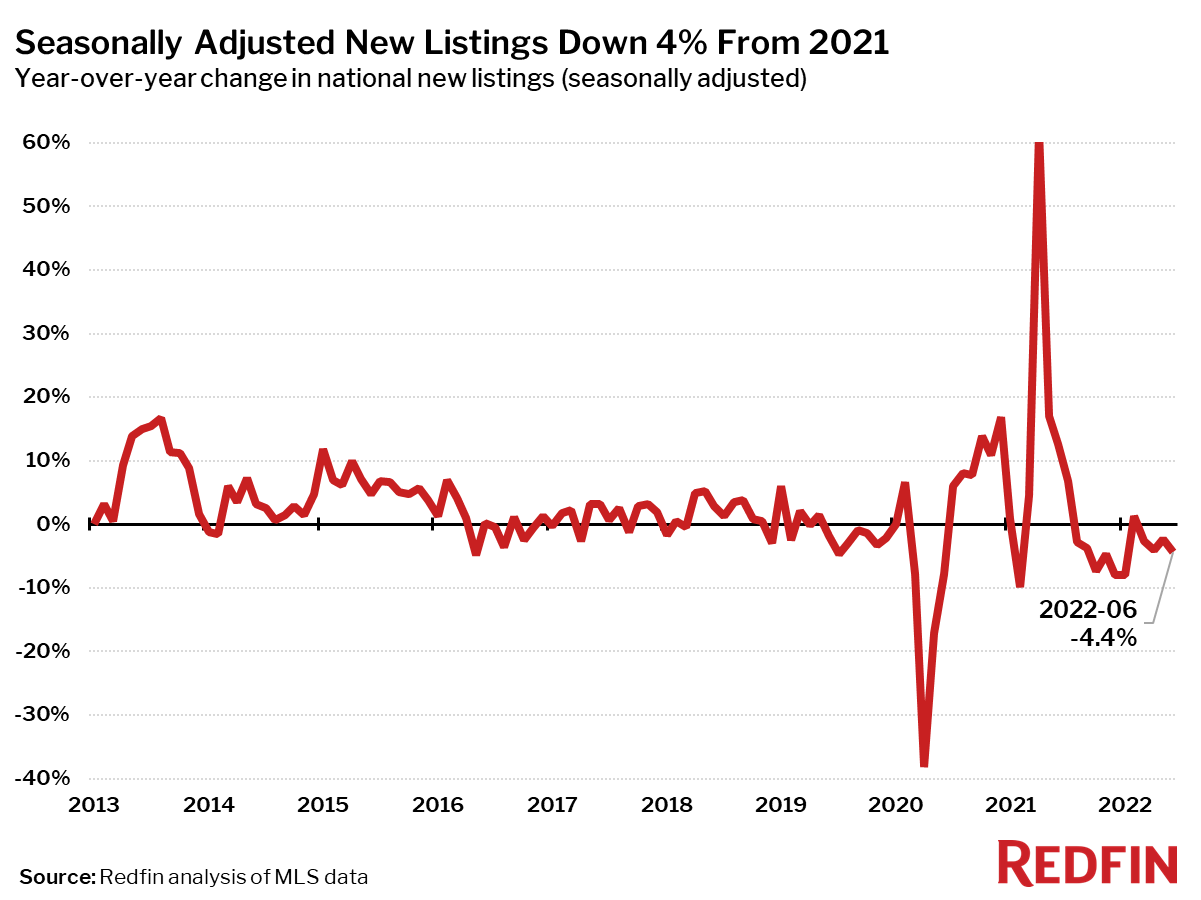
| New listings, seasonally-adjusted | 636,500 | 0.1% | -4.4% |
| All Homes for sale, seasonally-adjusted | 1,450,900 | 2.4% | 1.8% |
| Median days on market | 18 | 1 | 3 |
| Months of supply | 1.7 | 0.2 | 0.5 |
| Sold above list | 55.5% | -3.7 pp† | -0.9 pp† |
| Median Off-Market Redfin Estimate | $421,300 | 0.4% | 21.1% |
| Average Sale-to-list | 102.3% | -0.8 pp† | -0.2 pp† |
| Average 30-year fixed mortgage rate | 5.52% | +0.29 pp† | +2.54 pp† |
Other June Highlights
Competition
- Denver and Indianapolis were the fastest markets, with half of all homes pending sale in just 5 days. Grand Rapids, MI, Omaha, NE and Oklahoma City were the next-fastest markets, with 6 median days on market.
- The most competitive market in June was Rochester, NY, where 80.5% of homes sold above list price, followed by 76.8% in Worcester, MA, 76.2% in Oakland, CA, 75.4% in Buffalo, NY, and 75.0% in Hartford, CT.
Prices
- North Port, FL had the nation’s highest price growth, with home prices rising 29.7% since a year earlier to $480,000. Cape Coral, FL had the second-highest growth at 27.7%, followed by Tampa, FL (26.1%), Fort Worth, TX (24.2%), and Knoxville, TN (24.1%).
- Only San Francisco (-0.5%) saw price declines in June.
Sales
- No metro areas saw home sales increase from a year earlier in June. Greenville, SC had the smallest decline, with home sales dropping 2.3% year over year, followed by Worcester, MA, down 4.1%. El Paso, TX rounded out the top three with sales down 7.2% from a year ago.
- West Palm Beach, FL saw the largest decline in sales from a year earlier, falling 34.1%. Next came Anaheim, CA and Miami, where home sales declined by 33.6% and 33.5%, respectively.
Inventory
- North Port, FL had the biggest increase in the number of homes for sale, up 34% year over year, followed by Colorado Springs, CO (31.5%) and Austin, TX (26.9%).
- Allentown, PA had the largest decrease in the number of homes for sale, falling 41.1% since last June. Hartford, CT (-29.2%), Greensboro, NC (-28.6%), and Bridgeport, CT (-27.9%) came next.
Below are market-by-market breakdowns for prices, inventory, new listings and sales for markets with populations of 750,000 or more. For downloadable data on all of the markets Redfin tracks, visit the Redfin Data Center. Refer to our metrics definition page for explanations of all the metrics used in this report.
Median Sale Price
| Redfin Metro | Median Sale Price | Month-Over-Month | Year-Over-Year |
|---|---|---|---|
| Albany, NY | $305,000 | 8.9% | 10.9% |
| Allentown, PA | $320,000 | 6.7% | 15.7% |
| Anaheim, CA | $1,020,000 | -3.9% | 12.1% |
| Atlanta, GA | $400,000 | 0.8% | 18.3% |
| Austin, TX | $536,000 | -3.2% | 11.7% |
| Bakersfield, CA | $360,000 | 0.0% | 18.0% |
| Baltimore, MD | $375,000 | 1.3% | 7.0% |
| Baton Rouge, LA | $260,000 | 2.8% | 6.1% |
| Birmingham, AL | $304,900 | 3.4% | 15.1% |
| Boise City, ID | $525,000 | -4.5% | 10.5% |
| Boston, MA | $705,000 | 2.2% | 8.5% |
| Bridgeport, CT | $625,000 | 8.7% | 8.7% |
| Buffalo, NY | $240,000 | 4.3% | 16.6% |
| Camden, NJ | $309,000 | 3.0% | 16.6% |
| Cape Coral, FL | $415,000 | -0.5% | 27.7% |
| Charleston, SC | $430,000 | 0.0% | 19.8% |
| Charlotte, NC | $410,000 | 2.4% | 20.6% |
| Chicago, IL | $340,000 | 3.0% | 6.2% |
| Cincinnati, OH | $275,000 | 3.8% | 7.8% |
| Cleveland, OH | $225,000 | 7.1% | 11.9% |
| Columbus, OH | $328,000 | -0.4% | 15.1% |
| Dallas, TX | $457,000 | -1.7% | 20.3% |
| Dayton, OH | $215,000 | 4.9% | 16.2% |
| Denver, CO | $610,000 | -0.3% | 12.4% |
| Detroit, MI | $209,000 | 10.1% | 14.2% |
| El Paso, TX | $238,000 | 0.1% | 19.0% |
| Fort Lauderdale, FL | $410,500 | 2.6% | 20.7% |
| Fort Worth, TX | $388,100 | 0.8% | 24.2% |
| Frederick, MD | $550,000 | -1.8% | 8.9% |
| Fresno, CA | $415,000 | 1.2% | 13.7% |
| Grand Rapids, MI | $310,000 | -0.4% | 10.7% |
| Greensboro, NC | $275,000 | 3.8% | 19.3% |
| Greenville, SC | $310,000 | -4.4% | 13.6% |
| Hartford, CT | $315,000 | 5.0% | 11.9% |
| Honolulu, HI | $736,500 | 5.2% | 13.0% |
| Houston, TX | $352,000 | 0.6% | 13.2% |
| Indianapolis, IN | $296,000 | 3.9% | 18.4% |
| Jacksonville, FL | $375,000 | 2.7% | 22.6% |
| Kansas City, MO | $325,000 | 1.6% | 15.2% |
| Knoxville, TN | $350,000 | 2.9% | 24.1% |
| Lake County, IL | $350,000 | 9.4% | 7.7% |
| Las Vegas, NV | $450,000 | 0.0% | 23.3% |
| Los Angeles, CA | $890,000 | -1.1% | 7.3% |
| Louisville, KY | $263,300 | 3.3% | 11.6% |
| McAllen, TX | $224,400 | 1.9% | 18.9% |
| Memphis, TN | $301,200 | 5.3% | 13.7% |
| Miami, FL | $490,000 | 0.0% | 18.1% |
| Milwaukee, WI | $307,800 | 7.9% | 10.3% |
| Minneapolis, MN | $380,000 | 1.3% | 8.6% |
| Montgomery County, PA | $450,000 | 5.9% | 9.7% |
| Nashville, TN | $459,900 | -1.9% | 17.9% |
| Nassau County, NY | $629,200 | 0.8% | 9.4% |
| New Brunswick, NJ | $480,000 | 3.9% | 11.9% |
| New Haven, CT | $319,800 | 3.1% | 6.6% |
| New Orleans, LA | $309,400 | 1.5% | 9.3% |
| New York, NY | $705,000 | 1.9% | 4.7% |
| Newark, NJ | $550,000 | 6.8% | 11.9% |
| North Port, FL | $480,000 | 1.1% | 29.7% |
| Oakland, CA | $1,025,000 | -4.2% | 6.8% |
| Oklahoma City, OK | $260,000 | 0.0% | 13.0% |
| Omaha, NE | $300,000 | 3.4% | 13.2% |
| Orlando, FL | $400,000 | 0.8% | 21.2% |
| Oxnard, CA | $840,000 | 0.0% | 5.4% |
| Philadelphia, PA | $300,000 | 4.2% | 7.1% |
| Phoenix, AZ | $485,000 | -0.2% | 19.8% |
| Pittsburgh, PA | $239,900 | 4.3% | 3.2% |
| Portland, OR | $568,000 | -0.9% | 10.5% |
| Providence, RI | $425,000 | 1.2% | 13.3% |
| Raleigh, NC | $450,000 | 1.9% | 20.0% |
| Richmond, VA | $364,000 | -0.3% | 12.0% |
| Riverside, CA | $570,000 | -0.9% | 13.1% |
| Rochester, NY | $225,000 | 6.4% | 12.5% |
| Sacramento, CA | $600,000 | -1.6% | 6.2% |
| Salt Lake City, UT | $540,500 | -3.5% | 13.8% |
| San Antonio, TX | $345,200 | -1.1% | 19.5% |
| San Diego, CA | $860,000 | -1.7% | 11.7% |
| San Francisco, CA | $1,581,000 | -2.4% | -0.5% |
| San Jose, CA | $1,500,000 | -3.8% | 7.1% |
| Seattle, WA | $816,100 | -4.0% | 10.3% |
| St. Louis, MO | $265,000 | 6.7% | 12.5% |
| Stockton, CA | $555,000 | -4.0% | 7.8% |
| Tacoma, WA | $565,000 | -1.7% | 11.9% |
| Tampa, FL | $391,000 | 2.2% | 26.1% |
| Tucson, AZ | $365,000 | 1.5% | 16.6% |
| Tulsa, OK | $262,200 | 4.9% | 14.5% |
| Virginia Beach, VA | $325,000 | 0.0% | 9.8% |
| Warren, MI | $305,000 | 4.5% | 9.3% |
| Washington, DC | $550,000 | -0.2% | 5.8% |
| West Palm Beach, FL | $465,000 | 2.2% | 24.0% |
| Worcester, MA | $420,000 | 3.7% | 13.5% |
| National | $428,400 | -0.4% | 11.2% |
Homes Sold
| Redfin Metro | Homes Sold | Month-Over-Month | Year-Over-Year |
|---|---|---|---|
| Albany, NY | 866 | 9.8% | -14.2% |
| Allentown, PA | 945 | 16.0% | -15.8% |
| Anaheim, CA | 2,388 | -6.8% | -33.6% |
| Atlanta, GA | 9,704 | -2.7% | -18.3% |
| Austin, TX | 3,305 | -6.5% | -23.0% |
| Bakersfield, CA | 851 | 2.3% | -12.6% |
| Baltimore, MD | 4,195 | -2.6% | -23.4% |
| Baton Rouge, LA | 1,076 | -10.6% | -19.6% |
| Birmingham, AL | 1,649 | -3.1% | -17.5% |
| Boise City, ID | 1,212 | -9.4% | -28.4% |
| Boston, MA | 5,607 | 25.1% | -12.6% |
| Bridgeport, CT | 1,387 | 28.9% | -26.0% |
| Buffalo, NY | 932 | 3.9% | -11.6% |
| Camden, NJ | 1,886 | 11.7% | -17.0% |
| Cape Coral, FL | 2,181 | -10.7% | -21.1% |
| Charleston, SC | 1,684 | -5.5% | -26.7% |
| Charlotte, NC | 4,835 | 8.1% | -7.9% |
| Chicago, IL | 10,812 | 6.6% | -17.0% |
| Cincinnati, OH | 3,073 | 2.1% | -12.2% |
| Cleveland, OH | 3,021 | 11.4% | -8.5% |
| Columbus, OH | 3,092 | 0.9% | -11.4% |
| Dallas, TX | 6,310 | -1.4% | -13.8% |
| Dayton, OH | 1,169 | 3.7% | -12.5% |
| Denver, CO | 5,364 | -6.9% | -17.4% |
| Detroit, MI | 1,937 | -2.1% | -15.7% |
| El Paso, TX | 899 | 1.9% | -7.2% |
| Fort Lauderdale, FL | 3,295 | -4.6% | -26.3% |
| Fort Worth, TX | 3,124 | -0.1% | -10.3% |
| Frederick, MD | 1,878 | 2.0% | -20.8% |
| Fresno, CA | 817 | 4.9% | -14.7% |
| Grand Rapids, MI | 1,434 | 8.3% | -13.4% |
| Greensboro, NC | 1,079 | 14.1% | -10.2% |
| Greenville, SC | 1,509 | 8.5% | -2.3% |
| Hartford, CT | 1,741 | 23.1% | -14.3% |
| Honolulu, HI | 972 | -4.4% | -16.9% |
| Houston, TX | 9,988 | -0.5% | -10.4% |
| Indianapolis, IN | 3,742 | 8.0% | -7.3% |
| Jacksonville, FL | 3,025 | -1.9% | -17.4% |
| Kansas City, MO | 3,784 | 5.2% | -12.9% |
| Knoxville, TN | 1,341 | 2.8% | -14.4% |
| Lake County, IL | 1,505 | 24.0% | -24.1% |
| Las Vegas, NV | 3,467 | -10.1% | -25.0% |
| Los Angeles, CA | 6,118 | 2.3% | -20.7% |
| Louisville, KY | 1,822 | 4.9% | -13.2% |
| McAllen, TX | 422 | -9.1% | -13.2% |
| Memphis, TN | 1,640 | 1.7% | -8.6% |
| Miami, FL | 2,938 | -14.1% | -33.5% |
| Milwaukee, WI | 2,196 | 8.8% | -14.2% |
| Minneapolis, MN | 6,508 | 15.4% | -15.2% |
| Montgomery County, PA | 2,832 | 23.8% | -15.7% |
| Nashville, TN | 4,008 | 6.1% | -9.0% |
| Nassau County, NY | 2,810 | 16.5% | -10.9% |
| New Brunswick, NJ | 3,491 | 15.8% | -12.6% |
| New Haven, CT | 1,186 | 16.0% | -11.0% |
| New Orleans, LA | 1,548 | -1.8% | -18.2% |
| New York, NY | 7,497 | 13.5% | -7.4% |
| Newark, NJ | 2,490 | 22.2% | -19.3% |
| North Port, FL | 2,130 | -15.7% | -26.6% |
| Oakland, CA | 2,467 | -13.7% | -28.6% |
| Oklahoma City, OK | 2,340 | 0.9% | -8.9% |
| Omaha, NE | 1,425 | 12.9% | -12.8% |
| Orlando, FL | 4,333 | -3.2% | -17.1% |
| Oxnard, CA | 761 | 3.4% | -19.0% |
| Philadelphia, PA | 2,675 | 6.2% | -14.5% |
| Phoenix, AZ | 7,584 | -7.3% | -20.7% |
| Pittsburgh, PA | 2,771 | 12.9% | -10.9% |
| Portland, OR | 3,705 | -2.4% | -19.5% |
| Providence, RI | 1,942 | 14.0% | -18.6% |
| Raleigh, NC | 2,651 | 6.9% | -14.6% |
| Richmond, VA | 2,170 | 13.9% | -12.0% |
| Riverside, CA | 5,158 | -2.4% | -19.7% |
| Rochester, NY | 1,085 | 9.7% | -13.0% |
| Sacramento, CA | 2,567 | -4.6% | -25.1% |
| Salt Lake City, UT | 1,392 | -1.4% | -26.4% |
| San Antonio, TX | 3,036 | -2.2% | -23.3% |
| San Diego, CA | 2,759 | -9.4% | -31.2% |
| San Francisco, CA | 1,056 | -17.7% | -32.0% |
| San Jose, CA | 1,392 | -9.5% | -33.1% |
| Seattle, WA | 4,598 | -5.4% | -25.1% |
| St. Louis, MO | 4,356 | 14.4% | -11.5% |
| Stockton, CA | 663 | 0.9% | -16.8% |
| Tacoma, WA | 1,536 | -1.4% | -19.5% |
| Tampa, FL | 6,043 | -4.0% | -16.2% |
| Tucson, AZ | 1,499 | -15.5% | -20.7% |
| Tulsa, OK | 1,405 | -5.9% | -16.6% |
| Virginia Beach, VA | 3,246 | 1.8% | -13.9% |
| Warren, MI | 3,878 | 6.4% | -17.4% |
| Washington, DC | 7,115 | -5.3% | -25.6% |
| West Palm Beach, FL | 2,832 | -9.8% | -34.1% |
| Worcester, MA | 1,300 | 33.5% | -4.1% |
| National | 524,200 | -4.3% | -15.5% |
New Listings
| Redfin Metro | New Listings | Month-Over-Month | Year-Over-Year |
|---|---|---|---|
| Albany, NY | 1,445 | 6.9% | -6.1% |
| Allentown, PA | 690 | -21.2% | -47.8% |
| Anaheim, CA | 2,752 | -10.9% | -22.4% |
| Atlanta, GA | 12,553 | 8.1% | -2.7% |
| Austin, TX | 5,822 | 14.2% | 16.3% |
| Bakersfield, CA | 1,083 | -1.0% | 3.6% |
| Baltimore, MD | 4,662 | -2.7% | -20.0% |
| Birmingham, AL | 1,849 | 11.1% | -11.7% |
| Boise City, ID | 1,992 | 10.5% | 0.1% |
| Boston, MA | 6,762 | 6.4% | -9.9% |
| Bridgeport, CT | 1,680 | -4.3% | -16.0% |
| Buffalo, NY | 1,656 | 10.5% | 0.1% |
| Camden, NJ | 2,117 | 2.6% | -16.8% |
| Cape Coral, FL | 2,448 | -7.2% | -1.0% |
| Charleston, SC | 1,971 | -2.0% | -5.8% |
| Charlotte, NC | 5,361 | 13.6% | 0.0% |
| Chicago, IL | 12,691 | 0.9% | -15.5% |
| Cincinnati, OH | 3,679 | 6.0% | -3.1% |
| Cleveland, OH | 3,761 | 11.6% | -7.8% |
| Colorado Springs, CO | 2,226 | 6.5% | 15.3% |
| Columbus, OH | 3,774 | 6.6% | -6.8% |
| Dallas, TX | 9,828 | 8.4% | 18.7% |
| Dayton, OH | 1,433 | -0.3% | -5.9% |
| Denver, CO | 7,283 | 11.1% | -3.3% |
| Detroit, MI | 2,946 | 5.6% | 6.5% |
| El Paso, TX | 1,162 | 10.8% | -3.8% |
| Fort Lauderdale, FL | 4,126 | 1.9% | -4.4% |
| Fort Worth, TX | 4,758 | 14.8% | 16.8% |
| Frederick, MD | 1,960 | -3.3% | -22.3% |
| Fresno, CA | 986 | -5.2% | -7.7% |
| Grand Rapids, MI | 1,908 | 12.3% | 2.1% |
| Greensboro, NC | 880 | -13.6% | -33.3% |
| Greenville, SC | 1,687 | 10.6% | 2.8% |
| Hartford, CT | 1,983 | 3.8% | -16.4% |
| Honolulu, HI | 899 | -11.0% | -28.4% |
| Houston, TX | 13,730 | 10.6% | 1.8% |
| Indianapolis, IN | 4,772 | 15.5% | 6.7% |
| Jacksonville, FL | 3,864 | 3.5% | -0.7% |
| Kansas City, MO | 4,118 | 1.9% | -9.9% |
| Knoxville, TN | 1,501 | 2.2% | -5.7% |
| Lake County, IL | 1,585 | -1.1% | -25.0% |
| Las Vegas, NV | 5,633 | 10.0% | 13.5% |
| Los Angeles, CA | 6,889 | -8.3% | -21.0% |
| Louisville, KY | 2,336 | 13.8% | -1.5% |
| McAllen, TX | 701 | 12.2% | 20.9% |
| Memphis, TN | 2,127 | 13.7% | 6.5% |
| Miami, FL | 4,346 | 1.7% | -5.4% |
| Milwaukee, WI | 2,514 | 2.6% | -26.9% |
| Minneapolis, MN | 6,958 | -7.0% | -13.4% |
| Montgomery County, PA | 2,967 | 4.0% | -21.5% |
| Nashville, TN | 5,321 | 16.4% | 30.5% |
| Nassau County, NY | 3,833 | 0.7% | -9.9% |
| New Brunswick, NJ | 4,346 | 1.7% | -12.8% |
| New Haven, CT | 1,389 | 2.9% | -10.3% |
| New Orleans, LA | 1,992 | 4.7% | 2.4% |
| New York, NY | 9,700 | -5.5% | -11.7% |
| Newark, NJ | 3,074 | 3.9% | -14.0% |
| North Port, FL | 2,900 | -0.1% | 19.5% |
| Oakland, CA | 3,424 | 0.9% | -10.6% |
| Oklahoma City, OK | 2,966 | 2.8% | 1.4% |
| Omaha, NE | 1,514 | 7.8% | -10.8% |
| Orlando, FL | 6,080 | 5.4% | 10.8% |
| Oxnard, CA | 826 | -6.1% | -18.3% |
| Philadelphia, PA | 3,209 | 3.9% | -6.3% |
| Phoenix, AZ | 10,901 | -0.2% | 9.4% |
| Pittsburgh, PA | 3,439 | 1.4% | -4.9% |
| Portland, OR | 4,755 | 4.9% | -4.9% |
| Providence, RI | 2,402 | 0.0% | -16.5% |
| Raleigh, NC | 3,052 | 1.3% | 10.4% |
| Richmond, VA | 2,189 | -2.0% | -14.0% |
| Riverside, CA | 6,723 | -3.9% | -4.5% |
| Rochester, NY | 1,534 | 6.2% | -10.8% |
| Sacramento, CA | 3,544 | 0.1% | -7.2% |
| San Antonio, TX | 4,607 | 12.5% | 7.6% |
| San Diego, CA | 3,585 | -3.2% | -17.7% |
| San Francisco, CA | 1,456 | -4.7% | -5.9% |
| San Jose, CA | 1,687 | -13.4% | -19.8% |
| Seattle, WA | 6,230 | 2.6% | -4.9% |
| St. Louis, MO | 4,628 | 8.2% | -9.3% |
| Stockton, CA | 940 | 1.7% | -3.7% |
| Tacoma, WA | 2,103 | 6.6% | 3.6% |
| Tampa, FL | 8,279 | 8.2% | 8.8% |
| Tucson, AZ | 1,849 | 3.5% | -0.4% |
| Tulsa, OK | 1,877 | 23.2% | -5.1% |
| Virginia Beach, VA | 3,509 | 1.2% | -10.7% |
| Warren, MI | 5,428 | 8.6% | -2.5% |
| Washington, DC | 7,689 | -8.6% | -25.1% |
| West Palm Beach, FL | 3,972 | -0.9% | 5.9% |
| Worcester, MA | 1,567 | 7.2% | -8.7% |
| National | 636,500 | 0.1% | -4.4% |
All Homes for Sale
| Redfin Metro | All Homes for Sale | Month-Over-Month | Year-Over-Year |
|---|---|---|---|
| Albany, NY | 2,889 | 11.6% | -11.7% |
| Allentown, PA | 1,506 | -9.6% | -41.1% |
| Anaheim, CA | 6,608 | 0.6% | -17.7% |
| Atlanta, GA | 25,276 | 8.8% | -0.9% |
| Austin, TX | 12,103 | 21.6% | 26.9% |
| Bakersfield, CA | 2,439 | 7.4% | 16.6% |
| Baltimore, MD | 9,363 | 1.3% | -14.1% |
| Birmingham, AL | 4,405 | 2.0% | -14.0% |
| Boise City, ID | 4,091 | 23.2% | -8.7% |
| Boston, MA | 12,544 | 5.9% | -7.9% |
| Bridgeport, CT | 4,447 | 6.7% | -27.9% |
| Buffalo, NY | 2,740 | 14.2% | 0.4% |
| Camden, NJ | 4,388 | 3.3% | -16.3% |
| Cape Coral, FL | 5,506 | 5.7% | 15.4% |
| Charleston, SC | 4,993 | 3.7% | -13.5% |
| Charlotte, NC | 10,966 | 13.3% | -11.7% |
| Chicago, IL | 38,062 | 2.6% | 17.6% |
| Cincinnati, OH | 8,464 | 6.2% | -8.9% |
| Cleveland, OH | 7,310 | 6.5% | -14.4% |
| Colorado Springs, CO | 4,229 | 17.8% | 31.5% |
| Columbus, OH | 8,132 | 8.3% | -6.4% |
| Dallas, TX | 18,607 | 16.6% | 16.7% |
| Dayton, OH | 2,916 | 5.2% | 1.5% |
| Denver, CO | 11,284 | 11.4% | 10.9% |
| Detroit, MI | 6,449 | 9.2% | 14.6% |
| El Paso, TX | 2,501 | 9.9% | -11.8% |
| Fort Lauderdale, FL | 10,947 | 2.8% | -19.5% |
| Fort Worth, TX | 8,783 | 17.0% | 17.0% |
| Frederick, MD | 3,702 | 2.6% | -18.3% |
| Fresno, CA | 1,931 | 4.3% | 5.9% |
| Grand Rapids, MI | 2,915 | 13.8% | 3.1% |
| Greensboro, NC | 2,039 | -3.5% | -28.6% |
| Greenville, SC | 3,914 | 8.7% | -5.8% |
| Hartford, CT | 4,189 | 5.4% | -29.2% |
| Honolulu, HI | 3,143 | -4.9% | -14.9% |
| Houston, TX | 28,743 | 10.1% | 5.2% |
| Indianapolis, IN | 7,459 | 12.1% | 4.3% |
| Jacksonville, FL | 8,098 | 8.4% | 0.1% |
| Kansas City, MO | 7,965 | 3.6% | -8.2% |
| Knoxville, TN | 3,867 | 6.4% | -10.6% |
| Lake County, IL | 4,510 | 5.3% | 8.9% |
| Las Vegas, NV | 12,031 | 16.5% | 17.7% |
| Los Angeles, CA | 18,182 | 0.4% | -17.0% |
| Louisville, KY | 4,259 | 10.0% | -4.2% |
| McAllen, TX | 1,935 | 6.9% | 7.9% |
| Memphis, TN | 4,324 | 10.1% | -8.8% |
| Miami, FL | 13,412 | 2.4% | -20.2% |
| Milwaukee, WI | 6,169 | 5.2% | -20.4% |
| Minneapolis, MN | 13,908 | 3.4% | 0.1% |
| Montgomery County, PA | 5,426 | 4.8% | -22.0% |
| Nashville, TN | 10,466 | 19.3% | 25.3% |
| Nassau County, NY | 9,453 | 8.7% | -13.7% |
| New Brunswick, NJ | 11,405 | 5.5% | 3.0% |
| New Haven, CT | 3,265 | 4.5% | -23.1% |
| New Orleans, LA | 4,591 | 6.4% | 2.0% |
| New York, NY | 36,341 | 3.1% | -11.8% |
| Newark, NJ | 7,652 | 7.7% | -13.0% |
| North Port, FL | 5,566 | 10.2% | 34.0% |
| Oakland, CA | 6,410 | 10.7% | 9.3% |
| Oklahoma City, OK | 5,516 | 10.5% | 14.9% |
| Omaha, NE | 2,421 | 6.0% | -9.9% |
| Orlando, FL | 11,024 | 13.5% | 11.1% |
| Oxnard, CA | 2,038 | 3.6% | -10.7% |
| Philadelphia, PA | 8,615 | 3.2% | -1.6% |
| Phoenix, AZ | 23,871 | 11.1% | 21.0% |
| Pittsburgh, PA | 10,082 | 6.6% | -6.0% |
| Portland, OR | 8,276 | 10.5% | 4.1% |
| Providence, RI | 4,925 | 7.4% | -11.6% |
| Raleigh, NC | 6,311 | 7.3% | -1.0% |
| Richmond, VA | 3,625 | -0.8% | -17.3% |
| Riverside, CA | 16,484 | 6.1% | 6.4% |
| Rochester, NY | 2,396 | 3.1% | -8.8% |
| Sacramento, CA | 7,036 | 9.8% | 14.1% |
| San Antonio, TX | 9,381 | 11.8% | 9.5% |
| San Diego, CA | 6,975 | 6.9% | -8.7% |
| San Francisco, CA | 3,492 | 3.4% | 4.8% |
| San Jose, CA | 3,516 | 4.3% | -4.5% |
| Seattle, WA | 10,195 | 11.4% | 9.5% |
| St. Louis, MO | 9,204 | 8.0% | -10.9% |
| Stockton, CA | 1,909 | 12.1% | 21.9% |
| Tacoma, WA | 3,468 | 15.7% | 19.9% |
| Tampa, FL | 14,458 | 12.9% | 12.4% |
| Tucson, AZ | 4,389 | 1.4% | -0.9% |
| Tulsa, OK | 3,225 | 15.4% | -3.1% |
| Virginia Beach, VA | 6,651 | 1.5% | -16.3% |
| Warren, MI | 9,957 | 13.9% | 3.3% |
| Washington, DC | 16,825 | -0.2% | -15.5% |
| West Palm Beach, FL | 10,604 | 5.8% | -4.5% |
| Worcester, MA | 2,852 | 5.8% | -7.6% |
| National | 1,450,900 | 2.4% | 1.8% |
Median Off-Market Redfin Estimate
| Redfin Metro | Estimate | Month-Over-Month | Year-Over-Year |
|---|---|---|---|
| Albany, NY | $242,400 | 1.9% | 9.0% |
| Allentown, PA | $287,400 | 1.4% | 18.9% |
| Anaheim, CA | $1,076,500 | 1.4% | 27.3% |
| Atlanta, GA | $354,200 | 1.8% | 30.4% |
| Austin, TX | $529,000 | 1.4% | 36.7% |
| Bakersfield, CA | $280,300 | 1.0% | 26.5% |
| Baltimore, MD | $349,400 | 1.1% | 14.0% |
| Baton Rouge, LA | $154,300 | 1.1% | 6.3% |
| Birmingham, AL | $180,500 | 1.4% | 17.7% |
| Boston, MA | $653,000 | 1.1% | 11.0% |
| Bridgeport, CT | $491,500 | 1.2% | 14.4% |
| Buffalo, NY | $208,600 | 1.6% | 20.1% |
| Camden, NJ | $295,100 | 1.5% | 22.0% |
| Charleston, SC | $343,400 | 2.2% | 26.5% |
| Charlotte, NC | $328,500 | 2.1% | 29.3% |
| Chicago, IL | $298,100 | 1.1% | 5.1% |
| Cincinnati, OH | $226,200 | 1.3% | 19.2% |
| Cleveland, OH | $190,600 | 1.5% | 18.2% |
| Columbus, OH | $266,900 | 1.2% | 18.4% |
| Dallas, TX | $396,200 | 2.1% | 33.9% |
| Dayton, OH | $167,500 | 1.0% | 16.0% |
| Denver, CO | $593,100 | 1.1% | 25.4% |
| Detroit, MI | $136,300 | 1.5% | 14.6% |
| Fort Lauderdale, FL | $387,300 | 2.4% | 26.2% |
| Fort Worth, TX | $329,600 | 1.6% | 30.8% |
| Frederick, MD | $528,300 | 1.0% | 13.9% |
| Fresno, CA | $380,100 | 1.4% | 24.0% |
| Grand Rapids, MI | $251,600 | 1.6% | 21.5% |
| Greensboro, NC | $197,700 | 2.0% | 21.7% |
| Greenville, SC | $230,900 | 2.1% | 25.6% |
| Hartford, CT | $288,000 | 1.6% | 17.9% |
| Houston, TX | $281,100 | 1.8% | 24.4% |
| Indianapolis, IN | $234,500 | 1.8% | 23.7% |
| Jacksonville, FL | $328,300 | 2.3% | 32.9% |
| Kansas City, MO | $255,200 | 1.4% | 21.5% |
| Knoxville, TN | $270,500 | 2.5% | 28.5% |
| Lake County, IL | $264,500 | 1.4% | 9.6% |
| Las Vegas, NV | $425,900 | 1.8% | 30.5% |
| Los Angeles, CA | $869,200 | 1.4% | 17.6% |
| Louisville, KY | $210,700 | 0.7% | 6.9% |
| Memphis, TN | $210,200 | 1.9% | 20.7% |
| Miami, FL | $442,400 | 2.1% | 25.5% |
| Milwaukee, WI | $268,300 | 1.4% | 15.4% |
| Minneapolis, MN | $350,500 | 1.0% | 15.2% |
| Montgomery County, PA | $426,000 | 1.2% | 16.5% |
| Nashville, TN | $421,800 | 2.3% | 34.1% |
| Nassau County, NY | $617,300 | 0.8% | 13.0% |
| New Brunswick, NJ | $472,600 | 1.3% | 19.5% |
| New Haven, CT | $298,500 | 1.7% | 19.4% |
| New Orleans, LA | $210,400 | 1.0% | 9.8% |
| Newark, NJ | $468,600 | 1.2% | 11.8% |
| North Port, FL | $402,400 | 2.7% | 46.1% |
| Oakland, CA | $1,116,100 | 1.3% | 21.5% |
| Oklahoma City, OK | $195,600 | 1.7% | 19.6% |
| Omaha, NE | $253,000 | 1.5% | 16.6% |
| Orlando, FL | $354,800 | 2.3% | 33.5% |
| Oxnard, CA | $835,400 | 1.0% | 21.2% |
| Philadelphia, PA | $240,500 | 0.9% | 9.1% |
| Phoenix, AZ | $469,600 | 2.1% | 40.0% |
| Pittsburgh, PA | $165,400 | 1.2% | 10.2% |
| Portland, OR | $549,200 | 0.8% | 20.2% |
| Providence, RI | $401,300 | 1.4% | 17.1% |
| Raleigh, NC | $400,600 | 2.2% | 35.8% |
| Richmond, VA | $308,400 | 1.8% | 16.4% |
| Riverside, CA | $515,700 | 1.3% | 28.4% |
| Rochester, NY | $196,400 | 1.7% | 20.0% |
| Sacramento, CA | $598,300 | 0.8% | 22.4% |
| Salt Lake City, UT | $566,200 | 1.1% | 33.8% |
| San Antonio, TX | $262,200 | 1.8% | 25.5% |
| San Diego, CA | $909,500 | 1.4% | 25.6% |
| San Francisco, CA | $1,649,000 | 0.6% | 14.3% |
| San Jose, CA | $1,676,300 | 1.0% | 25.3% |
| Seattle, WA | $835,400 | 0.7% | 24.2% |
| St. Louis, MO | $193,400 | 1.2% | 14.9% |
| Tacoma, WA | $542,800 | 1.4% | 21.9% |
| Tampa, FL | $347,900 | 2.4% | 37.6% |
| Tucson, AZ | $311,100 | 2.3% | 26.3% |
| Tulsa, OK | $170,400 | 1.5% | 15.6% |
| Virginia Beach, VA | $301,200 | 1.0% | 16.4% |
| Warren, MI | $272,000 | 1.1% | 13.7% |
| Washington, DC | $508,900 | 1.0% | 13.2% |
| West Palm Beach, FL | $428,700 | 2.9% | 36.7% |
| Worcester, MA | $376,400 | 1.4% | 16.3% |
| National | $421,300 | 0.4% | 21.1% |


