
Sales Volume also Experienced a Sharp but Anticipated Seasonal Decline from August; Up 8 Percent Since September 2012
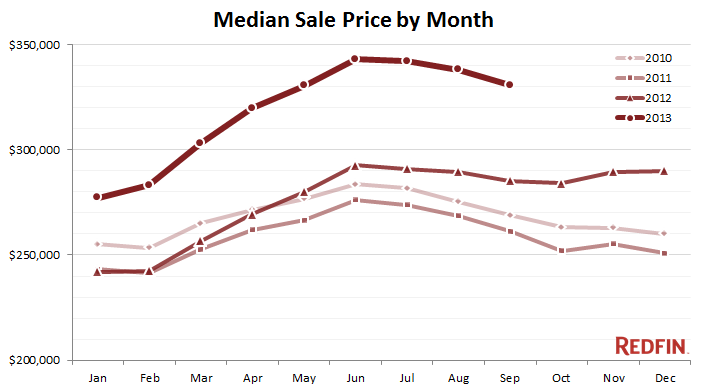
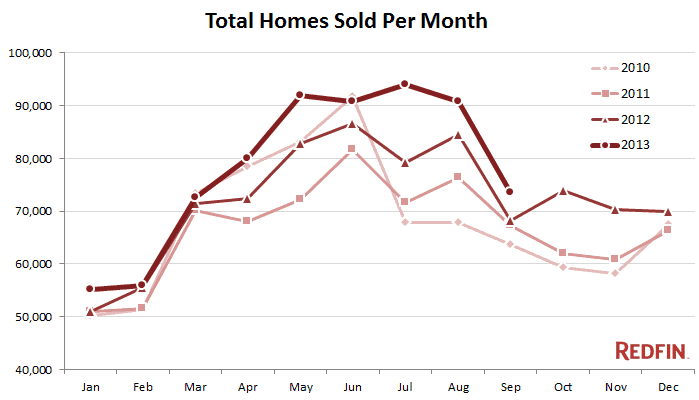
The housing market frenzy of 2013 has officially come to a close. In line with normal seasonal trends, home sales, prices, and inventory all dropped from August. Prices had their third consecutive month-over-month drop, falling 2.2 percent this month. Home sales dropped 19 percent from August, and inventory fell 3.4 percent. However, the continuing housing market recovery is still evident in year-over-year gains, both in home prices and sales volume. Low inventory is still the thorn in the market’s side, with an annual decrease of 17.5 percent.
September Summary for Redfin’s 19 Markets
| September 2013 | Month-Over-Month Change | Year-Over-Year Change | |
|---|---|---|---|
| Median Sale Price | $330,470 | -2.2% | +15.9% |
| Total Homes Sold | 73,781 | -18.8% | +8.1% |
| Total Homes For Sale | 234,670 | -3.4% | -17.5% |
Home Price Changes Differ by Climate
In September, 11 cities showed month-over-month price declines versus 10 cities last year. Colder climates, as usual, showed larger seasonal declines in prices. For example, Philadelphia, Chicago, and Long Island posted 8.2 percent, 6.1 percent, and 5.7 percent month-over-month declines while Riverside, CA, San Diego and Austin kept things hot a bit longer with 2.4 percent, 1.5 percent, and one percent month-over-month increases.
Home Sales Take Steep, but Normal Fall
In September home sales fell 18.8 percent, a large drop, but in step with normal seasonal trends. Comparatively, sales dropped 19.3 percent between August and September 2012. Based on current pending sales data, Redfin estimates October will have a 6 percent drop in sales from September compared to an 8 percent rise during the same period last year.
Inventory Still Very Low
Homes continue to sell quickly, but they are not being replaced by new listings. There are two big reasons why people are not listing their homes: they are underwater on their current mortgage, or their mortgage interest rate is so low that a new loan would be much more expensive. Not surprisingly, we do not expect the inventory situation to improve as the holidays approach.

September 2013 Sale Prices By Metro Area
| Metro Area | Median Sale Price | Month-Over-Month Change | Year-Over-Year Change |
|---|---|---|---|
| Austin | $223,318 | +1.0% | +11.7% |
| Baltimore | $248,500 | -1.7% | +5.3% |
| Boston | $370,000 | -4.3% | +10.4% |
| Chicago | $185,000 | -6.1% | +15.6% |
| Denver | $255,000 | -1.0% | +8.5% |
| Las Vegas | $169,397 | +0.3% | +30.3% |
| Long Island | $370,000 | -5.7% | +2.8% |
| Los Angeles | $470,000 | -1.1% | +23.4% |
| Philadelphia | $210,000 | -8.2% | +0.0% |
| Phoenix | $187,500 | +1.4% | +23.4% |
| Portland | $268,550 | -0.2% | +17.3% |
| Riverside | $256,000 | +2.4% | +28.0% |
| Sacramento | $279,000 | +1.5% | +29.8% |
| San Diego | $426,500 | +1.5% | +21.5% |
| San Francisco | $605,000 | -3.3% | +18.6% |
| San Jose | $680,000 | +0.6% | +20.0% |
| Seattle | $325,000 | +1.6% | +14.0% |
| Ventura | $463,800 | -0.3% | +22.1% |
| Washington | $349,900 | -5.4% | +6.4% |
| 19 Markets | $330,470 | -2.2% | +15.9% |
September 2013 Home Sold By Metro Area
| Metro Area | Homes Sold | Month-Over-Month Change | Year-Over-Year Change |
|---|---|---|---|
| Austin | 2,356 | -24.5% | +23.6% |
| Baltimore | 2,489 | -16.2% | +12.7% |
| Boston | 3,796 | -28.4% | +20.0% |
| Chicago | 9,560 | -19.7% | +25.9% |
| Denver | 4,050 | -22.1% | +11.5% |
| Las Vegas | 3,207 | -9.4% | -1.1% |
| Long Island | 2,013 | -21.8% | +18.9% |
| Los Angeles | 8,023 | -17.0% | -1.8% |
| Philadelphia | 4,662 | -21.7% | +10.7% |
| Phoenix | 6,057 | -11.1% | -1.7% |
| Portland | 2,651 | -19.9% | +8.2% |
| Riverside | 4,255 | -14.2% | +3.4% |
| Sacramento | 2,419 | -16.6% | -8.9% |
| San Diego | 2,732 | -22.1% | -7.2% |
| San Francisco | 3,367 | -15.8% | +17.2% |
| San Jose | 1,396 | -14.7% | +5.0% |
| Seattle | 4,333 | -19.6% | +14.0% |
| Ventura | 701 | -11.5% | -5.8% |
| Washington | 5,714 | -22.4% | +7.4% |
| 19 Markets | 73,781 | -18.8% | +8.1% |
September 2013 Homes For Sale By Metro Area
| Metro Area | Homes For Sale | Month-Over-Month Change | Year-Over-Year Change |
|---|---|---|---|
| Austin | 5,501 | -8.8% | -23.6% |
| Baltimore | 12,163 | -1.3% | -9.5% |
| Boston | 11,845 | -3.7% | -30.1% |
| Chicago | 35,288 | -4.0% | -30.0% |
| Denver | 8,936 | -8.0% | -13.5% |
| Las Vegas | 9,938 | -17.6% | -46.6% |
| Long Island | 16,053 | -2.3% | -14.7% |
| Los Angeles | 18,334 | -4.0% | -11.8% |
| Philadelphia | 34,004 | -1.2% | -8.3% |
| Phoenix | 17,811 | +5.1% | +1.7% |
| Portland | 8,712 | -7.8% | -20.6% |
| Riverside | 11,162 | -3.3% | -10.7% |
| Sacramento | 854 | -10.3% | -17.5% |
| San Diego | 6,720 | -5.3% | -4.0% |
| San Francisco | 5,307 | +1.3% | -8.1% |
| San Jose | 1,924 | -3.8% | -1.7% |
| Seattle | 11,880 | -5.0% | -15.6% |
| Ventura | 1,417 | -7.0% | -5.6% |
| Washington | 16,821 | +1.6% | -9.5% |
| 19 Markets | 234,670 | -3.4% | -17.5% |
About the Real-Time Home Price Tracker
Redfin’s monthly report on home prices, inventory levels and sales volume is an up-to-date, accurate portrait of the U.S. real estate market, published before other market reports. As a broker with access to dozens of Multiple Listing Services (MLSs) used by real estate agents to list properties and record sales, Redfin gets data within minutes of a sale, pending sale or listing activation, well before any government, media or analytics organization. Full data for September 2013 may be downloaded in a spreadsheet.


