
With a record share of Redfin.com home searchers looking to move to another metro, out-of-towners are making it difficult for local residents to win bidding wars. The average out-of-towner moving to Phoenix has $630,000 to spend on a home, versus $510,000 for locals.
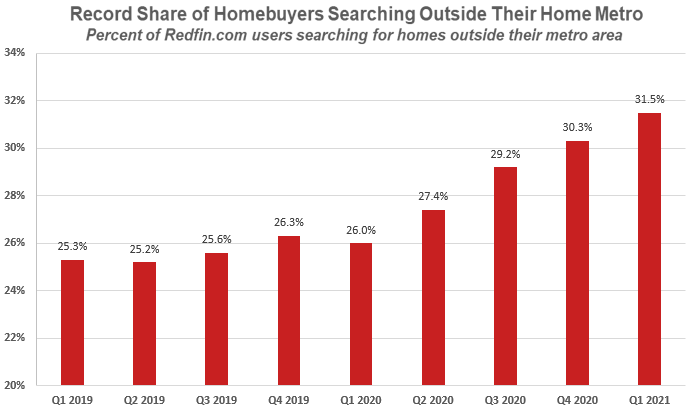
Nationwide, 31.5% of Redfin.com users looked to move to a different metro area in the first quarter, up from 30.3% in the fourth quarter of 2020 and 26% a year earlier. It’s the highest share since Redfin started tracking migration in 2017.
The upswing in people moving from one area to another since the start of the pandemic is due partly to remote workers moving to relatively affordable areas in search of larger homes with more outdoor space. One consequence of pandemic-driven migration is that out-of-towners are driving up home prices and making it difficult for local residents to win bidding wars. That’s because out-of-towners tend to have significantly bigger budgets than locals.
Out-of-towners have significantly bigger budgets than locals in the most popular migration destinations
The average housing budget for out-of-towners moving to Phoenix, the number-one migration destination for Redfin.com users in the first quarter, was $627,000, 23% higher than the $510,000 average budget for local buyers. In Austin, the next-most popular destination, out-of-towners had an average budget of $855,000, 32% higher than the average local budget. Next comes Las Vegas, where the average out-of-towner had a $582,000 budget, 16% higher than locals. See the end of this report for a complete list of out-of-town versus local budgets for the cities included in our analysis.
“Remote work is here to stay for many Americans. The long-term cultural shift is disseminating money once concentrated on the coasts throughout the country,” said Redfin Chief Economist Daryl Fairweather. “Affluent remote workers are able to get more for their money by moving from job centers like the Bay Area to more affordable places like Phoenix and Las Vegas. But local residents looking to buy their first home are losing out because of the big budgets flowing into their hometowns. Many local buyers, particularly those who aren’t selling a home to fund their purchase, are being forced to compromise. They’re searching for smaller homes in farther-flung neighborhoods, or even dropping out of the search altogether.”
Phoenix home-sale prices were up 20% year over year to $366,000 in March, and they were up 28.2% to $427,000 in Austin and 13.9% to $336,000 in Las Vegas. But even with significant increases, prices in those destinations are much lower than the places migrants are moving in from. In the San Francisco Bay Area, the top origin for people moving to Austin, the typical home sold for $1.43 million in March, and in Los Angeles, the top origin for people moving to Phoenix and Las Vegas, it was $774,000.
“Not only are a lot of remote workers moving to Las Vegas, but many people are moving here and bringing their businesses with them, setting up shop in Nevada,” said local Redfin real estate agent Lori Garlick. “Inventory is so low that the market is frustrating for locals, first-time buyers and people who don’t have big down payments. Potential buyers are waiting in line to tour anything with a pool and a nice-sized lot. But if a buyer doesn’t have a budget big enough to pay over list price and throw in other incentives for the seller, like waiving the appraisal fee, they’re just not going to get the house.”
The average housing budget for out-of-towners moving to Nashville in the first quarter was $719,000, 48% higher than the $485,000 average budget for local buyers, a bigger premium than any other metro. It’s followed by Atlanta, where out-of-towners have an average budget of $698,000, 33% higher than the average local budget.
Atlanta, where 26% of Redfin.com users searching for homes in the first quarter were from out of town, was the fifth-most popular migration destination in the first quarter. Nashville, where 39% of Redfin.com users searching for homes in the first quarter were from out of town, is also a popular destination.
Out-of-towners have bigger budgets than locals in 32 of the 35 cities included in the budget analysis. San Francisco, San Jose and Fremont, CA (part of the Oakland metro) are the only cities where locals have higher budgets than migrants. That stands to reason, as the Bay Area has the highest median income in the country, which means locals are likely able to afford higher-priced homes than those moving in from other areas.
See the end of this report for a table with detailed data on local versus out-of-town homebuying budgets for all the cities included in this analysis.
Relatively affordable metros continue to pick up in popularity
Dallas and Atlanta were the next-most popular destinations for people looking to move to a different area, meaning they–along with Phoenix, Austin and Las Vegas–had the biggest net inflows of Redfin.com users in the first quarter. A net inflow is a measure of how many more Redfin.com home searchers looked to move into a metro than leave, out of a sample of 2 million users.
Relatively affordable inland metros are typically the most sought-after for Redfin.com users looking to leave their home metro, a trend that has intensified with the pandemic. Net inflow of home searchers has increased significantly from a year ago in all of the top 10 migration destinations.
Top 10 Metros by Net Inflow of Redfin.com Users and Their Top Origins
| Rank | Metro* | Net Inflow, Q1 2021† | Net Inflow, Q1 2020 | Portion of Searches from Users Outside the Metro, Q1 2021 | Portion of Searches from Users Outside the Metro, Q1 2020 | Top Origin | Top Out-of-State Origin |
|---|---|---|---|---|---|---|---|
| 1 | Phoenix, AZ | 12,391 | 8,848 | 38.5% | 34.7% | Los Angeles, CA | Los Angeles, CA |
| 2 | Austin, TX | 10,953 | 4,983 | 42.3% | 32.0% | San Francisco, CA | San Francisco, CA |
| 3 | Las Vegas, NV | 10,939 | 6,821 | 52.6% | 46.6% | Los Angeles, CA | Los Angeles, CA |
| 4 | Dallas, TX | 9,178 | 4,437 | 32.8% | 25.9% | Los Angeles, CA | Los Angeles, CA |
| 5 | Atlanta, GA | 8,855 | 6,213 | 26.6% | 26.2% | New York, NY | New York, NY |
| 6 | Miami, FL | 8,846 | 2,859 | 31.8% | 26.2% | New York, NY | New York, NY |
| 7 | Sacramento, CA | 8,748 | 5,792 | 48.1% | 43.5% | San Francisco, CA | Reno, NV |
| 8 | Tampa, FL | 7,621 | 4,092 | 59.9% | 56.0% | Orlando, FL | New York, NY |
| 9 | Cape Coral, FL | 6,894 | 2,755 | 76.5% | 73.6% | Chicago, IL | Chicago, IL |
| 10 | Orlando, FL | 6,350 | 2,476 | 58.4% | 51.6% | New York, NY | New York, NY |
*Combined statistical areas with at least 500 users in Q1 2021
†Negative values indicate a net outflow; among the one million users sampled for this analysis only
Migrants are looking to move away from New York, the Bay Area and Los Angeles
In terms of places people are looking to leave, New York, the Bay Area, Los Angeles, Washington, D.C. and Seattle top the list of places with the biggest net outflow in the first quarter. A net outflow is a measure of how many more Redfin.com home searchers looked to leave a metro than move in, out of a sample of 2 million users.
Expensive coastal cities tend to be the places Redfin.com home searchers are looking to leave; in fact, the list of places with the biggest net outflow is the same as it was in the fourth quarter of last year. But as is the case with inflow to the most popular destinations, net outflow has shot up over the last year, more than doubling in seven of the top 10 places migrants are looking to leave.
Top 10 Metros by Net Outflow of Redfin.com Users and Their Top Destinations
| Rank | Metro* | Net Outflow, Q1 2021† | Net Outflow, Q1 2020 | Portion of Local Users Searching Elsewhere, Q1 2021 | Portion of Local Users Searching Elsewhere, Q1 2020 | Top Destination | Top Out-of-State Destination |
|---|---|---|---|---|---|---|---|
| 1 | New York, NY | 48,416 | 31,915 | 35.5% | 36.3% | Philadelphia, PA | Philadelphia, PA |
| 2 | San Francisco, CA | 40,562 | 27,620 | 23.9% | 21.3% | Sacramento, CA | Austin, TX |
| 3 | Los Angeles, CA | 28,115 | 16,543 | 18.5% | 16.1% | San Diego, CA | Las Vegas, NV |
| 4 | Washington, D.C. | 16,570 | 7,355 | 14.8% | 11.3% | Salisbury, MD | Salisbury, MD |
| 5 | Seattle, WA | 9,770 | 3,865 | 16.3% | 12.8% | Phoenix, AZ | Phoenix, AZ |
| 6 | Chicago, IL | 8,713 | 4,000 | 13.6% | 10.2% | Cape Coral, FL | Cape Coral, FL |
| 7 | Denver, CO | 8,403 | 3,631 | 30.6% | 23.1% | Seattle, WA | Seattle, WA |
| 8 | Boston, MA | 4,629 | 657 | 14.9% | 11.2% | Portland, ME | Portland, ME |
| 9 | Milwaukee, WI | 3,155 | 1,367 | 43.7% | 38.2% | Chicago, IL | Chicago, IL |
| 10 | Indianapolis, IN | 2,363 | 679 | 41.3% | 32.6% | Chicago, IL | Chicago, IL |
*Combined statistical areas with at least 500 users in Q1 2021
†Among the one million users sampled for this analysis only
Out-of-towners searching for homes in Nashville, Atlanta and Austin have the biggest budget premiums over locals
Average budgets of Redfin.com home searchers, out-of-towners versus locals, Q1 2021
Ranking: Cities at the top of the list have bigger average budgets for migrants
| City | Average maximum budget for migrants (Redfin.com saved searches) | Average maximum budget for locals (Redfin.com saved searches) | Percent difference between budgets for migrants over locals | Median sale price (Metro area, March 2021) |
|---|---|---|---|---|
| Nashville, TN | $719,254 | $485,101 | 48.3% | $345,000 |
| Atlanta, GA | $697,613 | $523,657 | 33.2% | $300,000 |
| Austin, TX | $855,353 | $649,648 | 31.7% | $427,000 |
| Houston, TX | $571,554 | $435,815 | 31.2% | $289,000 |
| Denver, CO | $883,919 | $699,514 | 26.4% | $495,000 |
| New York, NY | $997,276 | $800,039 | 24.7% | $624,000 |
| Philadelphia, PA | $510,001 | $410,096 | 24.4% | $259,000 |
| San Antonio, TX | $464,542 | $374,813 | 23.9% | $265,000 |
| Phoenix, AZ | $626,994 | $510,448 | 22.8% | $366,000 |
| Charlotte, NC | $553,749 | $457,186 | 21.1% | $312,900 |
| Dallas, TX | $703,510 | $581,780 | 20.9% | $345,000 |
| Washington, D.C. | $1,004,094 | $850,074 | 18.1% | $477,500 |
| Henderson, NV (Las Vegas metro) | $618,544 | $527,286 | 17.3% | $336,000 |
| Chicago, IL | $639,122 | $548,115 | 16.6% | $300,000 |
| Las Vegas, NV | $582,238 | $501,587 | 16.1% | $336,000 |
| Scottsdale, AZ (Phoenix metro) | $971,679 | $838,842 | 15.8% | $366,000 |
| Oakland, CA | $1,254,789 | $1,091,991 | 47.2% | $890,000 |
| Portland, OR | $758,573 | $660,581 | 14.9% | $476,900 |
| Sacramento, CA | $616,701 | $539,240 | 14.4% | $520,000 |
| San Diego, CA | $1,135,751 | $993,195 | 14.4% | $700,000 |
| Los Angeles, CA | $1,523,928 | $1,335,669 | 14.1% | $773,800 |
| Chandler, AZ (Phoenix metro) | $582,882 | $517,672 | 12.6% | $366,000 |
| Gilbert, AZ (Phoenix metro) | $549,843 | $549,843 | 9.6% | $366,000 |
| Boston, MA | $1,072,137 | $992,741 | 8% | $578,500 |
| Seattle, WA | $1,077,283 | $1,044,283 | 7.3% | $700,000 |
| Long Beach, CA (Los Angeles metro) | $884,421 | $835,804 | 5.8% | $773,800 |
| Tacoma, WA | $557,950 | $529,241 | 5.4% | $475,000 |
| Baltimore, MD | $354,903 | $342,666 | 3.6% | $315,000 |
| Pleasanton, CA (Oakland metro) | $1,479,078 | $1,433,694 | 3.2% | $890,000 |
| Irvine, CA (Anaheim metro) | $1,240,758 | $1,221,609 | 1.6% | $851,000 |
| San Ramon, CA (Oakland metro) | $1,373,646 | $1,360,943 | 0.9% | $890,000 |
| Riverside, CA | $627,498 | $624,066 | 0.6% | $480,000 |
| Fremont, CA (Oakland metro) | $1,372,225 | $1,413,710 | -2.9% | $890,000 |
| San Jose, CA | $1,329,279 | $1,374,698 | -3.3% | $1,330,000 |
| San Francisco, CA | $1,691,537 | $1,761,205 | -4% | $1,427,500 |
Methodology
The migration analysis is based on a sample of more than 2 million Redfin.com users who searched for homes across 87 metro areas in the first quarter, excluding searches unlikely to precede an actual relocation or home purchase. To be included in this dataset, a Redfin.com user must have viewed at least 10 homes in a particular metro area, and homes in that area must make up at least 80% of the user’s searches.
The budget analysis is based on average maximum list-price filters for homes set by Redfin.com users in their saved searches. The analysis includes cities in the U.S. with at least 3,000 Redfin.com home searchers from inside the metro and 3,000 from outside the metro last year. Note that the budget analysis is based on cities, while the migration analysis is based on metro areas.


