
- Pocket listings—homes sold without being marketed publicly—have become more common since 2019, according to a survey of agents.
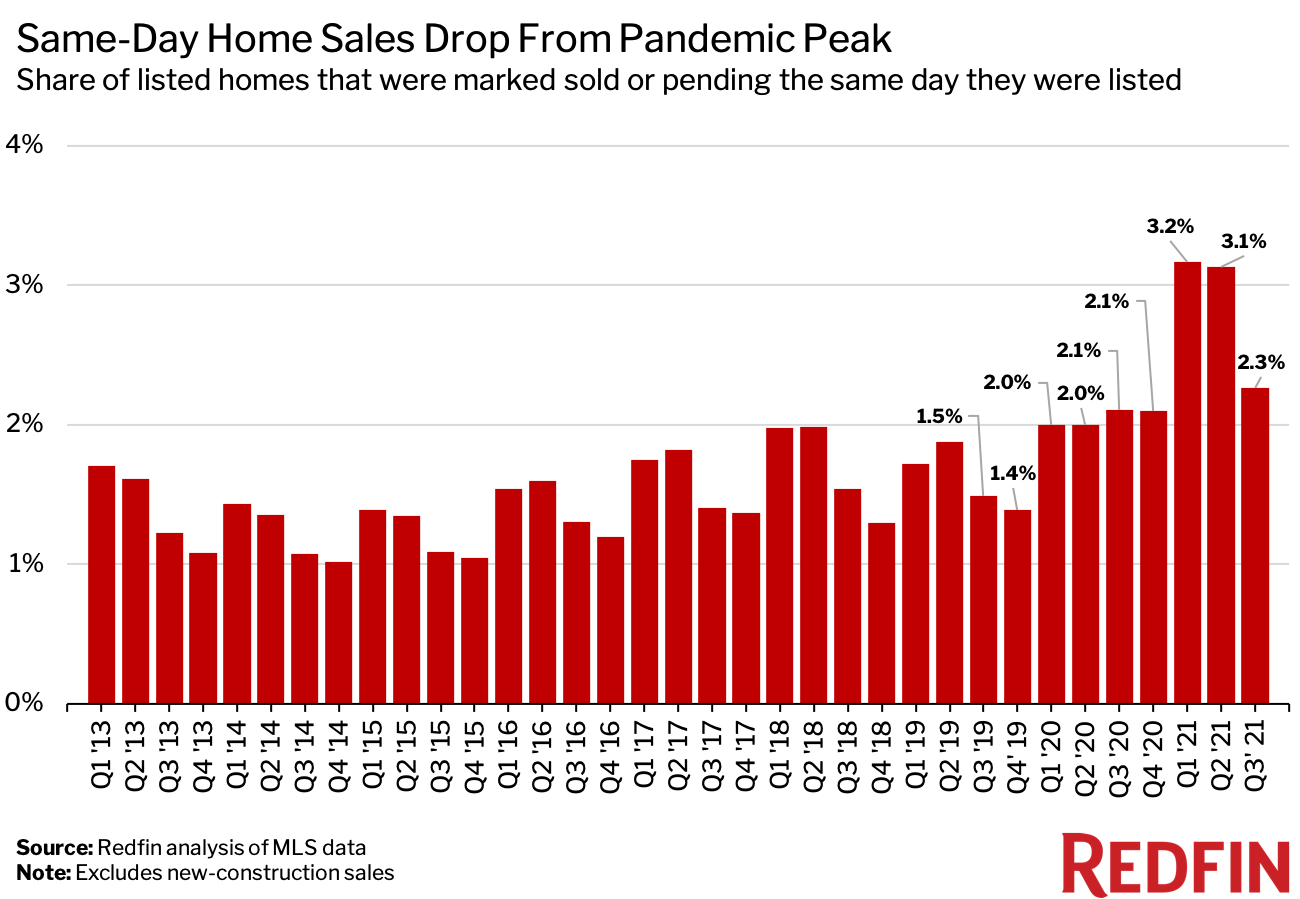
- 2.3% of homes listed in the third quarter were marked sold or pending the same day they were listed—an indicator of a potential pocket listing. That’s up from 1.5% two years earlier.
- Metro areas in Florida and Oklahoma have relatively high rates of estimated pocket listings.
Almost half (43%) of real estate agents believe pocket listings—homes that are sold without being marketed to the public—are more common than they were two years ago.
That’s according to an October 2021 survey of 306 real estate agents from brokerages across the U.S. The survey was conducted by Redfin through Qualtrics.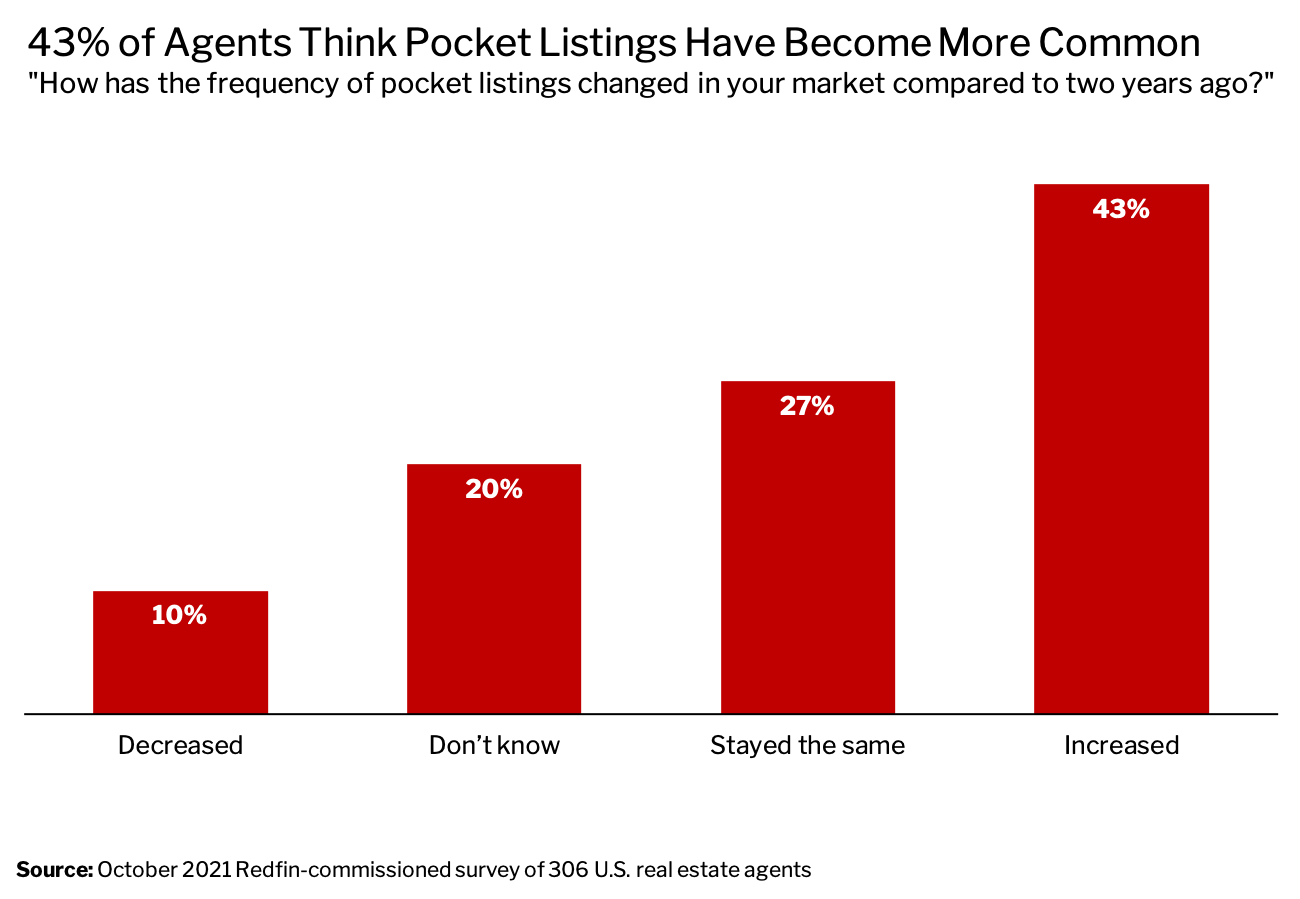
A smaller share of surveyed agents—10%—said pocket listings are less common than they were two years ago, while 27% observed no change and 20% were unsure whether the frequency of pocket listings has changed.
A pocket listing occurs when a real estate agent privately markets a property to a small group of clients rather than sharing it in the multiple listing service (MLS)—the database agents use to publish listings. The National Association of Realtors moved to ban pocket listings in 2019, arguing that they exclude consumers and undermine the trade group’s “commitment to provide equal opportunity to all.” Research has shown that these exclusive listings can disproportionately shut out people of color. Redfin has taken a hard stance against pocket listings and always recommends sellers publish listings online.
The NAR policy, which went into effect in May 2020, requires member agents to submit a listing to their local database within one business day of marketing it publicly. It does not, however, prohibit “office-exclusive listings,” in which brokers withhold for-sale properties from the database, often due to a seller’s privacy concerns.
“Pocket listings remain a common practice; they can exacerbate segregation and wealth inequality because only certain people are seeing certain listings,” said Arnell Brady, a Redfin Mortgage adviser based in Chicago. “Oftentimes, listings that are pocketed are in high-end neighborhoods. That means people who don’t have an agent in the right professional or social network are missing out on bigger gains in home equity, and may be limited to areas with lower home values.”
Pocket Listings Have Declined in Recent Months But Remain More Common Than They Were Pre-Pandemic
Pocket listings are tricky to measure, but Redfin has developed two strategies to identify sales of homes that were likely pocketed: tracking homes that were marked sold or pending the same day they were listed on the MLS, and tracking homes that sold without ever hitting the MLS. A home might sell without hitting the MLS if, for example, the owner sold it to someone they knew or found a buyer through a neighborhood Facebook group.
In the third quarter, 2.3% of homes listed were marked sold or pending on the same day. That’s down from a peak of 3.2% at the start of 2021, but still higher than the 2.1% level we saw in the third quarter of 2020 and the 1.5% level in the third quarter of 2019. Redfin’s same-day sales data goes back to the first quarter of 2012.
A red-hot housing market during the pandemic likely contributed to the rise in same-day sales in the first half of 2021. Low mortgage rates, a surge in relocations due to remote work and a shortage of homes for sale caused houses to sell at a record pace, with many buyers even opting to make purchases sight-unseen. The market has since slowed, which could explain the slight reduction in same-day sales during the third quarter.
“Same-day sales are often correlated with a hot housing market, so the jump and subsequent dip in the share of homes selling the day they’re listed is likely tied to the changing intensity of the market this year,” said Redfin Deputy Chief Economist Taylor Marr. “A fast housing market also increases the incentive for agents to pocket listings rather than deal with scores of showings and offers.”
In Little Rock, AR, same-day sales have become more common, according to local Redfin Team Manager Bonnie Nixon.
“We only used to see same-day sales in highly desirable neighborhoods, but now they are everywhere,” Nixon said. “In a market this hot, some agents find it easier to pocket listings than to market homes publicly. If an agent gets an offer her seller is happy with, she doesn’t have to deal with managing showings and sorting through multiple offers. It’s unfortunate because sellers usually get the best outcome when they get as many offers as possible, which is why I always recommend my sellers put their homes in the MLS to maximize exposure.”
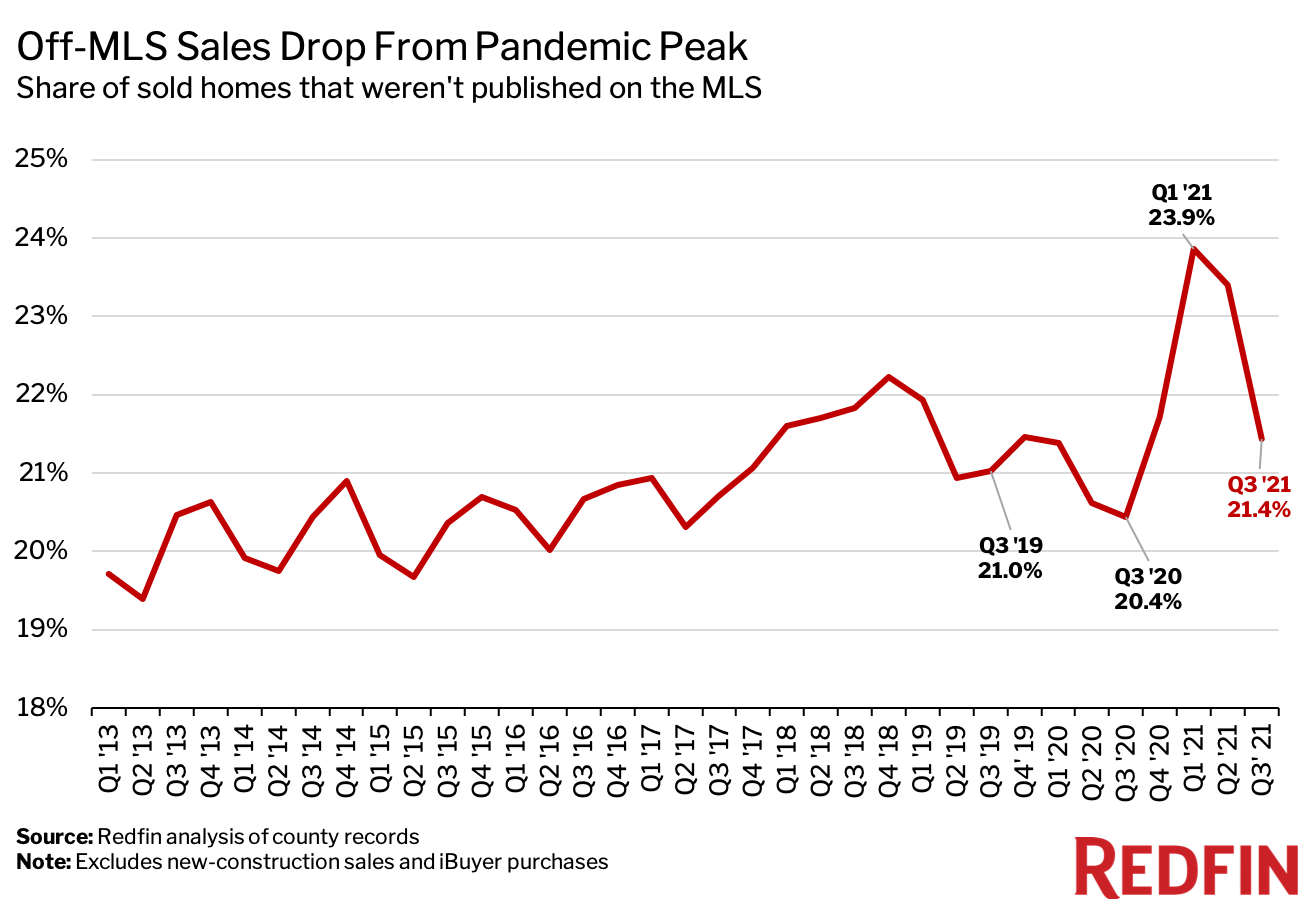
The share of homes that sold without being listed on the MLS—another measure of potential pocket listings—also fell in the third quarter. It dropped to 21.4% from a peak of 23.9% at the start of the year. Still, that’s higher than the 20.4% level we saw in the third quarter of 2020 and the 21% level in the third quarter of 2019. Redfin’s off-MLS sales data goes back to the first quarter of 2012.
Florida Has the Highest Rate of Same-Day Sales
In North Port, FL, 6.8% of listings in the third quarter were marked as sold or pending the same day they were listed for sale—the highest rate of the 96 U.S. metropolitan areas Redfin analyzed. It was followed by Tampa, FL (6.5%), Tulsa, OK (5.6%), Oklahoma City, OK (5.3%) and Indianapolis (5.2%).
Florida’s housing market has soared during the pandemic. Tampa and North Port were both among the 10 most popular destinations for relocating homebuyers in October. North Port also experienced one of the largest housing-supply declines in the country that month.
“Homebuyer demand in Florida has exploded during the pandemic,” said Wendy Peterson, Redfin’s market manager in Tampa. “People who always dreamt of retiring in Florida or buying second homes here were suddenly able to do so thanks to remote work. The breakneck growth in our housing market means some agents are opting to pocket listings as a way to close deals and get paid more quickly.”
Nashville had the lowest share of same-day sales, at 0%. Next came Boston (0.2%), Poughkeepsie, NY (0.2%), Pittsburgh (0.2%) and New Brunswick, NJ (0.3%).
Allentown, PA had the highest rate of off-MLS sales, with 29.1% of sold homes never being listed on the MLS in the third quarter. It was followed by Omaha, NE (28.8%), Bakersfield, CA (27.6%), Birmingham, AL (26.5%) and Newark, NJ (26.4%).
Tacoma, WA had the lowest share of off-MLS sales, at 0.6%. Next came Gary, IN (1.6%), Indianapolis (1.7%), Honolulu, HI (2.9%) and San Jose, CA (7.3%).
Metro-Level Summary: Third Quarter 2021
The list below includes the most populous U.S. metropolitan areas for which there was sufficient same-day sales data. Blank spaces represent places for which there was insufficient off-MLS sales data due to non-disclosure laws.
| U.S. metro area | Share of listings that were marked sold or pending the same day they were listed | Year-over-year change in share of listings that were marked sold or pending the same day they were listed | Share of sold homes that were never listed on an MLS | Year-over-year change in share of sold homes that were never listed on an MLS |
|---|---|---|---|---|
| Akron, OH | 1.1% | -0.3 ppts | 14.2% | -3.4 ppts |
| Albany, NY | 2.1% | -0.9 ppts | 22.1% | 0.7 ppts |
| Albuquerque, NM | 1.0% | -0.4 ppts | — | — |
| Allentown, PA | 1.3% | 0.0 ppts | 29.1% | 2.2 ppts |
| Anaheim, CA | 2.4% | 0.2 ppts | 8.4% | 0.3 ppts |
| Atlanta, GA | 1.1% | 0.2 ppts | 18.9% | 3.7 ppts |
| Austin, TX | 1.0% | -1.7 ppts | — | — |
| Bakersfield, CA | 2.0% | -0.4 ppts | 27.6% | 1.9 ppts |
| Baltimore, MD | 4.5% | 0.5 ppts | 16.5% | 7.8 ppts |
| Baton Rouge, LA | 2.7% | 0.7 ppts | 25.3% | 5.6 ppts |
| Birmingham, AL | 1.5% | 0.2 ppts | 26.5% | 1.1 ppts |
| Boise, ID | 2.0% | -0.3 ppts | — | — |
| Boston, MA | 0.2% | -0.1 ppts | 9.3% | 0.0 ppts |
| Bridgeport, CT | 0.9% | 0.4 ppts | 15.5% | 3.4 ppts |
| Buffalo, NY | 1.8% | -0.2 ppts | 23.0% | -1.0 ppts |
| Camden, NJ | 2.1% | 0.3 ppts | 18.9% | 5.3 ppts |
| Cape Coral, FL | 3.2% | 1.5 ppts | 24.9% | 12.2 ppts |
| Charleston, SC | 3.9% | 1.9 ppts | 16.6% | 4.4 ppts |
| Charlotte, NC | 4.6% | 2.3 ppts | 19.3% | 1.3 ppts |
| Chicago, IL | 1.6% | -0.9 ppts | 15.4% | 8.1 ppts |
| Cincinnati, OH | 2.8% | 0.3 ppts | 20.1% | 0.2 ppts |
| Cleveland, OH | 1.5% | 0.3 ppts | 17.0% | 0.1 ppts |
| Columbus, OH | 3.5% | 0.3 ppts | 16.3% | 0.7 ppts |
| Dallas, TX | 0.4% | -0.2 ppts | — | — |
| Dayton, OH | 4.3% | 1.5 ppts | 16.7% | 1.1 ppts |
| Denver, CO | 2.3% | -0.7 ppts | 12.4% | 1.8 ppts |
| Detroit, MI | 3.8% | 0.7 ppts | 24.6% | 6.6 ppts |
| El Paso, TX | 4.8% | 1.0 ppts | — | — |
| Elgin, IL | 2.0% | -0.8 ppts | 11.3% | 2.7 ppts |
| Fort Lauderdale, FL | 1.1% | 0.4 ppts | 19.4% | 3.6 ppts |
| Fort Worth, TX | 0.4% | -0.1 ppts | — | — |
| Frederick, MD | 2.8% | -0.4 ppts | 13.7% | 4.3 ppts |
| Fresno, CA | 2.6% | 0.3 ppts | 18.0% | 4.2 ppts |
| Gary, IN | 0.8% | 0.5 ppts | 1.6% | -0.7 ppts |
| Grand Rapids, MI | 3.3% | 0.1 ppts | 21.3% | 2.5 ppts |
| Greenville, SC | 1.0% | 0.4 ppts | 24.6% | 1.3 ppts |
| Hartford, CT | 0.3% | -0.1 ppts | 17.0% | 2.1 ppts |
| Honolulu, HI | 1.1% | 0.4 ppts | 2.9% | 0.1 ppts |
| Houston, TX | 2.3% | 0.4 ppts | — | — |
| Indianapolis, IN | 5.2% | 0.0 ppts | 1.7% | -0.5 ppts |
| Jacksonville, FL | 4.0% | 2.0 ppts | 20.3% | 3.1 ppts |
| Kansas City, MO | 3.2% | -1.1 ppts | — | — |
| Knoxville, TN | 0.8% | -0.2 ppts | 24.4% | 1.2 ppts |
| Lake County, IL | 1.9% | -0.4 ppts | 15.7% | 6.0 ppts |
| Las Vegas, NV | 2.4% | 1.1 ppts | 11.2% | 2.2 ppts |
| Little Rock, AR | 4.7% | 0.2 ppts | 24.6% | 4.3 ppts |
| Los Angeles, CA | 2.0% | -0.2 ppts | 11.4% | 1.4 ppts |
| Louisville, KY | 2.5% | -0.3 ppts | 19.5% | 0.8 ppts |
| McAllen, TX | 1.2% | 0.3 ppts | — | — |
| Memphis, TN | 3.2% | -0.2 ppts | 24.0% | 1.5 ppts |
| Miami, FL | 1.4% | 0.8 ppts | 24.0% | 7.8 ppts |
| Milwaukee, WI | 0.3% | -0.1 ppts | 18.7% | 2.3 ppts |
| Minneapolis, MN | 2.6% | 0.3 ppts | 12.4% | 1.9 ppts |
| Montgomery County, PA | 2.3% | -0.2 ppts | 17.8% | 4.9 ppts |
| Nashville, TN | 0.0% | -1.0 ppts | 17.6% | 3.5 ppts |
| Nassau County, NY | 0.4% | -0.5 ppts | 25.4% | -1.8 ppts |
| New Brunswick, NJ | 0.3% | -0.2 ppts | 20.9% | 4.4 ppts |
| New Haven, CT | 0.4% | 0.1 ppts | 17.3% | 3.4 ppts |
| New Orleans, LA | 3.2% | -0.2 ppts | 22.1% | 1.7 ppts |
| New York, NY | 1.0% | 0.8 ppts | 20.6% | 2.7 ppts |
| Newark, NJ | 0.5% | 0.1 ppts | 26.4% | 4.3 ppts |
| North Port, FL | 6.8% | 3.2 ppts | 20.7% | 6.0 ppts |
| Oakland, CA | 2.9% | -0.7 ppts | 9.8% | 1.2 ppts |
| Oklahoma City, OK | 5.3% | 0.1 ppts | 22.4% | 4.0 ppts |
| Omaha, NE | 3.5% | -0.1 ppts | 28.8% | 2.2 ppts |
| Orlando, FL | 3.8% | 0.8 ppts | 14.9% | 1.1 ppts |
| Oxnard, CA | 1.3% | 0.1 ppts | 9.1% | 1.7 ppts |
| Philadelphia, PA | 2.5% | 0.1 ppts | 19.4% | 0.2 ppts |
| Phoenix, AZ | 1.9% | 0.1 ppts | 14.6% | 1.4 ppts |
| Pittsburgh, PA | 0.2% | 0.1 ppts | 12.5% | -5.9 ppts |
| Portland, OR | 1.4% | -0.5 ppts | 8.8% | 0.5 ppts |
| Poughkeepsie, NY | 0.2% | -0.2 ppts | 26.1% | -6.0 ppts |
| Providence, RI | 3.3% | 1.1 ppts | 12.8% | 1.9 ppts |
| Raleigh, NC | 1.3% | 0.3 ppts | 15.7% | 3.6 ppts |
| Richmond, VA | 1.2% | -1.0 ppts | 13.7% | 0.2 ppts |
| Riverside, CA | 1.8% | 0.1 ppts | 13.1% | -0.6 ppts |
| Rochester, NY | 0.5% | -0.4 ppts | 17.9% | -10.4 ppts |
| Sacramento, CA | 0.4% | -0.4 ppts | 12.2% | 2.1 ppts |
| Salt Lake City, UT | 0.8% | 0.2 ppts | — | — |
| San Antonio, TX | 1.2% | 0.3 ppts | — | — |
| San Diego, CA | 1.8% | 0.1 ppts | 10.0% | 0.7 ppts |
| San Francisco, CA | 2.2% | -2.0 ppts | 12.9% | 3.1 ppts |
| San Jose, CA | 1.5% | -0.8 ppts | 7.3% | 0.0 ppts |
| Seattle, WA | 3.9% | 0.0 ppts | 7.8% | 0.5 ppts |
| St. Louis, MO | 1.6% | -0.2 ppts | 11.5% | 5.8 ppts |
| Stockton, CA | 0.3% | -0.7 ppts | 15.2% | 3.3 ppts |
| Tacoma, WA | 3.6% | -1.0 ppts | 0.6% | 0.2 ppts |
| Tampa, FL | 6.5% | 2.5 ppts | 16.1% | 0.6 ppts |
| Tucson, AZ | 1.0% | 0.3 ppts | 20.3% | 3.9 ppts |
| Tulsa, OK | 5.6% | 1.3 ppts | 20.5% | 2.1 ppts |
| Virginia Beach, VA | 1.5% | 0.2 ppts | 19.3% | -2.9 ppts |
| Warren, MI | 2.1% | 0.0 ppts | 17.2% | 1.0 ppts |
| Washington, D.C. | 3.1% | -0.7 ppts | 11.2% | -1.4 ppts |
| West Palm Beach, FL | 1.8% | 0.7 ppts | 17.3% | 3.1 ppts |
| Wilmington, DE | 3.7% | -1.8 ppts | 16.0% | 1.3 ppts |
| Worcester, MA | 0.3% | 0.0 ppts | 8.5% | 0.1 ppts |


