
Historic competition for homes pushed sale prices up 14% as new listings fell 16%.
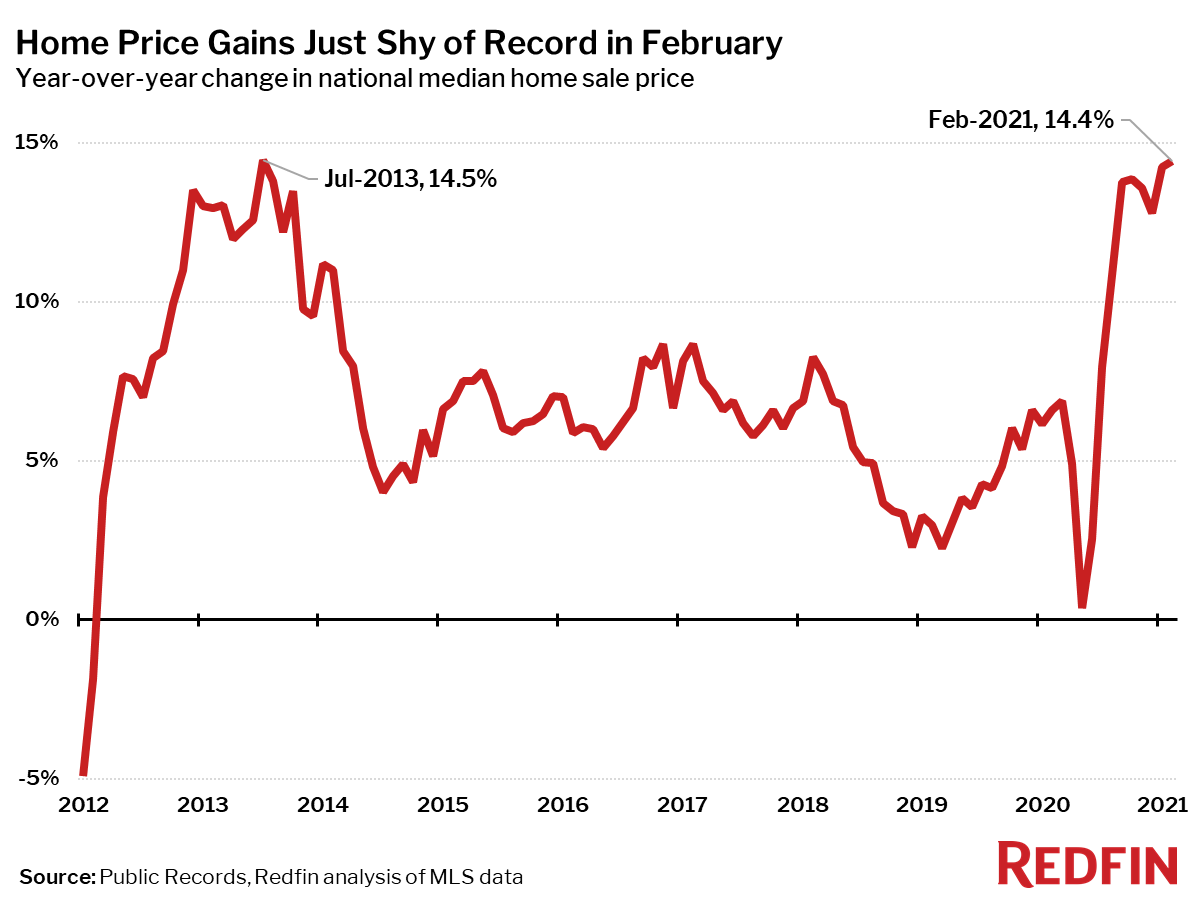
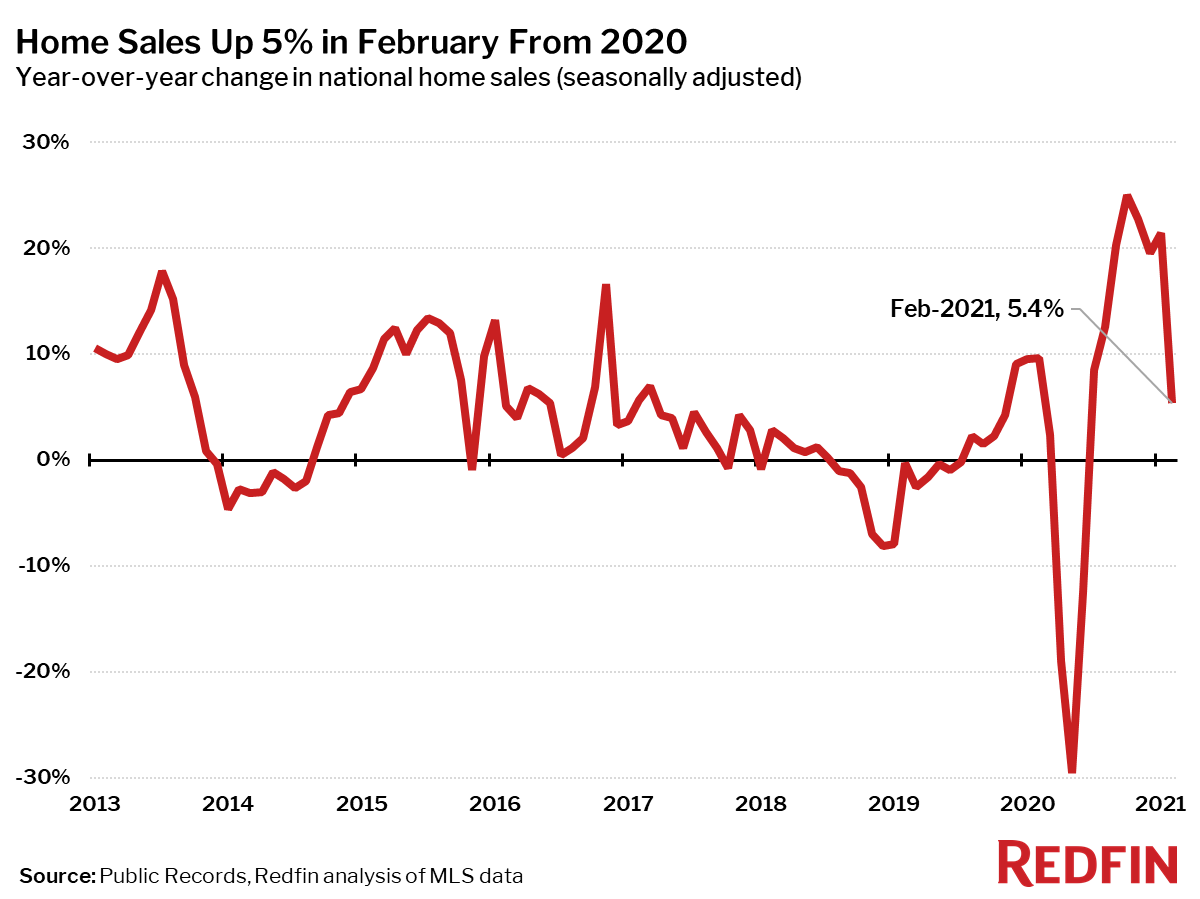
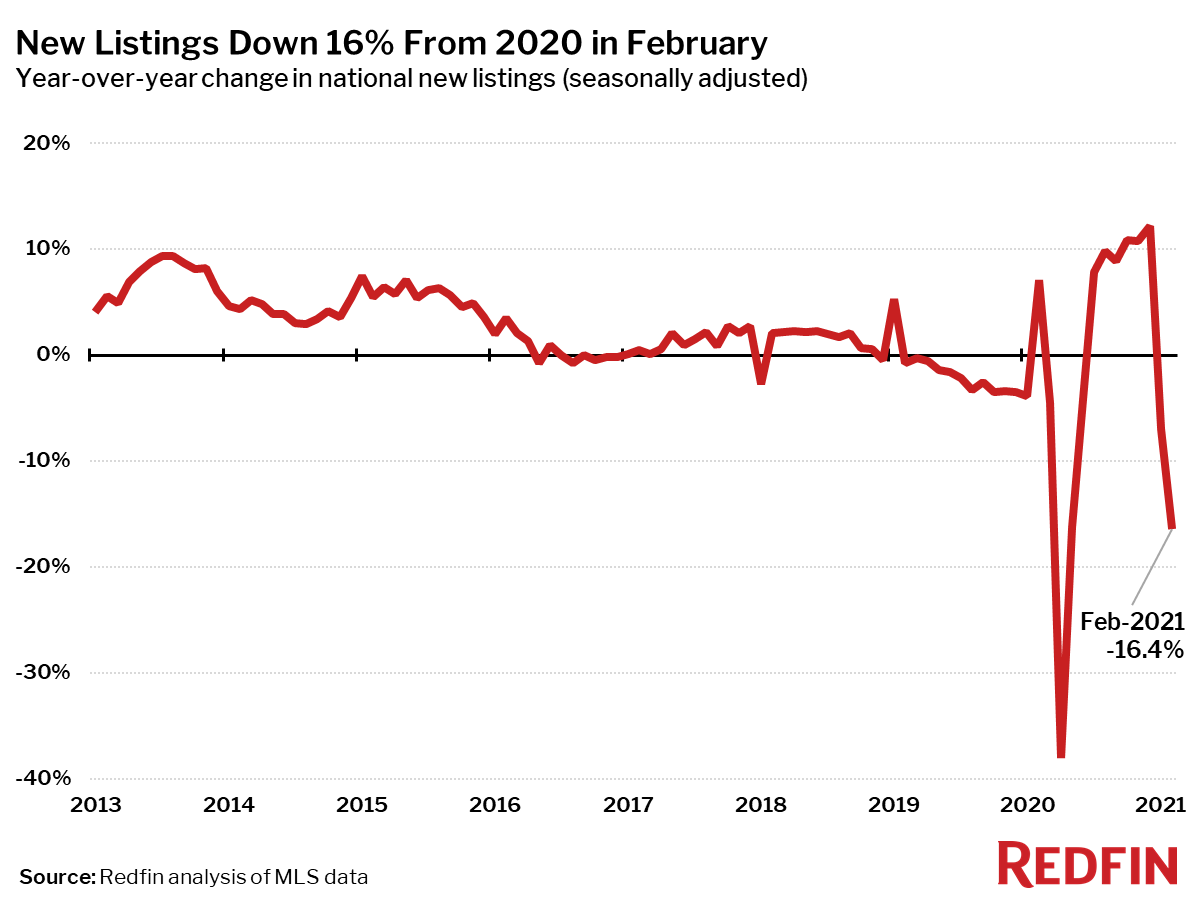
The national median home-sale price rose 14.4% year over year to $336,200 in February, the largest increase seen since July 2013. Closed home sales were up 5% from a year earlier and pending sales were up 21%. New listings fell 16%—the second-largest decline on record since Redfin’s data began in 2012, only passed by the drop in April 2020.
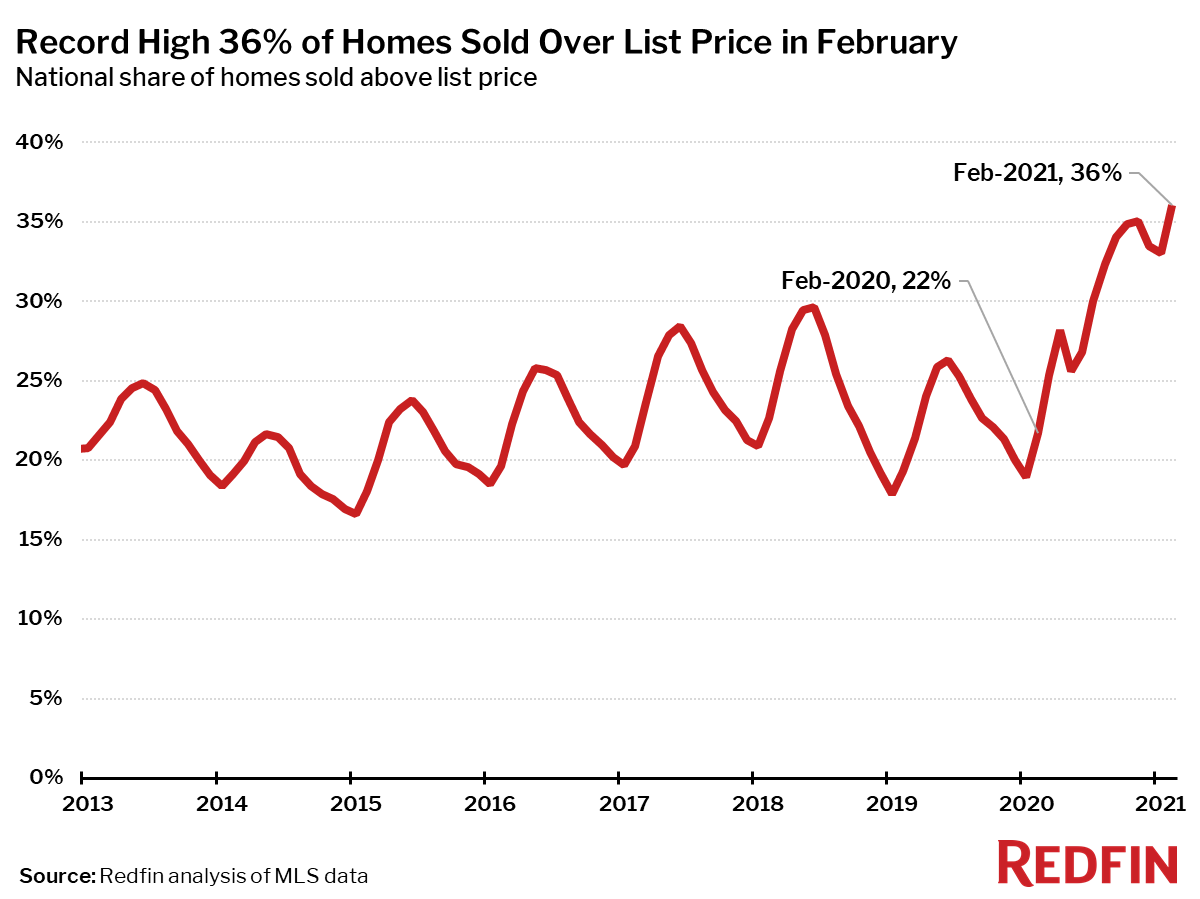
The shortage of homes for sale is making homebuyer competition more intense than we’ve ever seen; 36% of homes sold last month went for more than their asking price, the largest share on record. This extreme imbalance between supply and demand is the primary factor rapidly driving up home prices.
“This is the strongest seller’s market since at least 2006,” said Redfin Chief Economist Daryl Fairweather. “Buyers outnumber sellers by such a huge margin that many homeowners are staying put because they know how hard it would be to find a place to move to. It seems like the only move-up buyers who are confident enough to list their homes are those who are relocating to a more affordable area where they’ll have an edge on the local competition.”
Median sale prices increased from a year earlier in all but one of the 85 largest metro areas Redfin tracks. The only place prices didn’t increase was San Francisco, where they were flat from a year ago. The largest price increases were in Bridgeport, CT (+31%), New Haven, CT (+31%) and Camden, NJ (+24%).
“Even though the market feels reminiscent of 2006, we aren’t in a bubble,” continued Fairweather. “Yes, some buyers are overpaying for homes, particularly those who are moving to affordable destinations and paying well over asking prices to win homes in bidding wars. But these buyers are often covering any shortfall in the bank’s appraisal amount and locking in low monthly mortgage payments that they can easily afford. As mortgage rates rise, I expect demand to settle down and be better balanced by more new listings as high home prices lure more sellers to the market.”
| Market Summary | February 2021 | Month-Over-Month | Year-Over-Year |
|---|---|---|---|
| Median sale price | $336,200 | 1.7% | 14.4% |
| Homes sold, seasonally-adjusted | 627,400 | -3.6% | 5.4% |
| Pending sales, seasonally-adjusted | 589,300 | -7.7% | 20.9% |
| New listings, seasonally-adjusted | 564,900 | -0.2% | -16.4% |
| All Homes for sale, seasonally-adjusted | 1,548,700 | -2.1% | -27.4% |
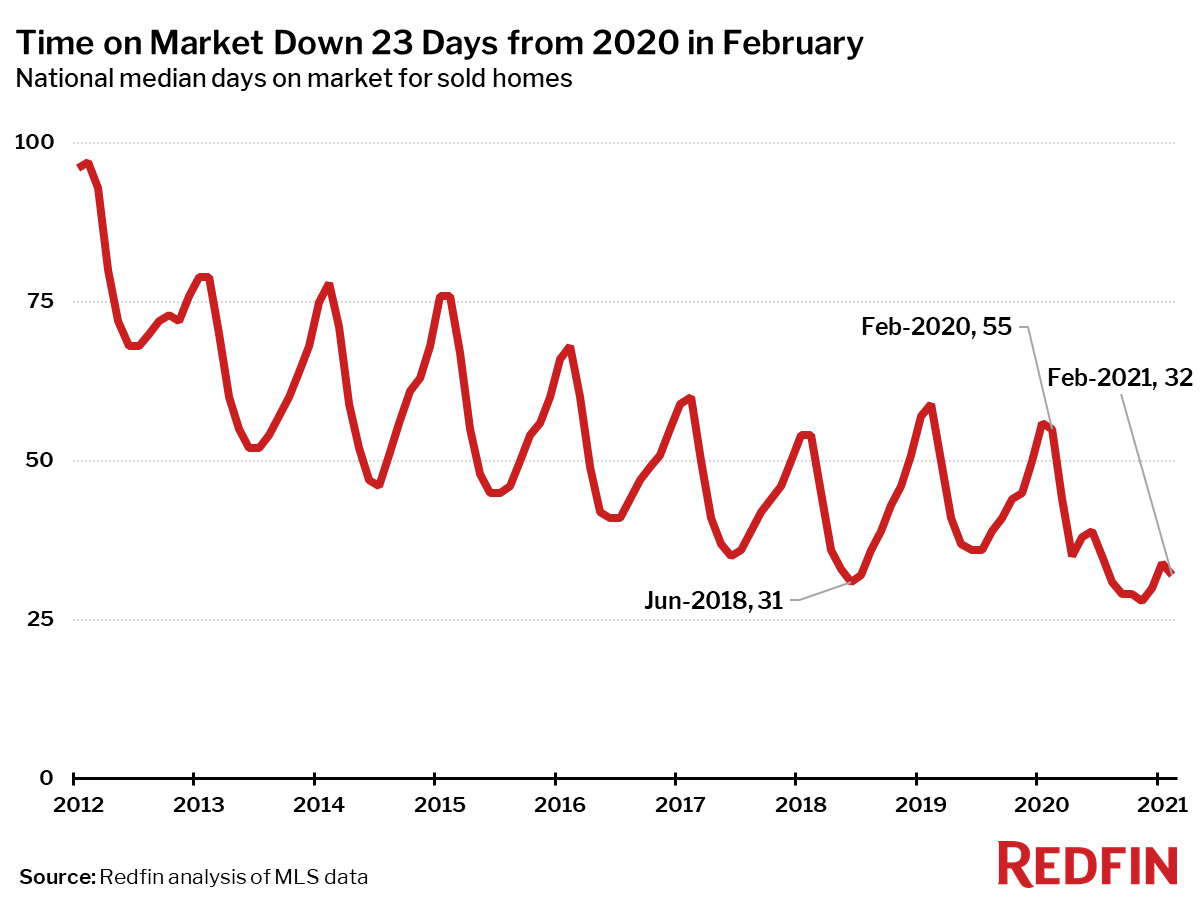
| Median days on market | 32 | -2 | -23 |
| Months of supply | 1.5 | -0.2 | -1.6 |
| Sold above list | 36.1% | 3.1 pts† | 14.4 pts† |
| Median Off-Market Redfin Estimate | $337,400 | 3.4% | 13.4% |
| Average Sale-to-list | 99.8% | 0.4 pts† | 1.7 pts† |
| Average 30-year fixed mortgage rate | 2.81% | 0.07 pts† | -0.66 pts† |
In some parts of the country extreme winter storms in February put a damper on home sales, which were up 5% from a year earlier on a seasonally-adjusted basis. This was a steep drop from the 21% gain in January, and the smallest increase since June.
The number of homes sold in February was up from a year earlier in most of the 85 largest metro areas Redfin tracks, but 21 metros did see declines. The largest gains in sales were in Bridgeport, CT (+38%), San Jose, CA (+33%) and Baton Rouge (26%). The metro areas where home sales fell the most were Austin, TX (-15%), McAllen, TX (-13%) and Salt Lake City (-13%). Home sale declines in Texas were likely due to escrow delays from the unusually intense winter storm that swept through the state in February.
Active listings—the count of all homes that were for sale at any time during the month—fell 27% year over year to their lowest level on record. February’s supply decline marked the largest annual decline on record and the 19th-straight month of declines.
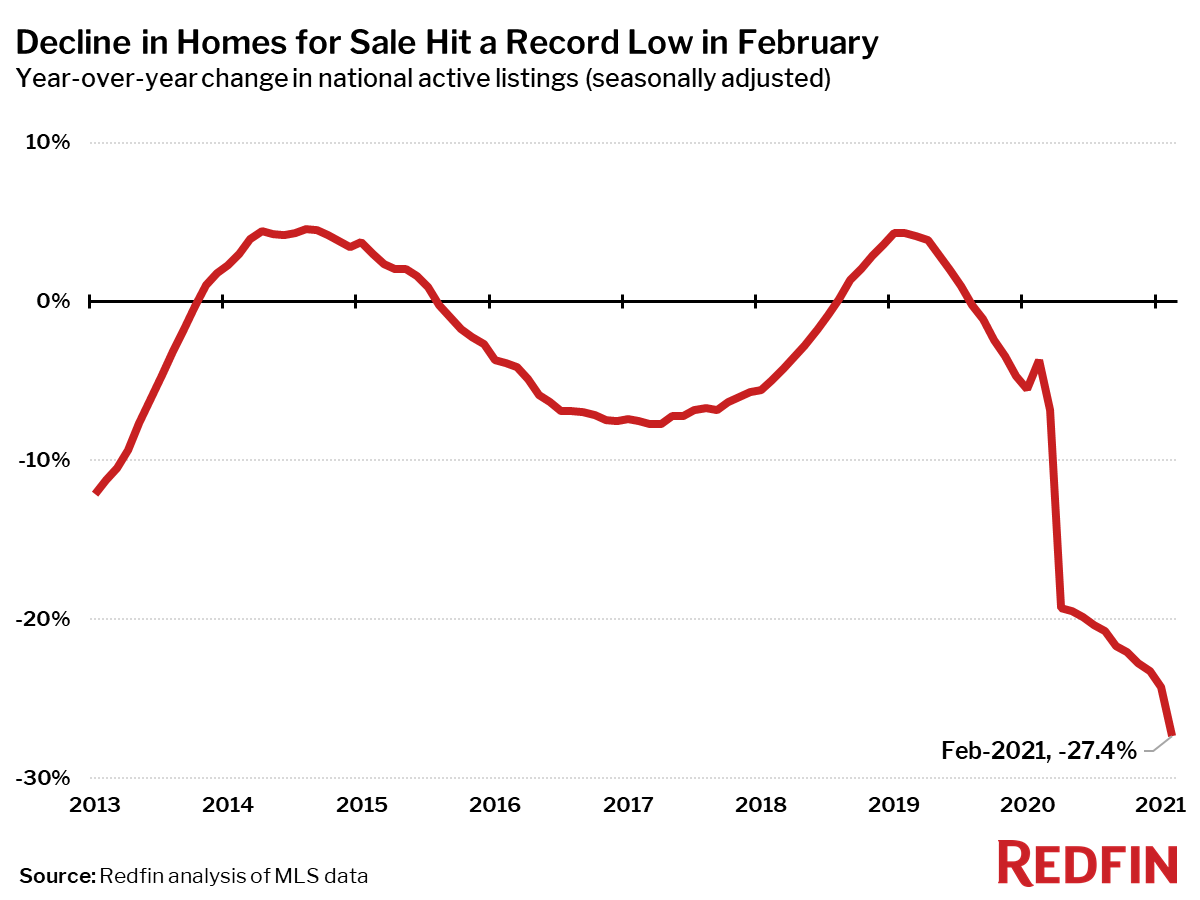
Only two of the 85 largest metros tracked by Redfin posted a year-over-year increase in the count of seasonally-adjusted active listings of homes for sale: San Francisco (+22%) and San Jose, CA (+20%).
The biggest year-over-year declines in active housing supply in January were in Salt Lake City (-67%), Allentown, PA (-60%) and Baton Rouge, LA (-58%).
New listings of homes for sale fell 16% in February from a year earlier, the second-largest decline on record, only exceeded by April 2020 in the midst of the pandemic. Despite this shortage of new listings of homes for sale, pending sales were still up 21% from 2020.
The housing market became more competitive in February, as time on market fell and the share of homes sold above list price increased.
The typical home that sold in February went under contract in 32 days—23 days fewer than a year earlier.
In February, 36% of homes sold above list price, the highest level on record. Given the typical seasonal pattern, this measure is likely to continue hitting new record highs through at least the first half of the year.
Other February Highlights
Competition
- Denver and Tacoma, WA were the fastest markets, with half of all homes pending sale in just 5 days in both metros. Seattle was the next fastest market with 6 median days on market, followed by Sacramento, CA (8) and Portland, OR (8).
- The most competitive market in February was Oakland, CA where 70.5% of homes sold above list price, followed by 66.6% in San Jose, CA, 65.7% in Tacoma, WA, 62.3% in Sacramento, CA, and 57.3% in Austin, TX.
Prices
- Bridgeport, CT had the nation’s highest price growth, rising 30.6% since last year to $470,000. New Haven, CT had the second highest growth at 30.5% year-over-year price growth, followed by Camden, NJ (23.8%), Pittsburgh (23.5%), and West Palm Beach, FL (22.8%).
- No metros saw price declines in February.
Sales
- Bridgeport, CT led the nation in year-over-year sales growth, up 37.9%, followed by San Jose, CA, up 32.5%. Baton Rouge, LA rounded out the top three with sales up 26.1% from a year ago.
- Austin, TX saw the largest decline in sales since last year, falling 15.0%. Home sales in McAllen, TX and Salt Lake City declined by 13.5% and 12.7%, respectively.
Inventory
- San Francisco had the highest increase in the number of homes for sale, up 21.7% year over year, followed by San Jose, CA (20.0%). No other metro areas saw an increase in homes for sale.
- Salt Lake City had the largest decrease in overall active listings, falling 66.7% since last February. Allentown, PA (-59.9%), Baton Rouge, LA (-58.3%), and Elgin, IL (-53.9%) also saw far fewer homes available on the market than a year ago.
Redfin Estimate
- Miami (89.1%) had the largest share of homes predicted to sell for below list price, according to Redfin Estimate data, followed by West Palm Beach, FL (85.4%) and Fort Lauderdale, FL (84.1%).
- Oakland, CA (92.0%) had the largest share of homes predicted to sell at or above list price, followed by San Jose, CA (88.5%) and Tacoma, WA (81.2%).
Below are market-by-market breakdowns for prices, inventory, new listings and sales for markets with populations of 750,000 or more. For downloadable data on all of the markets Redfin tracks, visit the Redfin Data Center. Refer to our metrics definition page for explanations of all the metrics used in this report.
Median Sale Price
| Redfin Metro | Median Sale Price | Month-Over-Month | Year-Over-Year |
|---|---|---|---|
| Albany, NY | $225,500 | 0.2% | 12.7% |
| Allentown, PA | $234,500 | -0.4% | 15.0% |
| Anaheim, CA | $830,000 | 4.3% | 11.4% |
| Atlanta, GA | $286,000 | 2.9% | 14.4% |
| Austin, TX | $399,000 | 7.8% | 22.8% |
| Bakersfield, CA | $280,000 | -1.8% | 12.0% |
| Baltimore, MD | $300,000 | 0.8% | 11.3% |
| Baton Rouge, LA | $230,600 | 4.5% | 12.8% |
| Birmingham, AL | $239,000 | 5.1% | 11.2% |
| Boston, MA | $550,000 | -1.3% | 11.1% |
| Bridgeport, CT | $470,000 | 0.0% | 30.6% |
| Buffalo, NY | $170,000 | -0.6% | 14.9% |
| Camden, NJ | $235,000 | -2.1% | 23.8% |
| Charleston, SC | $333,800 | 4.3% | 12.4% |
| Charlotte, NC | $300,000 | 1.7% | 12.1% |
| Chicago, IL | $275,000 | 1.5% | 12.7% |
| Cincinnati, OH | $210,000 | 2.4% | 18.6% |
| Cleveland, OH | $157,000 | -4.8% | 7.5% |
| Columbus, OH | $238,000 | 1.1% | 9.7% |
| Dallas, TX | $335,000 | 6.0% | 16.3% |
| Dayton, OH | $152,200 | -0.4% | 12.8% |
| Denver, CO | $472,000 | 3.7% | 11.1% |
| Detroit, MI | $151,200 | -2.4% | 16.6% |
| El Paso, TX | $188,000 | 1.7% | 11.9% |
| Elgin, IL | $241,300 | -5.4% | 11.2% |
| Fort Lauderdale, FL | $315,000 | -1.6% | 14.8% |
| Fort Worth, TX | $285,000 | 5.6% | 16.3% |
| Frederick, MD | $430,000 | -3.4% | 9.8% |
| Fresno, CA | $340,000 | 7.3% | 21.4% |
| Grand Rapids, MI | $244,900 | 7.0% | 14.4% |
| Greensboro, NC | $188,400 | -7.0% | 5.4% |
| Greenville, SC | $245,000 | 3.3% | 14.0% |
| Hartford, CT | $250,000 | -1.2% | 17.4% |
| Houston, TX | $275,000 | 4.8% | 11.3% |
| Indianapolis, IN | $220,000 | 4.8% | 15.9% |
| Jacksonville, FL | $261,900 | 2.3% | 9.1% |
| Kansas City, MO | $248,000 | 1.2% | 12.7% |
| Knoxville, TN | $250,000 | 0.0% | 16.3% |
| Lake County, IL | $255,000 | -4.7% | 11.8% |
| Las Vegas, NV | $330,000 | 2.8% | 11.9% |
| Los Angeles, CA | $745,000 | 3.5% | 17.1% |
| Louisville, KY | $215,000 | 0.0% | 12.4% |
| McAllen, TX | $182,000 | 3.2% | 5.5% |
| Memphis, TN | $205,400 | -4.5% | 9.3% |
| Miami, FL | $377,500 | 0.7% | 18.0% |
| Milwaukee, WI | $234,000 | 4.0% | 12.3% |
| Minneapolis, MN | $315,000 | 4.2% | 11.3% |
| Montgomery County, PA | $350,000 | -2.8% | 9.4% |
| Nashville, TN | $337,100 | 3.4% | 12.4% |
| Nassau County, NY | $538,000 | 0.1% | 18.2% |
| New Brunswick, NJ | $376,000 | -0.5% | 21.3% |
| New Haven, CT | $248,000 | 1.2% | 30.5% |
| New Orleans, LA | $253,500 | 1.4% | 12.2% |
| New York, NY | $590,000 | -0.8% | 3.5% |
| Newark, NJ | $410,000 | -3.5% | 17.3% |
| North Port, FL | $329,000 | 1.2% | 15.8% |
| Oakland, CA | $825,000 | 3.1% | 17.3% |
| Oklahoma City, OK | $213,000 | 2.2% | 13.3% |
| Omaha, NE | $240,000 | 8.1% | 15.9% |
| Orlando, FL | $299,000 | 4.2% | 12.8% |
| Oxnard, CA | $699,900 | -1.4% | 15.7% |
| Philadelphia, PA | $238,000 | 0.2% | 9.7% |
| Phoenix, AZ | $355,000 | 2.9% | 18.5% |
| Pittsburgh, PA | $197,000 | 1.2% | 23.5% |
| Portland, OR | $465,000 | 3.3% | 14.5% |
| Providence, RI | $325,000 | -1.5% | 15.1% |
| Raleigh, NC | $320,000 | 2.6% | 6.7% |
| Richmond, VA | $300,000 | 7.1% | 20.0% |
| Riverside, CA | $460,000 | 3.4% | 17.9% |
| Rochester, NY | $156,400 | -3.2% | 15.2% |
| Sacramento, CA | $490,000 | 3.6% | 16.7% |
| Salt Lake City, UT | $415,000 | 5.1% | 16.9% |
| San Antonio, TX | $263,000 | 3.3% | 11.7% |
| San Diego, CA | $685,000 | 5.1% | 14.2% |
| San Francisco, CA | $1,400,000 | 4.5% | 0.0% |
| San Jose, CA | $1,205,000 | 0.4% | 7.1% |
| Seattle, WA | $655,000 | 4.6% | 13.9% |
| St. Louis, MO | $204,400 | 2.2% | 18.8% |
| Tacoma, WA | $460,000 | 4.5% | 15.0% |
| Tampa, FL | $278,000 | 2.6% | 15.9% |
| Tucson, AZ | $269,000 | -0.4% | 12.6% |
| Tulsa, OK | $208,800 | 2.4% | 14.4% |
| Urban Honolulu, HI | $636,500 | 1.0% | 7.0% |
| Virginia Beach, VA | $259,000 | -0.4% | 9.3% |
| Warren, MI | $227,000 | -0.9% | 8.1% |
| Washington, DC | $448,000 | 1.8% | 6.8% |
| West Palm Beach, FL | $350,000 | 1.7% | 22.8% |
| Worcester, MA | $300,000 | -7.7% | 17.6% |
| National | $336,200 | 1.7% | 14.4% |
Homes Sold
| Redfin Metro | Homes Sold | Month-Over-Month | Year-Over-Year |
|---|---|---|---|
| Albany, NY | 708 | -11.5% | 25.8% |
| Allentown, PA | 556 | -19.7% | -12.2% |
| Anaheim, CA | 2,289 | 0.9% | 12.0% |
| Atlanta, GA | 7,615 | 6.9% | 1.4% |
| Austin, TX | 2,203 | -6.8% | -15.0% |
| Bakersfield, CA | 673 | -4.3% | 18.1% |
| Baltimore, MD | 3,033 | -1.5% | 14.4% |
| Baton Rouge, LA | 903 | 9.6% | 26.1% |
| Birmingham, AL | 1,184 | 3.0% | 1.6% |
| Boston, MA | 2,497 | -25.0% | 5.4% |
| Bridgeport, CT | 932 | -21.2% | 37.9% |
| Buffalo, NY | 756 | -19.1% | 14.2% |
| Camden, NJ | 1,318 | -10.0% | 5.0% |
| Charleston, SC | 1,492 | 17.4% | 21.7% |
| Charlotte, NC | 3,250 | 2.0% | 5.1% |
| Chicago, IL | 6,144 | -2.0% | 14.6% |
| Cincinnati, OH | 1,990 | 2.6% | -0.5% |
| Cleveland, OH | 1,834 | -1.8% | 2.1% |
| Columbus, OH | 1,827 | -1.0% | -6.1% |
| Dallas, TX | 4,320 | 1.4% | -10.0% |
| Dayton, OH | 753 | -1.6% | -0.4% |
| Denver, CO | 3,893 | 24.4% | 5.9% |
| Detroit, MI | 1,382 | -0.6% | -4.0% |
| El Paso, TX | 717 | -0.1% | 16.2% |
| Elgin, IL | 689 | -2.1% | 8.8% |
| Fort Lauderdale, FL | 2,879 | 8.4% | 20.0% |
| Fort Worth, TX | 2,063 | -1.3% | -10.0% |
| Frederick, MD | 1,264 | 4.5% | 13.3% |
| Fresno, CA | 554 | -13.6% | -2.3% |
| Grand Rapids, MI | 851 | -7.9% | -10.3% |
| Greensboro, NC | 792 | 7.9% | 14.6% |
| Greenville, SC | 951 | 1.5% | 3.5% |
| Hartford, CT | 1,005 | -16.7% | 10.8% |
| Houston, TX | 6,163 | -0.8% | -0.9% |
| Indianapolis, IN | 2,223 | 10.0% | 5.3% |
| Jacksonville, FL | 2,421 | 11.1% | 9.3% |
| Kansas City, MO | 2,185 | -4.4% | 4.7% |
| Knoxville, TN | 987 | -1.2% | 7.8% |
| Lake County, IL | 857 | 6.2% | 21.9% |
| Las Vegas, NV | 3,588 | 7.8% | 15.2% |
| Los Angeles, CA | 5,047 | -3.3% | 15.2% |
| Louisville, KY | 1,016 | -5.0% | 4.3% |
| McAllen, TX | 231 | -23.3% | -13.5% |
| Memphis, TN | 839 | -0.9% | -6.6% |
| Miami, FL | 2,528 | 4.4% | 23.0% |
| Milwaukee, WI | 1,105 | -8.8% | -2.7% |
| Minneapolis, MN | 3,293 | -5.5% | 5.4% |
| Montgomery County, PA | 1,428 | -21.9% | 0.4% |
| Nashville, TN | 2,772 | 5.3% | -0.7% |
| Nassau County, NY | 2,454 | -13.7% | 20.7% |
| New Brunswick, NJ | 2,424 | -19.6% | 13.4% |
| New Haven, CT | 751 | -17.3% | 18.1% |
| New Orleans, LA | 1,140 | 4.0% | 13.0% |
| New York, NY | 5,268 | -10.6% | 16.4% |
| Newark, NJ | 1,713 | -14.6% | 14.7% |
| North Port, FL | 2,195 | 13.3% | 25.3% |
| Oakland, CA | 1,839 | -3.1% | 24.3% |
| Oklahoma City, OK | 1,523 | -0.5% | -1.4% |
| Omaha, NE | 744 | -9.7% | -8.9% |
| Orlando, FL | 3,848 | 12.9% | 16.6% |
| Oxnard, CA | 596 | -1.3% | 13.7% |
| Philadelphia, PA | 1,785 | -8.2% | 7.2% |
| Phoenix, AZ | 7,698 | 8.5% | 5.8% |
| Pittsburgh, PA | 1,493 | -10.6% | -5.9% |
| Portland, OR | 2,661 | 6.7% | 5.2% |
| Providence, RI | 1,289 | -16.0% | 3.3% |
| Raleigh, NC | 1,973 | 2.4% | 1.9% |
| Richmond, VA | 1,227 | -8.9% | 0.4% |
| Riverside, CA | 4,246 | -4.8% | 11.6% |
| Rochester, NY | 630 | -26.4% | -5.7% |
| Sacramento, CA | 2,003 | -4.4% | 5.6% |
| Salt Lake City, UT | 1,058 | 0.2% | -12.7% |
| San Antonio, TX | 2,160 | -8.6% | -9.3% |
| San Diego, CA | 2,645 | 6.7% | 9.0% |
| San Francisco, CA | 789 | -4.0% | 25.6% |
| San Jose, CA | 1,084 | 8.5% | 32.5% |
| Seattle, WA | 3,100 | 7.9% | 5.0% |
| St. Louis, MO | 2,594 | -3.8% | 3.7% |
| Tacoma, WA | 992 | 4.2% | 10.5% |
| Tampa, FL | 5,111 | 13.3% | 8.0% |
| Tucson, AZ | 1,419 | 8.3% | 5.2% |
| Tulsa, OK | 954 | -4.7% | 7.6% |
| Urban Honolulu, HI | 696 | 2.2% | 25.0% |
| Virginia Beach, VA | 2,020 | 0.0% | 11.7% |
| Warren, MI | 2,536 | -5.8% | 3.5% |
| Washington, DC | 5,146 | 8.4% | 14.1% |
| West Palm Beach, FL | 2,808 | 6.0% | 16.2% |
| Worcester, MA | 681 | -15.9% | 2.6% |
| National | 627,400 | -3.6% | 5.4% |
New Listings
| Redfin Metro | New Listings | Month-Over-Month | Year-Over-Year |
|---|---|---|---|
| Albany, NY | 661 | 3.1% | -17.2% |
| Allentown, PA | 302 | -37.2% | -62.9% |
| Anaheim, CA | 2,848 | 9.9% | -3.5% |
| Atlanta, GA | 8,668 | 3.6% | -8.3% |
| Austin, TX | 2,468 | -9.4% | -24.0% |
| Bakersfield, CA | 777 | -7.3% | -12.3% |
| Baltimore, MD | 3,349 | 2.9% | -13.1% |
| Baton Rouge, LA | 499 | -27.7% | -53.8% |
| Birmingham, AL | 1,128 | -3.3% | -23.3% |
| Boston, MA | 3,737 | 14.4% | -14.9% |
| Bridgeport, CT | 1,139 | -1.1% | -27.8% |
| Buffalo, NY | 674 | -1.5% | -19.5% |
| Camden, NJ | 1,499 | -0.5% | -21.9% |
| Charleston, SC | 1,548 | 6.8% | -11.4% |
| Charlotte, NC | 2,406 | -19.6% | -41.9% |
| Chicago, IL | 8,177 | 4.0% | -27.2% |
| Cincinnati, OH | 2,154 | -2.8% | -15.5% |
| Cleveland, OH | 2,166 | 13.7% | -9.8% |
| Columbus, OH | 1,931 | -4.3% | -12.8% |
| Dallas, TX | 4,516 | -19.7% | -34.8% |
| Dayton, OH | 819 | 3.1% | -16.0% |
| Denver, CO | 4,215 | 4.4% | -7.7% |
| Detroit, MI | 1,481 | -7.3% | -24.5% |
| El Paso, TX | 954 | 11.8% | -0.7% |
| Elgin, IL | 834 | 3.5% | -29.9% |
| Fort Lauderdale, FL | 3,297 | -7.4% | -14.8% |
| Fort Worth, TX | 2,130 | -21.0% | -36.2% |
| Frederick, MD | 1,331 | -6.5% | -14.1% |
| Fresno, CA | 692 | 4.1% | -10.0% |
| Grand Rapids, MI | 906 | -0.9% | -19.9% |
| Greensboro, NC | 474 | -16.4% | -42.8% |
| Greenville, SC | 1,090 | 1.6% | -7.1% |
| Hartford, CT | 1,147 | 5.3% | -20.2% |
| Houston, TX | 7,577 | -13.5% | -23.5% |
| Indianapolis, IN | 2,116 | -7.6% | -22.9% |
| Jacksonville, FL | 2,696 | 3.2% | -7.2% |
| Kansas City, MO | 2,309 | -9.7% | -18.6% |
| Knoxville, TN | 856 | 1.1% | -14.7% |
| Lake County, IL | 1,020 | 11.4% | -31.4% |
| Las Vegas, NV | 3,817 | 10.9% | 1.3% |
| Los Angeles, CA | 6,946 | 10.2% | 4.0% |
| Louisville, KY | 1,010 | -11.1% | -19.5% |
| McAllen, TX | 361 | -5.7% | -26.2% |
| Memphis, TN | 821 | -21.1% | -23.9% |
| Miami, FL | 3,862 | -0.6% | -2.9% |
| Milwaukee, WI | 1,296 | -5.4% | -25.4% |
| Minneapolis, MN | 4,458 | 25.5% | -10.2% |
| Montgomery County, PA | 1,766 | -2.3% | -29.1% |
| Nashville, TN | 3,183 | -8.1% | -11.7% |
| Nassau County, NY | 2,381 | -6.3% | -24.5% |
| New Brunswick, NJ | 2,680 | -3.6% | -33.0% |
| New Haven, CT | 910 | 7.4% | -14.5% |
| New Orleans, LA | 1,363 | -1.7% | 7.1% |
| New York, NY | 6,350 | -10.4% | -21.6% |
| Newark, NJ | 1,880 | -3.5% | -32.1% |
| North Port, FL | 2,362 | -3.0% | -11.3% |
| Oakland, CA | 2,599 | 18.2% | 7.0% |
| Oklahoma City, OK | 1,553 | -18.0% | -23.6% |
| Omaha, NE | 884 | 7.8% | -25.8% |
| Orlando, FL | 4,020 | -0.9% | -10.4% |
| Oxnard, CA | 756 | 7.5% | -2.5% |
| Philadelphia, PA | 2,241 | -5.7% | -16.7% |
| Phoenix, AZ | 8,039 | -1.2% | -7.1% |
| Pittsburgh, PA | 1,734 | 4.6% | -18.3% |
| Portland, OR | 2,812 | -4.3% | -8.6% |
| Providence, RI | 1,408 | -10.7% | -18.8% |
| Raleigh, NC | 2,135 | -2.4% | -18.2% |
| Richmond, VA | 1,359 | -5.2% | -20.9% |
| Riverside, CA | 4,939 | 5.0% | -7.4% |
| Rochester, NY | 688 | 4.2% | -30.8% |
| Sacramento, CA | 2,392 | 12.1% | -14.5% |
| Salt Lake City, UT | 476 | -46.6% | -62.6% |
| San Antonio, TX | 2,248 | -20.6% | -31.9% |
| San Diego, CA | 3,006 | 4.0% | -11.0% |
| San Francisco, CA | 1,104 | -4.9% | -8.6% |
| San Jose, CA | 1,586 | 17.6% | 15.0% |
| Seattle, WA | 3,734 | 10.8% | -5.5% |
| St. Louis, MO | 1,476 | -36.5% | -56.1% |
| Tacoma, WA | 1,204 | 10.9% | 0.0% |
| Tampa, FL | 5,396 | -0.5% | -11.4% |
| Tucson, AZ | 1,656 | 8.0% | -1.2% |
| Tulsa, OK | 960 | -15.3% | -20.3% |
| Urban Honolulu, HI | 675 | -9.0% | -27.9% |
| Virginia Beach, VA | 2,308 | 1.6% | -1.7% |
| Warren, MI | 2,572 | -1.8% | -16.8% |
| Washington, DC | 6,056 | 7.1% | -7.8% |
| West Palm Beach, FL | 3,546 | -2.5% | -11.5% |
| Worcester, MA | 718 | 5.0% | -24.0% |
| National | 564,900 | -0.2% | -16.4% |
All Homes for Sale
| Redfin Metro | All Homes for Sale | Month-Over-Month | Year-Over-Year |
|---|---|---|---|
| Albany, NY | 2,050 | -12.8% | -35.7% |
| Allentown, PA | 1,014 | -23.8% | -59.9% |
| Anaheim, CA | 6,924 | 1.6% | -18.7% |
| Atlanta, GA | 19,768 | -6.0% | -39.6% |
| Austin, TX | 5,266 | -12.7% | -40.2% |
| Bakersfield, CA | 1,833 | -4.9% | -23.8% |
| Baltimore, MD | 7,542 | -5.9% | -36.4% |
| Baton Rouge, LA | 1,912 | -19.7% | -58.3% |
| Birmingham, AL | 3,595 | -4.9% | -33.0% |
| Boston, MA | 8,491 | 6.3% | -18.4% |
| Bridgeport, CT | 4,273 | -5.5% | -28.0% |
| Buffalo, NY | 1,435 | -7.7% | -41.6% |
| Camden, NJ | 3,693 | -5.3% | -42.4% |
| Charleston, SC | 5,024 | 1.5% | -26.9% |
| Charlotte, NC | 7,926 | -11.4% | -42.9% |
| Chicago, IL | 22,943 | -5.4% | -33.1% |
| Cincinnati, OH | 6,485 | -2.3% | -20.8% |
| Cleveland, OH | 5,667 | -3.8% | -32.0% |
| Columbus, OH | 5,226 | -2.9% | -24.9% |
| Dallas, TX | 11,757 | -12.8% | -46.7% |
| Dayton, OH | 2,025 | -6.1% | -29.9% |
| Denver, CO | 6,729 | -0.6% | -29.6% |
| Detroit, MI | 4,036 | -8.6% | -39.8% |
| El Paso, TX | 2,462 | -4.6% | -33.1% |
| Elgin, IL | 1,685 | -10.2% | -53.9% |
| Fort Lauderdale, FL | 13,179 | -3.5% | -23.6% |
| Fort Worth, TX | 5,339 | -13.7% | -45.5% |
| Frederick, MD | 2,922 | -7.4% | -27.6% |
| Fresno, CA | 1,286 | -0.8% | -38.6% |
| Grand Rapids, MI | 1,806 | -6.8% | -39.6% |
| Greensboro, NC | 1,547 | -14.2% | -47.7% |
| Greenville, SC | 3,736 | -2.2% | -23.5% |
| Hartford, CT | 3,671 | -8.1% | -34.5% |
| Houston, TX | 23,049 | -8.4% | -33.0% |
| Indianapolis, IN | 4,401 | -13.8% | -40.0% |
| Jacksonville, FL | 6,532 | -1.4% | -34.5% |
| Kansas City, MO | 5,352 | -10.8% | -36.8% |
| Knoxville, TN | 3,116 | -5.3% | -30.2% |
| Lake County, IL | 2,524 | -7.6% | -48.3% |
| Las Vegas, NV | 9,580 | -4.8% | -21.4% |
| Los Angeles, CA | 18,986 | 1.1% | -4.2% |
| Louisville, KY | 2,617 | -11.5% | -33.5% |
| McAllen, TX | 1,424 | -4.2% | -36.2% |
| Memphis, TN | 2,373 | -8.9% | -32.4% |
| Miami, FL | 16,369 | -1.4% | -21.1% |
| Milwaukee, WI | 4,114 | -3.8% | -23.6% |
| Minneapolis, MN | 9,124 | 5.1% | -25.1% |
| Montgomery County, PA | 4,248 | -5.1% | -37.7% |
| Nashville, TN | 8,128 | -6.9% | -36.3% |
| Nassau County, NY | 8,232 | -4.3% | -31.6% |
| New Brunswick, NJ | 7,611 | -7.8% | -44.0% |
| New Haven, CT | 2,827 | -7.9% | -27.1% |
| New Orleans, LA | 3,954 | -4.6% | -25.9% |
| New York, NY | 33,292 | -12.1% | -15.2% |
| Newark, NJ | 6,434 | -3.6% | -35.9% |
| North Port, FL | 5,222 | -13.0% | -46.0% |
| Oakland, CA | 4,151 | 11.7% | -3.5% |
| Oklahoma City, OK | 3,778 | -15.8% | -39.6% |
| Omaha, NE | 1,624 | -3.6% | -38.3% |
| Orlando, FL | 9,720 | -10.3% | -26.9% |
| Oxnard, CA | 1,766 | -0.8% | -27.0% |
| Philadelphia, PA | 7,352 | -4.0% | -12.4% |
| Phoenix, AZ | 17,283 | -3.0% | -27.4% |
| Pittsburgh, PA | 6,696 | -4.9% | -29.1% |
| Portland, OR | 5,089 | -7.8% | -34.7% |
| Providence, RI | 3,937 | -6.9% | -33.7% |
| Raleigh, NC | 5,300 | -5.9% | -36.5% |
| Richmond, VA | 2,618 | -7.3% | -40.2% |
| Riverside, CA | 11,651 | -3.5% | -37.5% |
| Rochester, NY | 1,367 | -6.3% | -42.1% |
| Sacramento, CA | 4,069 | 2.0% | -36.1% |
| Salt Lake City, UT | 1,087 | -36.5% | -66.7% |
| San Antonio, TX | 6,426 | -15.1% | -47.4% |
| San Diego, CA | 5,601 | -1.7% | -30.9% |
| San Francisco, CA | 2,778 | -0.6% | 21.7% |
| San Jose, CA | 3,005 | 13.8% | 20.0% |
| Seattle, WA | 5,988 | 2.7% | -16.1% |
| St. Louis, MO | 5,248 | -22.3% | -50.3% |
| Tacoma, WA | 1,729 | 3.8% | -24.0% |
| Tampa, FL | 10,930 | -9.4% | -40.3% |
| Tucson, AZ | 4,138 | 1.8% | -23.4% |
| Tulsa, OK | 2,309 | -14.3% | -43.2% |
| Urban Honolulu, HI | 3,005 | -4.0% | -28.5% |
| Virginia Beach, VA | 5,208 | -2.9% | -30.4% |
| Warren, MI | 5,796 | -10.3% | -39.5% |
| Washington, DC | 13,508 | 0.5% | -16.4% |
| West Palm Beach, FL | 13,184 | -2.6% | -23.7% |
| Worcester, MA | 1,678 | -4.9% | -38.1% |
| National | 1,548,700 | -2.1% | -27.4% |
Median Off-Market Redfin Estimate
| Redfin Metro | Estimate | Month-Over-Month | Year-Over-Year |
|---|---|---|---|
| Albany, NY | $213,500 | 0.2% | 10.0% |
| Allentown, PA | $231,500 | 0.7% | 10.9% |
| Anaheim, CA | $784,600 | 0.9% | 8.5% |
| Atlanta, GA | $254,800 | 1.1% | 11.4% |
| Austin, TX | $332,000 | 1.4% | 12.4% |
| Bakersfield, CA | $213,800 | 0.7% | 12.9% |
| Baltimore, MD | $292,400 | 0.7% | 9.7% |
| Baton Rouge, LA | $137,900 | 0.6% | 7.8% |
| Birmingham, AL | $146,400 | 1.1% | 10.9% |
| Boston, MA | $560,500 | 0.4% | 8.4% |
| Bridgeport, CT | $414,100 | 0.6% | 6.5% |
| Buffalo, NY | $163,800 | 0.5% | 11.0% |
| Camden, NJ | $228,900 | 1.2% | 13.0% |
| Charleston, SC | $256,100 | 0.8% | 9.1% |
| Charlotte, NC | $236,900 | 1.3% | 16.8% |
| Chicago, IL | $273,000 | 0.3% | 5.6% |
| Cincinnati, OH | $180,300 | 0.7% | 11.1% |
| Cleveland, OH | $153,500 | 0.5% | 11.1% |
| Columbus, OH | $216,500 | 0.6% | 11.7% |
| Dallas, TX | $277,200 | 0.8% | 8.2% |
| Dayton, OH | $136,100 | 1.0% | 11.4% |
| Denver, CO | $442,600 | 0.8% | 8.2% |
| Detroit, MI | $113,200 | 0.6% | 10.9% |
| Elgin, IL | $243,900 | 0.5% | 6.7% |
| Fort Lauderdale, FL | $293,600 | 0.7% | 8.4% |
| Fort Worth, TX | $237,200 | 0.8% | 8.9% |
| Frederick, MD | $441,700 | 0.6% | 7.3% |
| Fresno, CA | $286,100 | 0.6% | 11.6% |
| Grand Rapids, MI | $191,600 | 2.2% | 14.1% |
| Greensboro, NC | $153,300 | 0.7% | 13.6% |
| Greenville, SC | $174,900 | 1.0% | 11.3% |
| Hartford, CT | $236,200 | 0.5% | 6.7% |
| Houston, TX | $214,200 | 0.5% | 8.6% |
| Indianapolis, IN | $181,300 | 0.7% | 12.0% |
| Jacksonville, FL | $230,900 | 1.4% | 10.5% |
| Kansas City, MO | $198,600 | 0.9% | 9.5% |
| Knoxville, TN | $196,400 | 0.7% | 12.2% |
| Lake County, IL | $230,800 | 0.4% | 6.9% |
| Las Vegas, NV | $302,800 | 0.7% | 7.5% |
| Los Angeles, CA | $697,500 | 0.8% | 9.4% |
| Louisville, KY | $190,700 | 0.8% | 9.7% |
| Memphis, TN | $164,800 | 0.8% | 15.0% |
| Miami, FL | $336,500 | 1.0% | 8.3% |
| Milwaukee, WI | $221,800 | 0.2% | 14.0% |
| Minneapolis, MN | $292,500 | 0.6% | 8.5% |
| Montgomery County, PA | $350,100 | 0.6% | 9.2% |
| Nashville, TN | $298,300 | 0.6% | 9.1% |
| Nassau County, NY | $529,900 | 0.7% | 10.7% |
| New Brunswick, NJ | $378,900 | 0.8% | 10.7% |
| New Haven, CT | $238,800 | 0.4% | 8.5% |
| New Orleans, LA | $183,300 | 0.6% | 9.5% |
| Newark, NJ | $405,400 | 0.9% | 11.6% |
| North Port, FL | $256,000 | 1.1% | 9.6% |
| Oakland, CA | $842,900 | 0.8% | 10.5% |
| Oklahoma City, OK | $157,500 | 0.6% | 10.4% |
| Omaha, NE | $205,500 | 0.5% | 9.6% |
| Orlando, FL | $252,400 | 0.6% | 8.9% |
| Oxnard, CA | $646,300 | 0.8% | 8.5% |
| Philadelphia, PA | $210,000 | 0.6% | 12.0% |
| Phoenix, AZ | $306,900 | 1.2% | 14.6% |
| Pittsburgh, PA | $148,000 | 0.4% | 13.1% |
| Portland, OR | $429,100 | 0.8% | 8.9% |
| Providence, RI | $325,700 | 0.9% | 12.7% |
| Raleigh, NC | $277,500 | 0.9% | 9.7% |
| Richmond, VA | $256,000 | 0.6% | 10.1% |
| Riverside, CA | $369,700 | 1.2% | 13.2% |
| Rochester, NY | $155,600 | 0.5% | 9.6% |
| Sacramento, CA | $450,300 | 1.4% | 10.4% |
| Salt Lake City, UT | $391,600 | 0.7% | 12.5% |
| San Antonio, TX | $199,100 | 0.6% | 9.2% |
| San Diego, CA | $660,900 | 1.1% | 11.0% |
| San Francisco, CA | $1,359,700 | 0.0% | 1.0% |
| San Jose, CA | $1,225,200 | 1.1% | 9.6% |
| Seattle, WA | $614,800 | 1.0% | 12.3% |
| St. Louis, MO | $169,800 | 0.5% | 8.9% |
| Tacoma, WA | $412,800 | 1.0% | 16.1% |
| Tampa, FL | $241,600 | 1.0% | 11.3% |
| Tucson, AZ | $227,900 | 1.1% | 14.0% |
| Tulsa, OK | $143,500 | 0.6% | 10.3% |
| Urban Honolulu, HI | $730,500 | 0.8% | 4.7% |
| Virginia Beach, VA | $251,600 | 0.7% | 9.7% |
| Warren, MI | $227,700 | 0.5% | 10.0% |
| Washington, DC | $429,200 | 0.6% | 8.6% |
| West Palm Beach, FL | $296,700 | 1.3% | 8.4% |
| Worcester, MA | $306,900 | 0.5% | 11.4% |
| National | $337,400 | 3.4% | 13.4% |


