
High mortgage rates and an uptick in housing supply took some pressure off price growth, but prices aren’t falling because there’s still a shortage of homes for sale. Overall, price growth appears to be returning to pre-pandemic levels.
U.S. home prices climbed 0.4% month over month in December, the smallest increase since June. December represented the third straight month of slowing price growth. On a year-over-year basis, prices rose 6.6%.
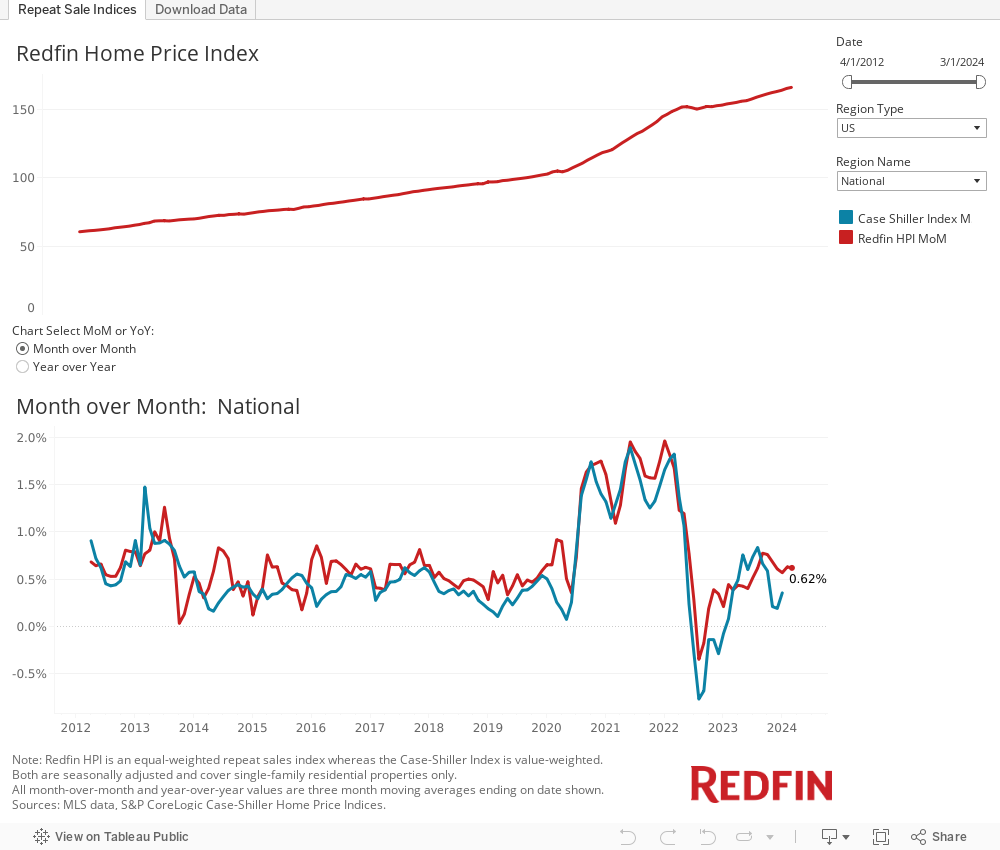
This is according to the Redfin Home Price Index (RHPI), which uses the repeat-sales pricing method to calculate seasonally adjusted changes in prices of single-family homes. The RHPI measures sale prices of homes that sold during a given period, and how those prices have changed since the last time those same homes sold. It’s similar to the S&P CoreLogic Case-Shiller Home Price Indices but publishes more than one month earlier. December data covers the three months ending Dec. 31, 2023. Read the full RHPI methodology here.
Many home purchases that closed in December were negotiated in November, when mortgage rates were near the highest level in over two decades. That likely depressed home price growth because buyers were grappling with limited purchasing power, said Redfin Senior Economist Sheharyar Bokhari.
Home price growth also likely slowed in December because the housing shortage eased slightly, giving buyers more options to choose from; new listings rose 0.1% to the highest seasonally adjusted level since September 2022. Still, housing supply remained far below pre-pandemic levels, preventing home prices from dropping as buyers compete for a limited pool of homes.
Overall, homebuying conditions have been improving. Price growth is slowing, supply is on the rise and mortgage rates have fallen significantly since their October peak. Price growth also appears to be normalizing as the housing market becomes more balanced; the 0.4% gain in December is roughly in line with monthly increases that occurred the years leading up to the pandemic.
“Homebuyers can take solace in the fact that prices are unlikely to balloon again like they did during the pandemic homebuying frenzy, but they probably won’t fall any time soon, either,” Bokhari said. “That’s because supply isn’t growing enough to bring prices down, and mortgage rates are no longer falling enough to drive prices up significantly.”
Prices Dropped Fastest in Austin, TX and Climbed Fastest in Chicago
Fifteen of the 50 most populous U.S. metropolitan areas posted month-over-month price decreases in December, though all but one of those declines were less than 1%. In Austin, TX, prices fell 1.1%—the biggest drop among the metros Redfin analyzed. Next came Oakland, CA (-0.9%), Sacramento, CA (-0.8%), Miami (-0.6%) and Nashville, TN (-0.6%).
In Chicago, home prices rose 2.6% month over month—the largest increase among the 50 most populous metros. Rounding out the top five are San Jose, CA (1.7%), Pittsburgh (1.6%), Virginia Beach, VA (1.4%) and Charlotte, NC (1.1%).
Metro-Level Summary: Redfin Home Price Index, December 2023
The table below includes the 50 most populous U.S. metro areas.
| U.S. metro area | Month-over-month change | Year-over-year change |
| Anaheim, CA | 0.7% | 10.1% |
| Atlanta, GA | 0.5% | 8.4% |
| Austin, TX | -1.1% | -4.8% |
| Baltimore, MD | 0.4% | 7.1% |
| Boston, MA | 0.8% | 11.5% |
| Charlotte, NC | 1.1% | 11.9% |
| Chicago, IL | 2.6% | 15.1% |
| Cincinnati, OH | 0.9% | 14.1% |
| Cleveland, OH | 0.2% | 10.8% |
| Columbus, OH | 0.6% | 11.6% |
| Dallas, TX | 0.2% | 2.4% |
| Denver, CO | 0.4% | 3.8% |
| Detroit, MI | 0.2% | 9.8% |
| Fort Lauderdale, FL | -0.2% | 8.5% |
| Fort Worth, TX | 0.3% | 2.2% |
| Houston, TX | -0.5% | 1.9% |
| Indianapolis, IN | 0.6% | 5.1% |
| Jacksonville, FL | -0.1% | 2.5% |
| Kansas City, MO | 0.3% | 8.1% |
| Las Vegas, NV | 0.7% | 4.1% |
| Los Angeles, CA | 0.2% | 7.5% |
| Miami, FL | -0.6% | 10.0% |
| Milwaukee, WI | 0.0% | 9.0% |
| Minneapolis, MN | 0.3% | 4.3% |
| Montgomery County, PA | -0.6% | 6.9% |
| Nashville, TN | -0.6% | 3.3% |
| Nassau County, NY | 0.3% | 7.8% |
| New Brunswick, NJ | -0.5% | 10.7% |
| New York, NY | 0.6% | 9.3% |
| Newark, NJ | 1.0% | 14.2% |
| Oakland, CA | -0.9% | 2.9% |
| Orlando, FL | 0.4% | 6.3% |
| Philadelphia, PA | 0.9% | 9.2% |
| Phoenix, AZ | 0.1% | 3.6% |
| Pittsburgh, PA | 1.6% | 11.0% |
| Portland, OR | -0.5% | 3.1% |
| Providence, RI | 0.6% | 13.1% |
| Riverside, CA | -0.1% | 3.2% |
| Sacramento, CA | -0.8% | 2.5% |
| San Antonio, TX | -0.6% | -2.4% |
| San Diego, CA | -0.2% | 9.1% |
| San Francisco, CA | 1.0% | 3.4% |
| San Jose, CA | 1.7% | 11.4% |
| Seattle, WA | 0.7% | 5.4% |
| St. Louis, MO | 0.4% | 7.9% |
| Tampa, FL | 0.6% | 3.9% |
| Virginia Beach, VA | 1.4% | 7.0% |
| Warren, MI | 0.5% | 7.2% |
| Washington, DC | 0.6% | 7.5% |
| West Palm Beach, FL | -0.5% | 10.5% |


