Nationally, asking rents were up 15% in February, while homebuyer mortgage payments increased twice as fast.
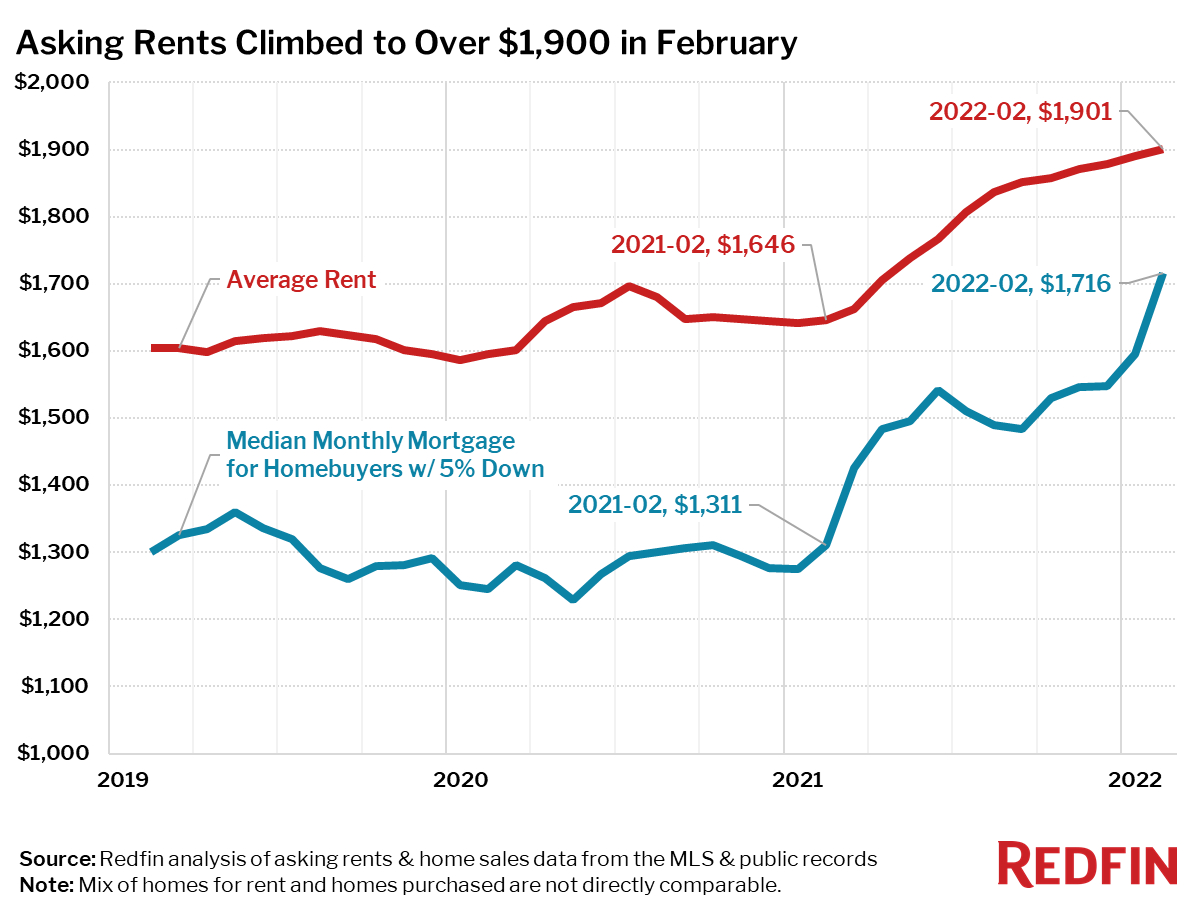
The average monthly asking rent in the U.S. increased 15% year over year to a record high of $1,901 in February, the largest annual jump since at least February 2020 (Redfin’s rental data goes back through February 2019). Meanwhile, the national median monthly mortgage payment for homebuyers climbed 31% year over year to $1,716, also the biggest increase in Redfin’s records.
“The cost of housing is going up for homebuyers and renters, but it’s going up more quickly for homebuyers,” said Redfin Chief Economist Daryl Fairweather. “That’s because mortgage rates have increased sharply, and will likely continue to do so. When the cost of homeownership increases, many potential homebuyers opt to rent instead, which drives up rental prices. Americans should brace themselves for continued inflation across the board and try to find ways to cut costs. That might mean driving less to save on gas, or moving to a more affordable, walkable city like Albuquerque or Buffalo, where you can save on both housing and gas. The job market is great for workers right now, so it is a good time to move even if you can’t work remotely.”
| Rental Market Summary | February 2021 | Month-Over-Month | Year-Over-Year |
|---|---|---|---|
| Average Monthly Rent | $1,901 | 0.5% | 15.5% |
| Median Monthly Mortgage Payment for Homebuyers w/ 5% down payment | $1,716 | 7.5% | 30.9% |
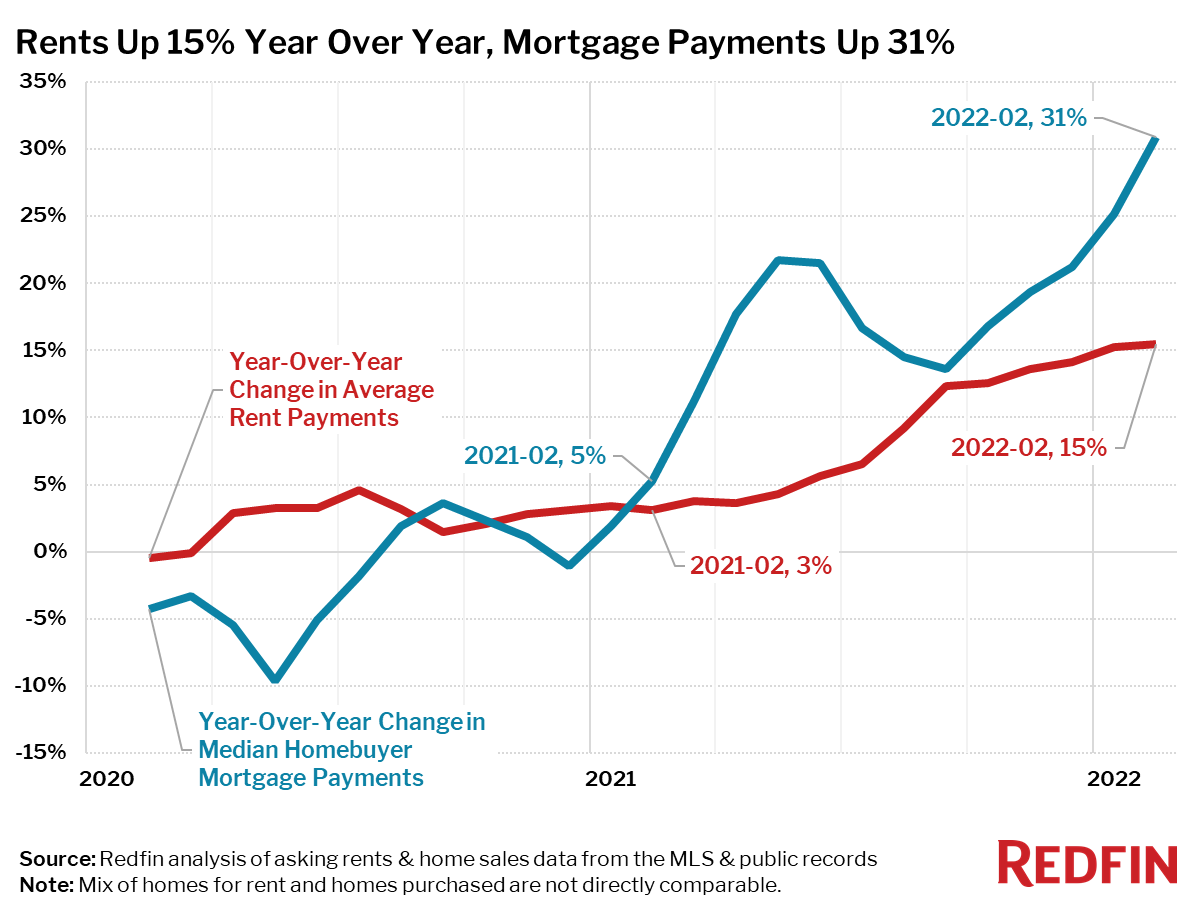
Mortgage payment increases outpaced asking rent increases in 44 of the 50 largest U.S. metro areas in February.
Asking Rents Are Up 40% In Austin, TX
Rent increases hit 40% in Austin, TX, with Portland, OR not far behind at 39%. The Tri-State Area and Florida also saw rental increases of 30% or more.
Top 10 Metro Areas With Fastest-Rising Rents Year Over Year
- Austin, TX (+40%)
- Portland, OR (+39%)
- New York, NY (+36%)
- Newark, NJ (+36%)
- Nassau County, NY (+36%)
- New Brunswick, NJ (+36%)
- Fort Lauderdale, FL (+30%)
- West Palm Beach, FL (+30%)
- Miami, FL (+30%)
- Denver, CO (+29%)
Just two of the 50 most-populous metro areas saw rents fall in February from a year earlier. Rents declined 3% in Milwaukee and 2% in Kansas City, MO.
Metro Areas Where Rents Declined Year Over Year
- Milwaukee, WI (-2.6%)
- Kansas City, MO (-1.5%)
Average Asking Rents and Median Monthly Mortgage Payments for Homebuyers, February 2022
| U.S. Metro Area | Average Asking Rent | Year-Over-Year Change in Average Asking Rent | Median Monthly Mortgage (5% Down) | Year-Over-Year Change in Median Monthly Mortgage (5% Down) | Difference Between Year-Over-Year Change in Median Monthly Mortgage & Average Asking Rent |
|---|---|---|---|---|---|
| Anaheim, CA | $3,316 | 9.8% | $4,403 | 35.7% | 26 pp |
| Atlanta, GA | $2,040 | 17.0% | $1,564 | 39.0% | 22 pp |
| Austin, TX | $2,308 | 40.4% | $2,202 | 42.1% | 2 pp |
| Baltimore, MD | $2,024 | 10.3% | $1,388 | 18.3% | 8 pp |
| Boston, MA | $3,586 | 19.2% | $2,619 | 21.8% | 3 pp |
| Charlotte, NC | $1,695 | 7.5% | $1,618 | 37.9% | 30 pp |
| Chicago, IL | $2,262 | 4.5% | $1,299 | 20.9% | 16 pp |
| Cincinnati, OH | $1,479 | 22.7% | $1,033 | 25.8% | 3 pp |
| Cleveland, OH | $1,311 | 5.3% | $784 | 28.4% | 23 pp |
| Columbus, OH | $1,486 | 8.5% | $1,189 | 28.0% | 19 pp |
| Dallas, TX | $2,132 | 24.4% | $1,762 | 36.3% | 12 pp |
| Denver, CO | $2,729 | 29.4% | $2,520 | 36.6% | 7 pp |
| Detroit, MI | $1,560 | 8.2% | $727 | 23.9% | 16 pp |
| Fort Lauderdale, FL | $3,010 | 30.3% | $1,599 | 29.9% | 0 pp |
| Fort Worth, TX | $2,132 | 24.4% | $1,533 | 38.6% | 14 pp |
| Houston, TX | $1,770 | 11.0% | $1,432 | 33.2% | 22 pp |
| Indianapolis, IN | $1,382 | 17.6% | $1,101 | 27.7% | 10 pp |
| Jacksonville, FL | $1,581 | 23.6% | $1,467 | 40.2% | 17 pp |
| Kansas City, MO | $1,414 | -1.5% | $1,194 | 22.2% | 24 pp |
| Las Vegas, NV | $1,760 | 19.6% | $1,863 | 44.5% | 25 pp |
| Los Angeles, CA | $3,316 | 9.8% | $3,685 | 26.5% | 17 pp |
| Miami, FL | $3,010 | 30.3% | $1,982 | 36.1% | 6 pp |
| Milwaukee, WI | $1,581 | -2.6% | $1,069 | 18.9% | 21 pp |
| Minneapolis, MN | $1,812 | 3.7% | $1,520 | 23.4% | 20 pp |
| Montgomery County, PA | $2,279 | 14.5% | $1,678 | 22.7% | 8 pp |
| Nashville, TN | $1,939 | 16.6% | $1,850 | 41.3% | 25 pp |
| Nassau County, NY | $3,858 | 35.7% | $2,581 | 23.3% | -12 pp |
| New Brunswick, NJ | $3,858 | 35.7% | $1,872 | 27.4% | -8 pp |
| New York, NY | $3,858 | 35.7% | $2,951 | 25.8% | -10 pp |
| Newark, NJ | $3,858 | 35.7% | $1,982 | 23.7% | -12 pp |
| Oakland, CA | $3,535 | 16.1% | $4,075 | 26.4% | 10 pp |
| Orlando, FL | $2,061 | 29.1% | $1,586 | 35.4% | 6 pp |
| Philadelphia, PA | $2,279 | 14.5% | $1,101 | 18.9% | 4 pp |
| Phoenix, AZ | $2,153 | 26.1% | $2,009 | 44.6% | 19 pp |
| Pittsburgh, PA | $1,729 | 11.1% | $881 | 16.7% | 6 pp |
| Portland, OR | $2,455 | 38.7% | $2,313 | 26.5% | -12 pp |
| Providence, RI | $2,175 | 14.2% | $1,678 | 32.5% | 18 pp |
| Riverside, CA | $2,653 | 17.2% | $2,418 | 36.4% | 19 pp |
| Sacramento, CA | $2,648 | 18.1% | $2,533 | 32.4% | 14 pp |
| San Antonio, TX | $1,424 | 19.0% | $1,357 | 33.0% | 14 pp |
| San Diego, CA | $3,181 | 18.9% | $3,524 | 31.6% | 13 pp |
| San Francisco, CA | $3,535 | 16.1% | $6,718 | 25.0% | 9 pp |
| San Jose, CA | $3,426 | 13.7% | $6,387 | 36.2% | 22 pp |
| Seattle, WA | $2,762 | 28.6% | $3,306 | 29.6% | 1 pp |
| St. Louis, MO | $1,486 | 3.3% | $947 | 20.9% | 18 pp |
| Tampa, FL | $2,102 | 25.1% | $1,548 | 44.0% | 19 pp |
| Virginia Beach, VA | $1,659 | 16.2% | $1,255 | 23.6% | 7 pp |
| Warren, MI | $1,560 | 8.2% | $1,101 | 23.0% | 15 pp |
| Washington, DC | $2,585 | 12.4% | $2,180 | 24.0% | 12 pp |
| West Palm Beach, FL | $3,010 | 30.3% | $1,762 | 28.8% | -2 pp |
| National | $1,901 | 15.5% | $1,716 | 30.8% | 15 pp |
Note that the national increase was 15.47%, which is why it is rounded to 15% in the text of this report.
Methodology
Redfin’s rent-versus-own analysis uses data from more than 20,000 apartment buildings across the US. The report combines rental data on all sizes of apartments for rent with home sales data on all residential home sales (single-family, townhouse and condos) from public records and the multiple listing service (MLS). When this report refers to the median mortgage payment for new homebuyers, it is based on a 5% down payment, the median sale price during the month and the average mortgage interest rate for the month. The report uses a 5% down payment in order to be comparable to what an average renter may be able to reasonably achieve in savings.
Redfin analyzed home sales data from the MLS, and public records and rent prices from RentPath, across the 50 largest metro areas in the US. Monthly rental prices in this report are not directly comparable to monthly homebuyer mortgage payments, since the mix of homes available to rent and the mix of homes being purchased differ in location, size and quality of home within each metro area. For example, most of the homes being purchased may be in the less expensive suburbs of the metropolitan area, while the apartments being rented may be closer to the more expensive city core.
It is also important to note that the prices in this report reflect the current costs of new leases and new mortgages during each time period. In other words, the amount shown as the average rent is not the average of what all renters are paying, but the average cost of apartments that were available for new renters during the report month. Likewise, the median monthly mortgage payment shown is only for homes that sold during the report month, not for all homeowners.