Portland and Austin saw the largest increases, with rents surging more than 30% year over year.
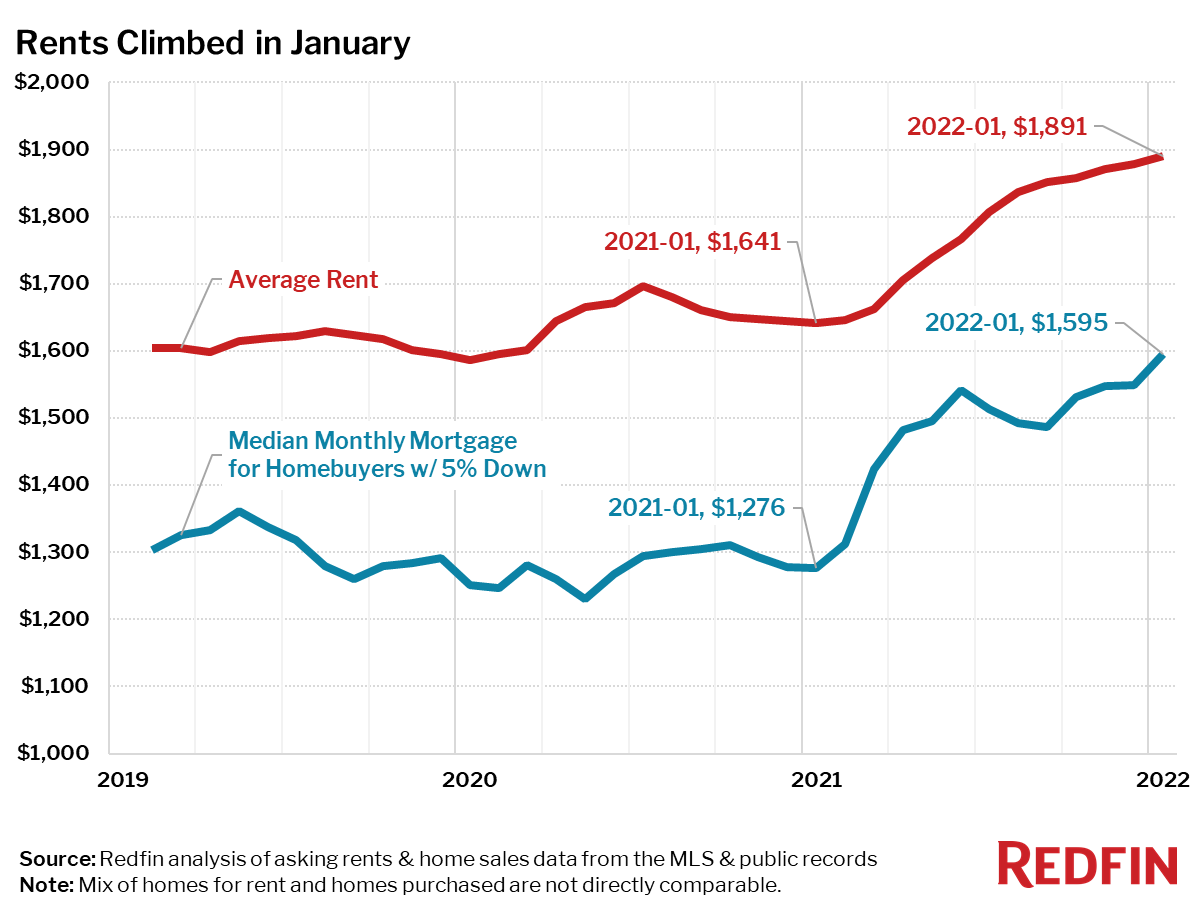
Average monthly asking rents in the U.S. increased 15.2% year over year to $1,891 in January, the largest annual jump since at least February 2020 (Redfin’s rental data goes back through February 2019). Meanwhile, the national median monthly mortgage payment for homebuyers climbed 25% year over year to $1,595, also the biggest increase in Redfin’s records.
“Moving right now is expensive, whether you’re renting or buying,” said Redfin Chief Economist Daryl Fairweather. “One of the only ways to avoid high housing costs is to move somewhere cheaper, but the list of places that are truly inexpensive is shrinking. Rising mortgage rates are squeezing more Americans out of the for-sale market, which will likely put increasing pressure on rents in the coming months.”
| Rental Market Summary | January 2022 | Month-Over-Month | Year-Over-Year |
|---|---|---|---|
| Average Monthly Rent | $1,891 | 0.7% | 15.2% |
| Median Monthly Mortgage Payment for Homebuyers w/ 5% Down Payment | $1,595 | 3.0% | 25.0% |
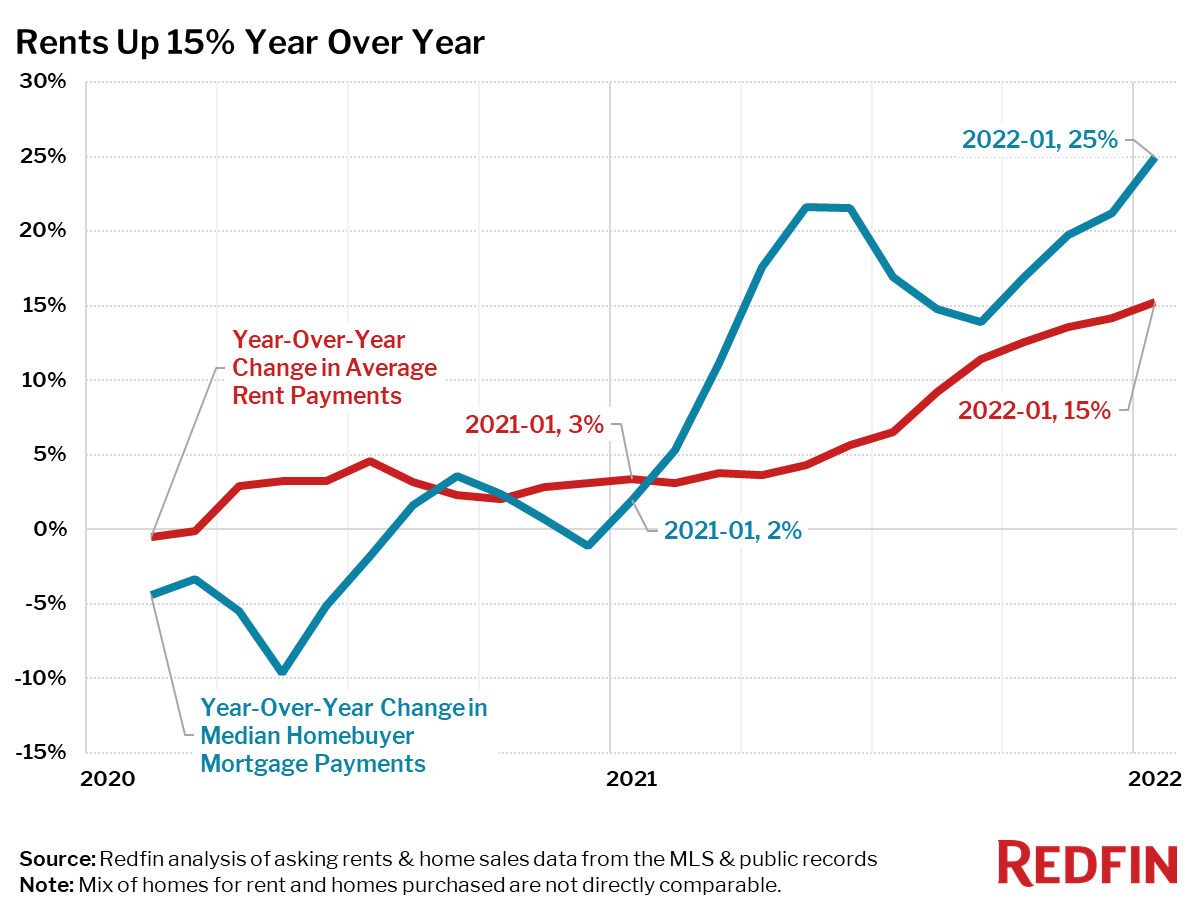
Year over year, rent increases outpaced mortgage-payment increases for new homebuyers in just 13 of the 50 largest U.S. metro areas in January.
Rents Are Up Over 30% In Portland, OR, Austin, TX, & New York City
The 10 metro areas with the biggest increases in rent prices—up 30% or more year over year—are primarily located in the Tri-State Area and Florida. Portland, OR and Austin, TX also made the list, leading the way with increases of 39% and 35%, respectively.
Top 10 Metro Areas With Fastest-Rising Rents Year Over Year
- Portland, OR (+39%)
- Austin, TX (+35%)
- Newark, NJ (+33%)
- Nassau County, NY (+33%)
- New York, NY (+33%)
- New Brunswick, NJ (+33%)
- Tampa, FL (+31%)
- Fort Lauderdale, FL (+31%)
- West Palm Beach, FL (+31%)
- Miami, FL (+31%)
Just two of the top 50 metro areas saw rents fall in January from a year earlier. Rents declined 4% in both Kansas City, MO and Milwaukee.
Metro Areas Where Rents Declined Year Over Year
- Kansas City, MO (-4%)
- Milwaukee, WI (-4%)
Year-Over-Year Change in Rents and Median Monthly Mortgage Payments for Homebuyers, January 2022
| Metro Area | Average Rent | Year-Over-Year Change in Average Rent | Monthly Mortgage (5% down) | Year-Over-Year Change in Monthly Mortgage (5% down) | Difference Between Year-Over-Year Change in 5% Down Mortgage Payment & Rent |
|---|---|---|---|---|---|
| Anaheim, CA | $3,349 | 9.9% | $4,066 | 31.2% | 21 pts |
| Atlanta, GA | $2,033 | 19.2% | $1,467 | 35.3% | 16 pts |
| Austin, TX | $2,245 | 35.5% | $2,055 | 44.0% | 9 pts |
| Baltimore, MD | $2,048 | 12.8% | $1,335 | 14.9% | 2 pts |
| Boston, MA | $3,508 | 16.1% | $2,522 | 16.9% | 1 pts |
| Charlotte, NC | $1,722 | 11.2% | $1,513 | 33.6% | 22 pts |
| Chicago, IL | $2,332 | 6.1% | $1,225 | 18.0% | 12 pts |
| Cincinnati, OH | $1,520 | 28.4% | $958 | 21.6% | -7 pts |
| Cleveland, OH | $1,338 | 9.6% | $742 | 17.5% | 8 pts |
| Columbus, OH | $1,493 | 8.0% | $1,123 | 22.7% | 15 pts |
| Dallas, TX | $2,073 | 24.0% | $1,611 | 32.0% | 8 pts |
| Denver, CO | $2,667 | 22.8% | $2,289 | 29.9% | 7 pts |
| Detroit, MI | $1,580 | 9.8% | $692 | 15.3% | 6 pts |
| Fort Lauderdale, FL | $2,973 | 30.9% | $1,518 | 23.4% | -7 pts |
| Fort Worth, TX | $2,073 | 24.0% | $1,406 | 36.0% | 12 pts |
| Houston, TX | $1,836 | 12.6% | $1,314 | 29.9% | 17 pts |
| Indianapolis, IN | $1,311 | 10.5% | $1,017 | 23.2% | 13 pts |
| Jacksonville, FL | $1,558 | 23.5% | $1,369 | 36.2% | 13 pts |
| Kansas City, MO | $1,408 | -3.6% | $1,123 | 18.4% | 22 pts |
| Las Vegas, NV | $1,765 | 21.9% | $1,704 | 37.3% | 15 pts |
| Los Angeles, CA | $3,349 | 9.9% | $3,498 | 25.4% | 16 pts |
| Miami, FL | $2,973 | 30.9% | $1,852 | 29.2% | -2 pts |
| Milwaukee, WI | $1,573 | -3.6% | $1,017 | 16.8% | 20 pts |
| Minneapolis, MN | $1,818 | 5.9% | $1,420 | 20.5% | 15 pts |
| Montgomery County, PA | $2,297 | 15.9% | $1,611 | 16.3% | 0 pts |
| Nashville, TN | $1,886 | 14.6% | $1,685 | 32.9% | 18 pts |
| Nassau County, NY | $3,743 | 32.5% | $2,500 | 19.5% | -13 pts |
| New Brunswick, NJ | $3,743 | 32.5% | $1,802 | 22.4% | -10 pts |
| New York, NY | $3,743 | 32.5% | $2,777 | 20.2% | -12 pts |
| Newark, NJ | $3,743 | 32.5% | $1,908 | 15.9% | -17 pts |
| Oakland, CA | $3,564 | 18.8% | $3,625 | 17.0% | -2 pts |
| Orlando, FL | $2,032 | 29.2% | $1,484 | 32.6% | 3 pts |
| Philadelphia, PA | $2,297 | 15.9% | $1,060 | 15.0% | -1 pts |
| Phoenix, AZ | $2,158 | 26.4% | $1,881 | 40.8% | 14 pts |
| Pittsburgh, PA | $1,740 | 13.2% | $844 | 14.3% | 1 pts |
| Portland, OR | $2,459 | 39.2% | $2,183 | 25.3% | -14 pts |
| Providence, RI | $2,099 | 10.4% | $1,590 | 24.4% | 14 pts |
| Riverside, CA | $2,665 | 18.5% | $2,247 | 32.4% | 14 pts |
| Sacramento, CA | $2,724 | 24.0% | $2,311 | 26.7% | 3 pts |
| San Antonio, TX | $1,414 | 15.4% | $1,272 | 28.8% | 13 pts |
| San Diego, CA | $3,129 | 16.1% | $3,307 | 30.3% | 14 pts |
| San Francisco, CA | $3,564 | 18.8% | $5,939 | 15.3% | -4 pts |
| San Jose, CA | $3,382 | 9.3% | $5,764 | 23.9% | 15 pts |
| Seattle, WA | $2,774 | 28.7% | $3,010 | 24.3% | -4 pts |
| St. Louis, MO | $1,499 | 2.5% | $911 | 17.7% | 15 pts |
| Tampa, FL | $2,120 | 31.0% | $1,441 | 37.8% | 7 pts |
| Virginia Beach, VA | $1,669 | 17.5% | $1,187 | 17.4% | 0 pts |
| Warren, MI | $1,580 | 9.8% | $1,037 | 16.4% | 7 pts |
| Washington, D.C. | $2,564 | 13.7% | $1,993 | 16.4% | 3 pts |
| West Palm Beach, FL | $2,973 | 30.9% | $1,657 | 25.6% | -5 pts |
| National | $1,891 | 15.2% | $1,595 | 25.0% | 10 pts |