Increase in rents outpaced the increase in the monthly cost of buying a home.
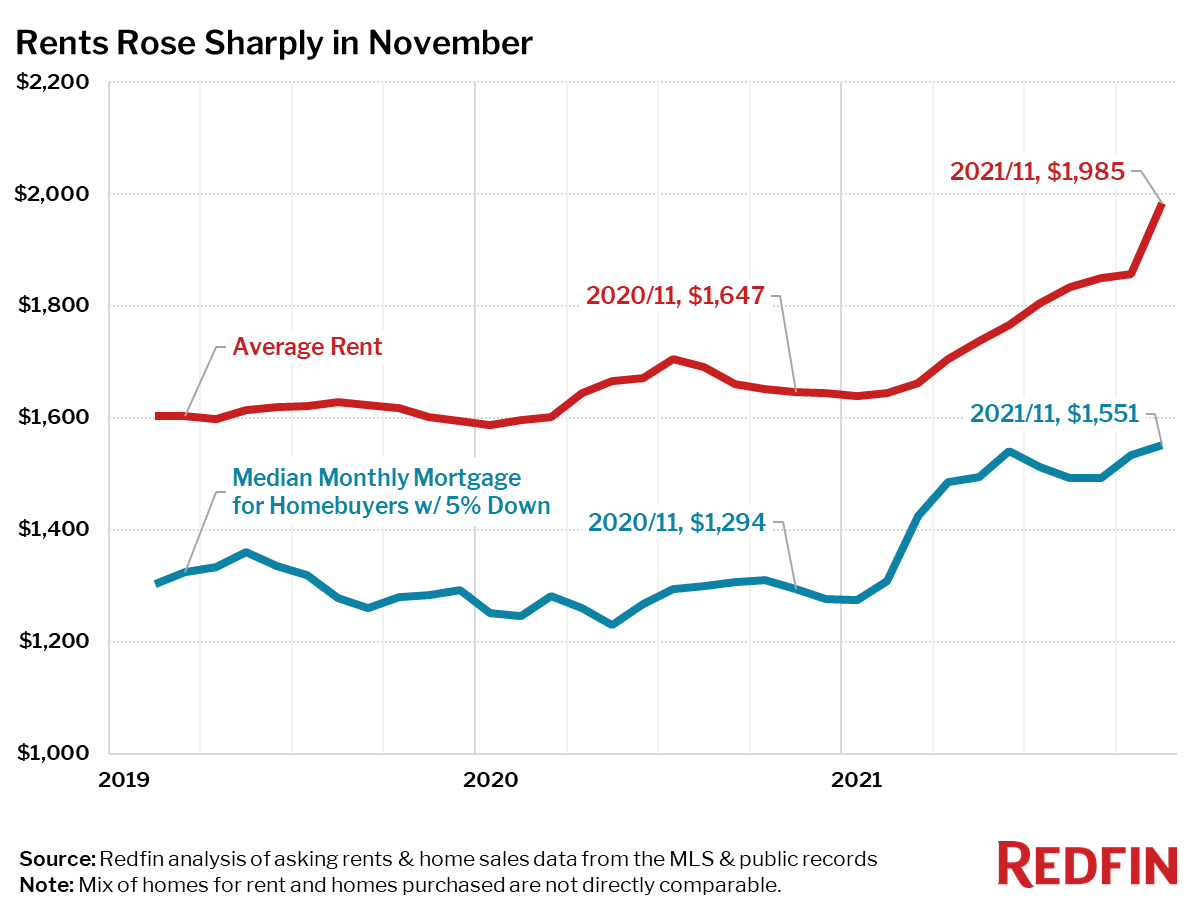
Average monthly rents increased 21% nationwide over the past year and 7% in a single month, the highest annual and monthly growth rates in at least two years—as far back as Redfin’s rental data goes. The national median monthly mortgage payment for homebuyers climbed at about the same annual rate—20%—but rose just 1% from October. Rapidly increasing housing costs are a big contributor to overall inflation, which hit 6.8% in November, its highest level since 1982.
“First inflation came for the for-sale housing market, and now it is coming for the rental market,” said Redfin Chief Economist Daryl Fairweather. “Many people have been priced out of the for-sale market and are looking to rent instead, but that demand is pushing up rents. Anyone who bought a home before this year can pat themselves on the back because their mortgage payments are fixed, meaning their biggest recurring expense is immune to inflation. If you are looking to buy or rent now, there’s nowhere to hide from inflation when it comes to housing costs. The good news is that the tight labor market means it’s a great time to move somewhere more affordable. Chances are good that no matter where you go, you’ll be able to find a new job relatively quickly.”
| Rental Market Summary | November 2021 | Month-Over-Month | Year-Over-Year |
|---|---|---|---|
| Average Monthly Rent | $1,985 | 6.8% | 20.5% |
| Median Monthly Mortgage Payment for Homebuyers w/ 5% down payment | $1,551 | 1.1% | 19.9% |
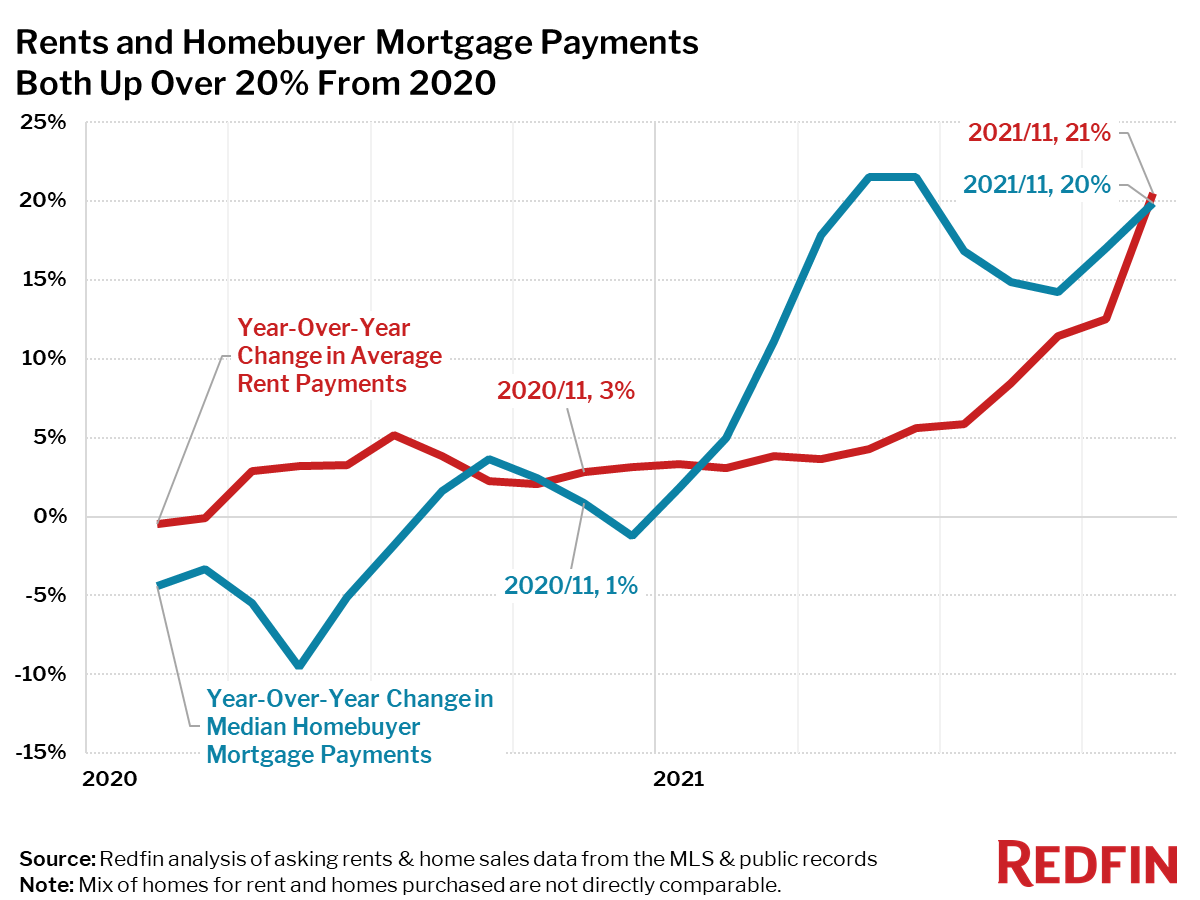
Rent-price increases outpaced mortgage payment increases for new homebuyers in 19 of the 50 largest metro areas in the U.S. during November.
Rents are Up Over 30% In Many Major Metro Areas
The 10 metro areas with the biggest increases in rent prices—up 28% year over year or more—were almost exclusively in Florida and New York. The exception is Austin, TX where rents were up 30%.
Top 10 Metro Areas With Fastest-Rising Rents Year Over Year
- Miami, FL (35%)
- Fort Lauderdale, FL (35%)
- West Palm Beach, FL (35%)
- New York, NY (34%)
- Newark, NJ (34%)
- Nassau County, NY (34%)
- New Brunswick, NJ (34%)
- Jacksonville, FL (33%)
- Austin, TX (30%)
- Tampa, FL (28%)
Only Kansas City & St. Louis saw rents decline year over year
- Kansas City, MO (-2.3%)
- St. Louis, MO (-0.3%)
Only two metro areas saw a decrease in rent in November compared to a year earlier: Rents fell 2% in Kansas City, MO and less than 1% in St. Louis, MO.
Year-Over-Year Change in Rents and Median Monthly Mortgage Payments for Homebuyers, November 2021
| Region | Average Rent | Year-Over-Year Change in Average Rent | Monthly Mortgage (5% down) | Year-Over-Year Change in Monthly Mortgage (5% down) | Difference Between Year-Over-Year Change in 5% Down Mortgage Payment & Rent |
|---|---|---|---|---|---|
| Anaheim, CA | $3,422 | 11.7% | $3,779 | 22.2% | 11 pts |
| Atlanta, GA | $2,035 | 15.6% | $1,414 | 28.6% | 13 pts |
| Austin, TX | $2,269 | 30.0% | $1,936 | 36.4% | 6 pts |
| Baltimore, MD | $2,072 | 17.8% | $1,333 | 6.2% | -12 pts |
| Boston, MA | $3,645 | 23.0% | $2,465 | 15.3% | -8 pts |
| Charlotte, NC | $1,807 | 15.6% | $1,463 | 26.3% | 11 pts |
| Chicago, IL | $2,360 | 8.9% | $1,172 | 12.5% | 4 pts |
| Cincinnati, OH | $1,415 | 18.5% | $988 | 15.6% | -3 pts |
| Cleveland, OH | $1,336 | 5.6% | $757 | 11.2% | 6 pts |
| Columbus, OH | $1,433 | 9.8% | $1,111 | 18.1% | 8 pts |
| Dallas, TX | $2,070 | 27.6% | $1,540 | 23.0% | -5 pts |
| Denver, CO | $2,700 | 17.1% | $2,178 | 21.8% | 5 pts |
| Detroit, MI | $1,577 | 12.4% | $727 | 16.9% | 5 pts |
| Fort Lauderdale, FL | $2,983 | 35.0% | $1,455 | 18.4% | -17 pts |
| Fort Worth, TX | $2,070 | 27.6% | $1,313 | 27.0% | -1 pts |
| Houston, TX | $1,800 | 12.7% | $1,271 | 21.5% | 9 pts |
| Indianapolis, IN | $1,293 | 10.5% | $1,010 | 16.0% | 6 pts |
| Jacksonville, FL | $1,627 | 33.5% | $1,313 | 26.0% | -7 pts |
| Kansas City, MO | $1,388 | -2.3% | $1,091 | 12.2% | 14 pts |
| Las Vegas, NV | $1,798 | 23.2% | $1,596 | 28.0% | 5 pts |
| Los Angeles, CA | $3,422 | 11.7% | $3,294 | 17.6% | 6 pts |
| Miami, FL | $2,983 | 35.0% | $1,697 | 24.7% | -10 pts |
| Milwaukee, WI | $1,923 | 21.6% | $1,071 | 14.8% | -7 pts |
| Minneapolis, MN | $1,865 | 6.6% | $1,374 | 14.0% | 7 pts |
| Montgomery County, PA | $2,243 | 13.1% | $1,576 | 14.2% | 1 pts |
| Nashville, TN | $1,794 | 8.9% | $1,596 | 22.5% | 14 pts |
| Nassau County, NY | $3,751 | 34.3% | $2,348 | 13.5% | -21 pts |
| New Brunswick, NJ | $3,751 | 34.3% | $1,718 | 16.2% | -18 pts |
| New York, NY | $3,751 | 34.3% | $2,598 | 14.0% | -20 pts |
| Newark, NJ | $3,751 | 34.3% | $1,823 | 8.8% | -26 pts |
| Oakland, CA | $3,375 | 9.9% | $3,677 | 12.6% | 3 pts |
| Orlando, FL | $2,023 | 27.7% | $1,414 | 24.6% | -3 pts |
| Philadelphia, PA | $2,243 | 13.1% | $1,083 | 13.7% | 1 pts |
| Phoenix, AZ | $2,016 | 21.5% | $1,738 | 32.6% | 11 pts |
| Pittsburgh, PA | $1,637 | 3.0% | $852 | 14.1% | 11 pts |
| Portland, OR | $2,373 | 27.5% | $2,081 | 18.9% | -9 pts |
| Providence, RI | $2,175 | 8.4% | $1,536 | 19.7% | 11 pts |
| Riverside, CA | $2,621 | 17.9% | $2,097 | 23.2% | 5 pts |
| Sacramento, CA | $2,565 | 21.0% | $2,223 | 21.1% | 0 pts |
| San Antonio, TX | $1,309 | 2.3% | $1,233 | 23.0% | 21 pts |
| San Diego, CA | $3,049 | 10.4% | $3,132 | 22.0% | 12 pts |
| San Francisco, CA | $3,375 | 9.9% | $6,579 | 18.3% | 8 pts |
| San Jose, CA | $3,296 | 8.3% | $5,591 | 19.8% | 12 pts |
| Seattle, WA | $2,844 | 24.9% | $2,889 | 18.0% | -7 pts |
| St. Louis, MO | $1,443 | -0.3% | $909 | 12.4% | 13 pts |
| Tampa, FL | $2,065 | 28.4% | $1,336 | 27.3% | -1 pts |
| Virginia Beach, VA | $1,663 | 17.9% | $1,152 | 9.7% | -8 pts |
| Warren, MI | $1,577 | 12.4% | $1,061 | 13.7% | 1 pts |
| Washington, DC | $2,544 | 12.5% | $2,000 | 14.1% | 2 pts |
| West Palm Beach, FL | $2,983 | 35.0% | $1,616 | 29.9% | -5 pts |
| National | $1,985 | 20.6% | $1,551 | 19.9% | -1 pts |
Methodology
Redfin’s rent-versus-own analysis uses data from more than 20,000 apartment buildings across the US. The report combines rental data on all sizes of apartments for rent with home sales data on all residential home sales (single-family, townhouse and condos) from public records and the multiple listing service (MLS). When this report refers to the median mortgage payment for new homebuyers, it is based on a 5% down payment, the median sale price during the month and the average mortgage interest rate for the month. The report uses a 5% down payment in order to be comparable to what an average renter may be able to reasonably achieve in savings.
Redfin analyzed home sales data from the MLS, and public records and rent prices from RentPath, across the 50 largest metro areas in the US. Monthly rental prices in this report are not directly comparable to monthly homebuyer mortgage payments, since the mix of homes available to rent and the mix of homes being purchased differ in location, size and quality of home within each metro area. For example, most of the homes being purchased may be in the less expensive suburbs of the metropolitan area, while the apartments being rented may be closer to the more expensive city core.
It is also important to note that the prices in this report reflect the current costs of new leases and new mortgages during each time period. In other words, the average rent of $3,343 in the Anaheim“>Anaheim metro area is not the average of what all renters are paying, but the average cost of apartments that were available for new renters during August 2021. Likewise, the median monthly mortgage payment of $3,570 in Anaheim“>Anaheim was only for homes that sold during the month of August 2021, not for all homeowners.