
Home-value growth has accelerated in suburbs and flatlined in cities, and suburban housewives have become more rare.
The American suburbs have become more racially and ethnically diverse and more Democratic over the last decade. To understand the changing demographics of the suburbs, we analyzed data from the U.S. Census, along with Redfin’s housing market data and voting margins from the last three presidential elections. Key findings include:
- People of color made up 28% of the suburban population nationwide in 2018, up from 26.2% in 2010, driven by 15.3% more people of color living in the suburbs over that time period. People of color made up 37.6% of the city population nationwide in 2018, flat from 37.7% in 2010; 5.2% more white people live in the suburbs than a decade ago.
- People of color made up 40.2% of the suburban population of Las Vegas in 2018, up from 30.5% in 2010, the biggest increase of any major U.S. metro. It’s followed by Salt Lake City and Seattle.
- The Democratic presidential candidate won by 13.2 percentage points in the suburbs in 2020, up from 7.2 points in 2016 and 5.9 points in 2012. In cities, the Democratic presidential candidate won by 14.7 points in 2016 and 14.9 points in 2012 (full 2020 data for cities was not yet available for this report).
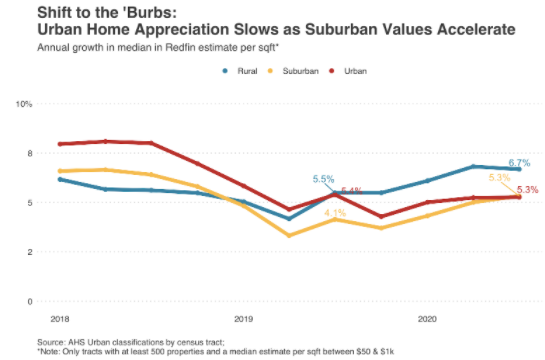
- Price per square foot of homes in the suburbs increased 5.3% year over year in the third quarter of 2020, compared with 4.2% in the third quarter of 2019. In urban areas, price per square foot rose 5.3% year over year in the third quarter, compared with 5.4% in the third quarter of last year.
- The suburbs are becoming more dense; the number of people per square mile grew 5.1% from 2010 to 2018. In cities, the number of people per square mile grew 4.4% over the same time period.
- 36.8% of women living in the suburbs were “suburban housewives” in 2018, down from 39.5% in 2010. 32.8% of women in cities were “housewives” in 2018, down from just 35.4% in 2010.
The suburbs are becoming more racially and ethnically diverse; cities are not
People of color made up 28% of the suburban population in 2018, up from 26.2% in 2010. That 1.8 percentage-point change is small but meaningful, driven by 15.3% more people of color living in the suburbs than there were a decade ago. For comparison, 5.2% more white people live in the suburbs than a decade ago. The increase in people of color living in the suburbs is part of the reason the suburbs became more Democratic over the last decade. People of color tend to vote for Democrats to a greater degree than white people, with preliminary election-day data from The New York Times showing that 87% of Black Americans and 65% of Hispanic/Latino Americans voted for Joe Biden, versus 41% of white Americans.
People of color made up 37.6% of the population of cities nationwide in 2018, flat from 37.7% in 2010, with a 6.1% increase in the number of people of color living in cities. Most of the data in this report is from the U.S. Census; 2018 is the most recent publicly available data.
The legacy of racist housing covenants is gradually shrinking, though racism still exists in the real estate industry. Racist covenants making it illegal to sell homes to people who weren’t white were common in housing deeds and ubiquitous in the suburbs through the first half of the 20th century. Take Levittown, the nation’s first suburb. Only white people were allowed to buy homes in the Long Island, NY community when it was founded in the 1940s. Although the U.S. Supreme Court declared racially restrictive covenants unenforceable in 1948 and the 1968 Fair Housing Act officially outlawed them, the community continued to discriminate against people of color, as outlined in a 2019 Newsday investigation about discrimination in the Long Island real estate community. Levittown has diversified slightly in recent years, with the share of Black residents rising from 0.5% in 2000 to 1.4% in 2017 and the share of Hispanic residents rising 7.8% to 14.6%.
“I haven’t felt racial discrimination any of the three times I’ve purchased homes in the last six years,” said Redfin chief economist Daryl Fairweather. “My parents had a much different experience in the 80s when they were looking for a home in Montecito, CA, a suburb of Santa Barbara. My mother toured houses without my dad because she learned she had a better chance of her offer being accepted as a white woman than as part of a biracial couple. One seller even took her home off the market to avoid selling to my parents after seeing my Black father. Although my family is just one example and racism in housing still exists, the country has made progress in just one generation.”
Several other factors have also contributed to suburban neighborhoods becoming more racially and ethnically diverse over the last decade while cities have not, including big coastal cities like New York and San Francisco becoming prohibitively expensive.
Demographics of the American Suburbs, 2010 versus 2018
| Suburbs, 2010 | Suburbs, 2018 | Cities, 2010 | Cities, 2018 | |
|---|---|---|---|---|
| Share of population who are people of color | 26.2% | 28.0% | 37.7% | 37.6% |
| Share of population who are white | 73.8% | 72.0% | 62.3% | 62.4% |
| Share of women who are “suburban housewives” | 39.5% | 36.8% | 35.4% | 32.8% |
| Share of population who are immigrants | 14.9% | 15.7% | 16.4% | 16.9% |
| Population density (people per square mile) | 3,498 | 3,676 (+5.1% from 2010) | 16,683 | 17,415 (+4.4% from 2010) |
| Housing density (homes per square mile) | 1,449 | 1,473 (+1.7% from 2010) | 8,211 | 8,776 (+6.9% from 2010) |
| Share of population between 18 and 35 years old | 22.9% | 23.0% | 28.4% | 28.7% |
| Democratic margin (Voters supported the Democratic presidential candidate over the Republican by this percentage-point margin) | +7.2 pts. (2016 election) | +13.2 pts. (2020 election) | +14.7 pts. (2016 election) | Unknown (insufficient data for 2020 election as of time of publication). |
With the coronavirus pandemic and a shift toward remote work, many Americans—especially tech employees—are moving from city centers to suburbs and rural areas, which could mean the share of white suburban residents is growing, as the plurality of tech workers are white. The most recent data available for this report is from 2018, which means we don’t yet know the impact of pandemic-driven migration on the diversity of the suburbs.
The suburbs of Las Vegas, Salt Lake City and Seattle saw the biggest increases in the share of people of color
The suburbs of Las Vegas diversified most out of the 100 most populous U.S. metro areas over the last decade, with people of color making up 40.2% of the suburban population in 2018, up from 30.5% in 2010. It’s followed by Salt Lake City (19% of suburban residents in 2018 were people of color, up from 11.8% in 2010) and Seattle (31.3% of suburban residents in 2018 were people of color, up from 25.7% in 2010).
In the Las Vegas and Salt Lake City metros—not limited to suburbs—the increase in people of color was driven by those who chose “some other race” other than white, Black, Asian, American Indian or Native Hawaiian in the U.S. Census survey. In Las Vegas, 11.5% of the metro population chose “some other race” in 2018, up from 6.7% in 2010; in Salt Lake City “some other race” went from 3.9% to 9.2%. The share of both Black and Asian people in each metro increased by fewer than 1.5 percentage points. In the Seattle metro—not limited to suburbs—the uptick in people of color from 2010 to 2018 was driven more by an increase in the share of Asian residents (11.1% in 2010 to 13.3% in 2018) than Black residents (5.4% in 2010 to 5.7% in 2018).
“A place called ‘Silicon Slopes’ has emerged at the southern end of the Salt Lake City area, bringing in a diverse set of tech workers from all over the country,” said local Redfin broker Ryan Aycock. “Companies like eBay, Adobe and Intel have set up new offices in the Salt Lake City suburbs over the last 15 years, attracting workers from the Bay Area, Seattle, New York and other cities. People can find a 4,000-square-foot home on a half-acre lot in the suburbs around here for less than their monthly rental payments for small apartments in their home cities. With median sales pricing below $400,000, Salt Lake City is an attractive option for many buyers. The influx of tech workers is bringing more cultures into the Salt Lake City suburbs.”
Salt Lake City and its suburbs have historically been heavily white and Mormon.
Top 10 Metro Areas Where Suburbs Have Become More Diverse, 2010-2018
| Metro area | Increase in share of people of color living in the suburbs, 2010-2018 (percentage points) | Share of people of color living in the suburbs, 2010 | Share of people of color living in the suburbs, 2018 |
|---|---|---|---|
| Las Vegas, NV | 9.7 pts. | 30.5% | 40.2% |
| Salt Lake City, UT | 7.2 pts. | 11.8% | 19% |
| Seattle, WA | 5.6 pts. | 25.7% | 31.3% |
| San Francisco, CA | 5.5 pts. | 44.2% | 49.7% |
| Providence, RI | 5.3 pts. | 14.9% | 20.2% |
| Memphis, TN | 5.1 pts. | 27.8% | 32.8% |
| Baltimore, MD | 4.6 pts. | 29.9% | 34.6% |
| Santa Rosa, CA | 4.6 pts. | 18.3% | 22.9% |
| Richmond, VA | 4.6 pts. | 35.7% | 40.3% |
| Jackson, MS | 4.5 pts. | 39.7% | 44.2% |
McAllen, TX; Corpus Christi, TX and Oxnard, CA saw their suburbs become more white over the last decade, more so than any of the other 100 most populous metros in the nation. White residents made up 89.7% of the suburban population in McAllen in 2018, up from 75.2% in 2010. The share went from 83.2% to 92.9% in Corpus Christi and 73.2% to 81.4% in Oxnard.
Metro Areas Where Suburbs Have Become Less Diverse, 2010-2018
| Metro area | Increase in share of white residents in the suburbs, 2010-2018 (percentage points) | Share of white residents in the suburbs, 2010 | Share of white residents in the suburbs, 2018 |
|---|---|---|---|
| McAllen, TX | +14.4 pts. | 75.2% | 89.7% |
| Corpus Christi, TX | +9.7 pts. | 83.2% | 92.9% |
| Oxnard, CA | +8.2 pts. | 73.2% | 81.4% |
| Albuquerque, NM | +7.6 pts. | 69.7% | 77.2% |
| Bakersfield, CA | +6.9 pts. | 73.7% | 80.5% |
| Austin, TX | +3.8 pts. | 75.2% | 78.9% |
| Houston, TX | +2.2 pts. | 69.7% | 71.9% |
| Winston-Salem, NC | +2.2 pts. | 63.6% | 65.8% |
| Modesto, CA | +1.7 pts. | 74.4% | 76.2% |
| Fresno, CA | +1.6 pts. | 69.0% | 70.6% |
The Democratic margin in the suburbs increased by 6 percentage points from 2016 to 2020
Nationwide, voters in the American suburbs chose Joe Biden in the 2020 presidential election by a margin of 13.2 percentage points, up from a 7.2 percentage-point margin for Hillary Clinton in 2016 and a 5.9-point margin for Barack Obama in 2012.
Voters in the Denver suburbs chose Joe Biden by a margin of 16.2 percentage points, up from a margin of 5.7 points in 2016, making it the metro with the biggest uptick in suburban voters who chose the Democratic candidate over the last four years. It’s followed by the suburbs of Dallas (+8.9 pts. Dem), Richmond, VA (+8 pts. Dem), Boston (+7.7 pts. Dem) and Austin (+7.7 pts. Dem). We analyzed the 100 most populous metro areas.
Top 10 Metro Areas Where Suburbs Have Become More Democratic, 2016-2020
| Metro area | Increase in Democratic margin, 2016-2020 (percentage points) | Voters chose the 2016 Democratic presidential candidate by this many percentage points | Voters chose the 2020 Democratic presidential candidate by this many percentage points |
|---|---|---|---|
| Denver, CO | +10.8 pts. | 5.1 pts. | 16.7 pts. |
| Dallas, TX | +8.9 pts. | -5 pts. (chose the Republican candidate) | 3.1 pts. |
| Richmond, VA | +8 pts. | 6.7 pts. | 14.5 pts. |
| Austin, TX | +7.7 pts. | 26 pts. | 32.8 pts. |
| Minneapolis, MN | +7.6 pts. | 21.5 pts. | 28.6 pts. |
| Kansas City, MO-KS | +7.3 pts. | -2.1 pts. (chose the Republican candidate) | 5.1 pts. |
| Indianapolis, IN | +7.2 pts. | -2.5 pts. (chose the Republican candidate) | 6 pts. |
| Atlanta, GA | +7.1 pts. | 23.4 pts. | 30.5 pts. |
| Bridgeport, CT | +7 pts. | 20.3 pts. | 27.3 pts. |
| Santa Rosa, CA | +6.7 pts. | 47.9 pts. | 54.6 pts. |
The Atlanta suburbs, where Joe Biden won by a margin of 30.5 percentage points, up from 23.4 points in 2016, helped flip Georgia blue for the first time in 28 years. The Atlanta suburbs have also become more racially and ethnically diverse over the last decade, with people of color making up 46.1% of the suburban population in 2018, up from 43.4% in 2010.
Gwinnett County, home to several Atlanta suburbs and the second-most populated county in Georgia, voted for Joe Biden by a margin of 18 percentage points in 2020, up from a 5.8-point Democratic margin in 2016.
“Gwinnett County used to be known for its reliably white, upper-middle class Republican voters, but it has become much more diverse, and it’s one of the places that is turning Georgia blue,” said local Redfin real estate agent Jackie Johnson. “People move to Gwinnett County from all over, including California, Washington, D.C., Chicago, Wisconsin and Tennessee choosing it over Atlanta because it offers the same amenities of a big city with a small-town feel. Plus, families can find more land for less money outside the city.”
Joe Biden outperformed Hillary Clinton in the Philadelphia and Pittsburgh suburbs by margins of 4.8 percentage points and 2.0 percentage points, respectively, helping flip Pennsylvania blue in 2020. Those suburbs have become more racially and ethnically diverse, with people of color making up 29% of suburban Philadelphia neighborhoods in 2018, up from 25.8% in 2010. People of color made up 13.4% of the Pittsburgh suburbs in 2018, up from 10.9%.
The suburbs of Dallas, Kansas City, Indianapolis, Birmingham, Cincinnati and Phoenix all flipped blue in 2020 after voting for Donald Trump in 2016.
For comparison, the Democratic margin in cities stayed roughly the same from 2012 to 2016 (there was not enough data available at the time of publication to report on the Democratic margin in cities for 2020), with voters in urban centers supporting Hillary Clinton by a margin of 14.7 points in 2016 and Barack Obama by 14.9 points in 2012.
Suburbs close to cities are more Democratic than farther-flung suburbs
“The changing demographics of the suburbs, including increased racial diversity, is one reason why they’re becoming more Democratic,” said Redfin economist Taylor Marr. “But there’s an important distinction between suburbs close to cities and those farther away. When Americans who are priced out of big cities move for more affordable housing, they tend to settle in nearby suburbs where they can still enjoy urban amenities, and those people tend to lean liberal. Farther-flung suburbs are more similar to rural areas, where people tend to lean conservative.”
Broken down between high-density and low-density suburbs, the Democratic margin grew by about 5 percentage points from the 2016 election to the 2020 election in high-density suburbs of large metro areas, according to a November 9 analysis of preliminary election results by Indeed chief economist Jed Kolko. President Trump beat Joe Biden in low-density suburbs of large metro areas, but by roughly 5 fewer percentage points in 2020 than 2016. Low-density suburbs are typically located further from urban areas than high-density suburbs.
Home-value growth is accelerating in the suburbs, stagnating in cities.
Home values are growing faster in the suburbs than in cities. Suburban home values increased 5.3% year over year to a median $208 per square foot in the third quarter, a significant jump from the 4.2% annual home-value growth posted in the third quarter of 2019, according to an analysis of Redfin Estimate data.
Meanwhile, home value growth in urban areas stagnated, posting a 5.3% annual increase to $249 per square foot in the third quarter, compared with 5.4% growth in the third quarter of 2019.
While a square foot’s value remains higher in urban areas, space in the suburbs is becoming more expensive as the pandemic continues. As the importance of commute times declines with the shift toward remote work, many Americans are moving to the suburbs in search of bigger homes and more outdoor space.
The national median sale price is higher in the suburbs than urban areas—$332,000 versus $286,000 in the four weeks ending November 9—because homes in the suburbs are larger. The typical suburban home has been more expensive than the typical urban home for at least the last four years.
The time period in this section, which goes through the third quarter of 2020, is different from the time period referenced in the rest of this report (2010-2018) because we are able to use Redfin’s current housing market data for prices.
The suburbs are becoming more dense
There were 3,676 people per square mile living in the suburbs in 2018, up 5.1% from 3,498 in 2010. Cities also became more dense, though the increase was slightly smaller: The population density was 17,415 people per square mile in 2018, up 4.4% from 16,683 in 2010.
“As many big coastal cities have grown too expensive for most Americans, people are spilling out into areas further away from city centers in search of affordable housing, resulting in more dense and more diverse suburban neighborhoods,” Fairweather said. The sprawl has changed some suburbs from bedroom communities into mini cities, with walkable restaurants and shops, and it’s changed the way we think about suburbs. Living near the center of a city is no longer so important, especially with the surge in remote work since the pandemic began.”
American suburbs also became slightly more dense in terms of housing, with 1,473 homes per square mile in 2018, up 1.7% from 1,449 in 2010. But the increase was bigger in cities, where there were 8,766 homes per square mile in 2018, up 6.9% from 8,211 in 2010.
“Today’s suburbs attract a few different types of residents—those who are actively searching for a quieter lifestyle and a single-family home, and those who are settling for the suburbs because they’re priced out of expensive cities,” Fairweather continued. “Like city governments, local suburban leaders should prioritize building housing and infrastructure to accommodate growth in the coming years.”
“Suburban housewives” are becoming less common
In 2018, 36.8% of women living in the suburbs were “suburban housewives,” down from 39.5% in 2010. The share has declined by roughly the same amount in cities, where 32.8% of women were “housewives” in 2018, down from 35.4% eight years earlier.
For this analysis, “suburban housewives” are defined as women from 20 to 64 years old with children under 18 who are not in the labor force and are not looking for employment.
The most recent data available from the U.S. Census is from 2018. Although the portion of women who stay home with their children declined from 2010 to 2018, it may be on the rise again in 2020 with the coronavirus pandemic. Working women have been disproportionately impacted by job losses during the pandemic-driven recession, and many mothers have chosen to leave their careers or put them on hold while schools and daycares are closed for in-person learning.
Methodology
For this analysis, suburbs are classified as places outside the principal city in a metropolitan area. More than half of Americans live in suburbs. Cities are classified as the principal city of a metropolitan area. Rural areas, which are classified as any place outside a metropolitan area, are excluded from this analysis. We used data from the U.S. Census for this analysis; the most recent data available is from 2018.


