
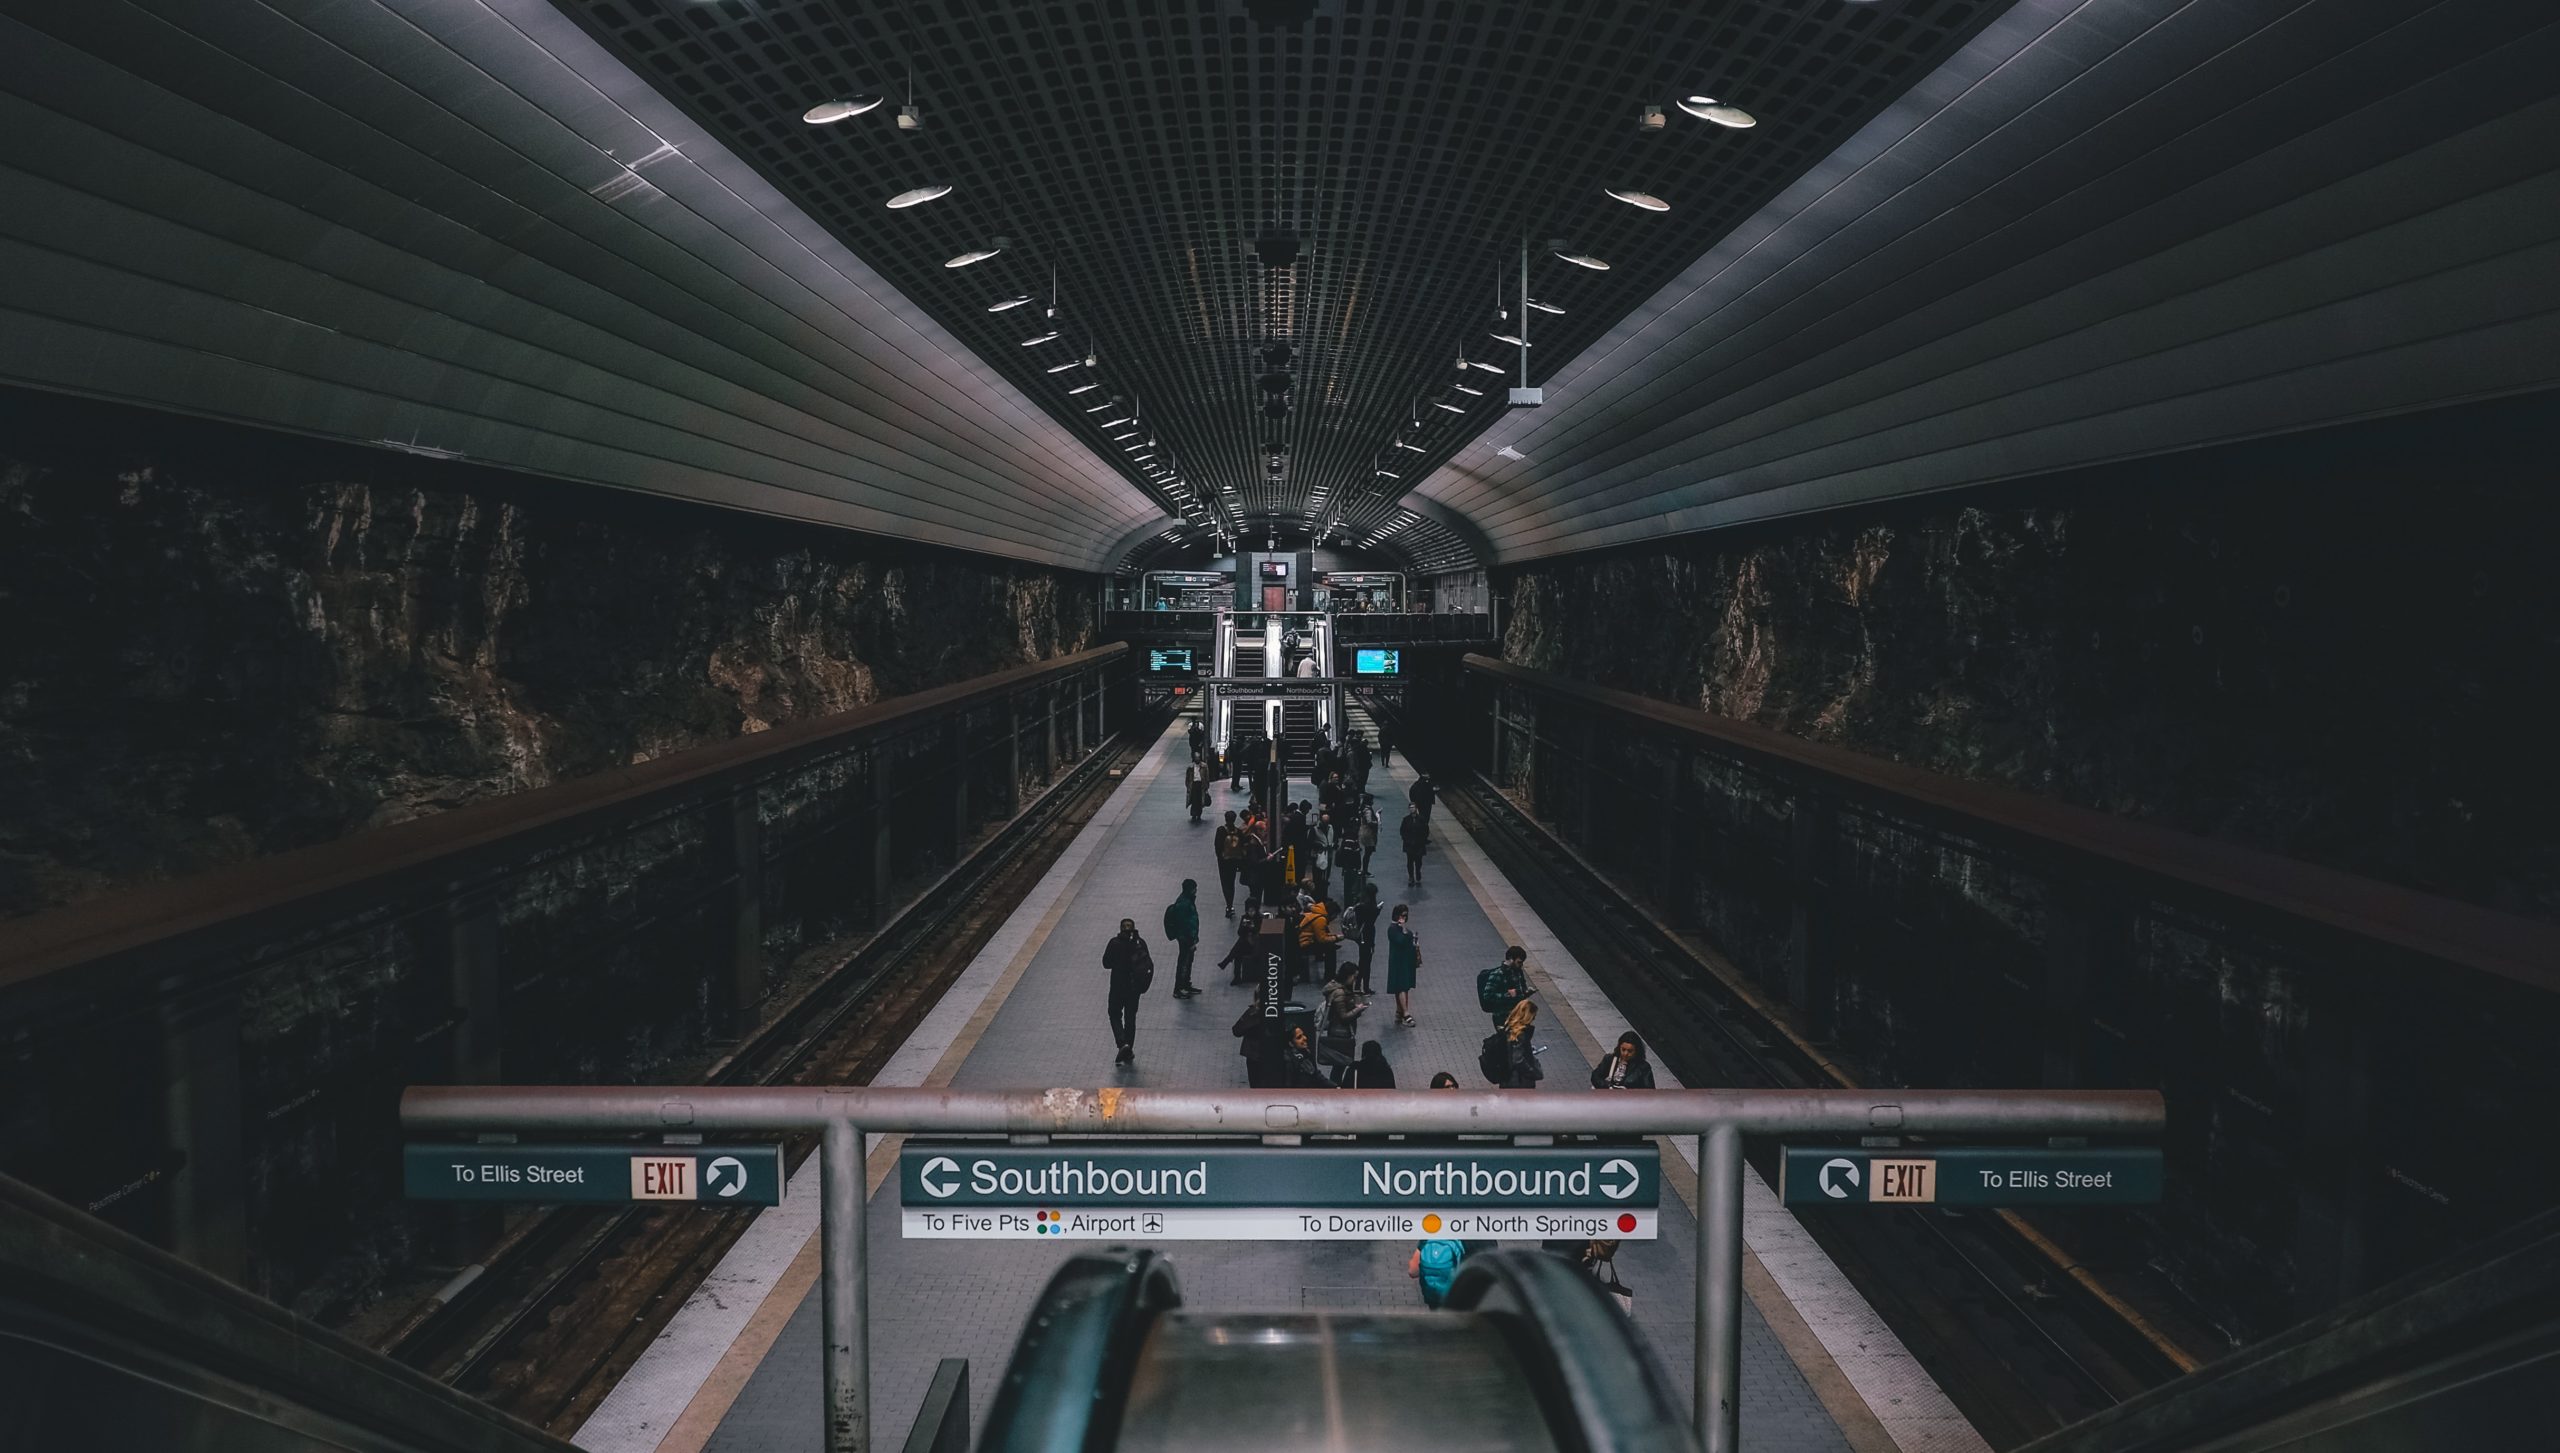
Racial diversity in neighborhoods with train stations remained high even decades after rail transit came to Atlanta and Los Angeles.
Improving transit access to a neighborhood does not lead to a significant decrease in minority populations, even as incomes and rents rise faster than similar neighborhoods without convenient transit. When a new rail transit stop is opened, long-term economic gains follow without a significant decrease in minority populations that is sometimes associated with gentrification. These findings are based on a Redfin analysis of 52 neighborhoods that contain 77 transit stations in three major metro areas (some neighborhoods had more than one station). Read similar: Redlining in Real Estate.
To see how demographics change with the addition of rail transit, we explored race, income and rent data in these three metro areas before and after the addition of rail transit lines:
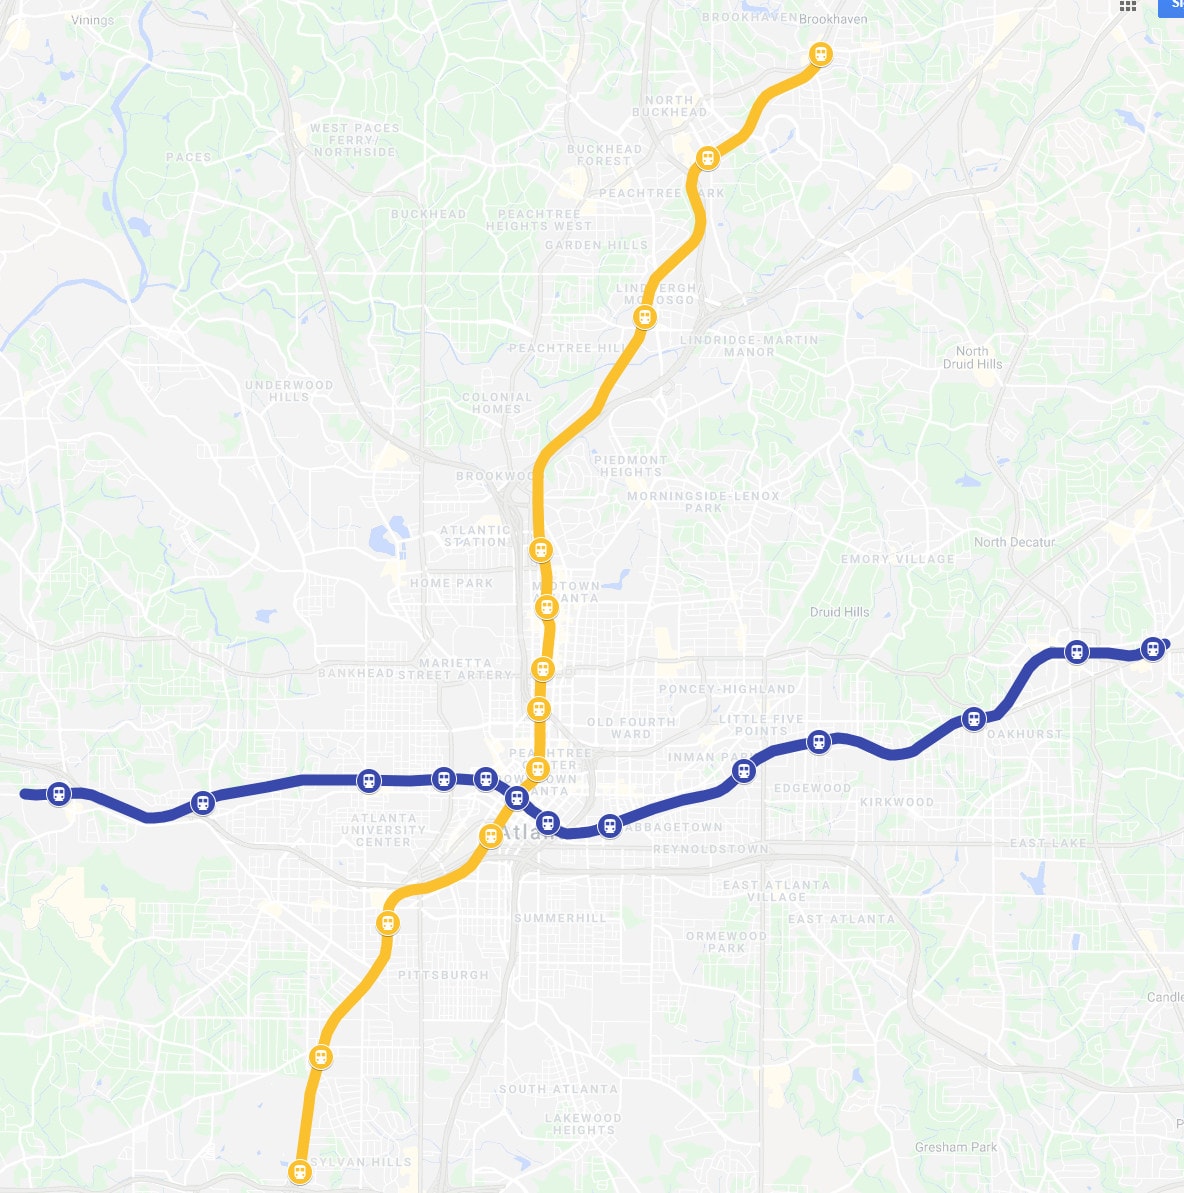
- Atlanta – MARTA train began service in 1979 with 25 stations opening along the blue line and the gold line between 1979 and 1984
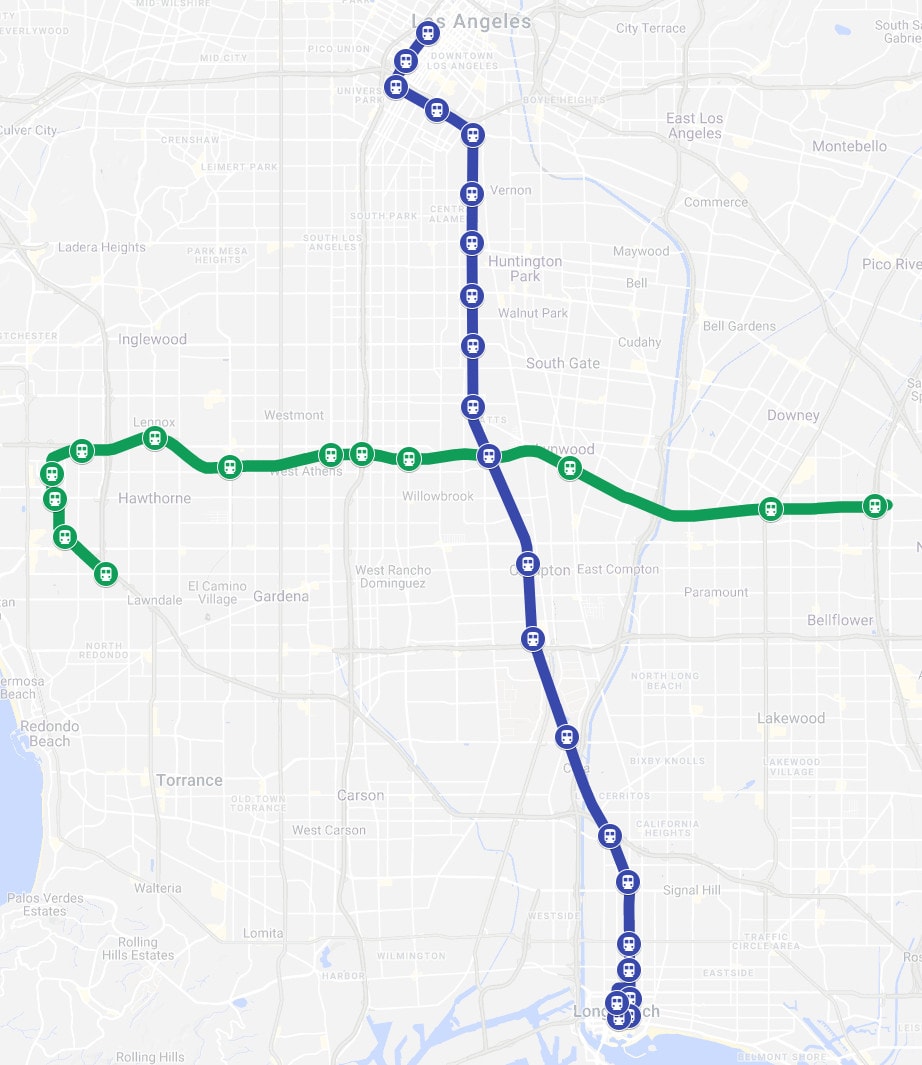
- Los Angeles – Metro train began service in 1990, with 39 stations opening along the blue line and the green line between 1990 and 1995
- Seattle – Link light rail began service in 2009, with 13 stations opening along the red line in the first year
We dug into economic and demographic trends in the neighborhoods where new transit stations opened. We also analyzed the same stats for a control group of five neighborhoods in each metro area (15 total) that were located at least 1.5 miles away from the nearest train station (well outside typical walking distance) and had similar racial and economic characteristics to the neighborhoods with train stations.
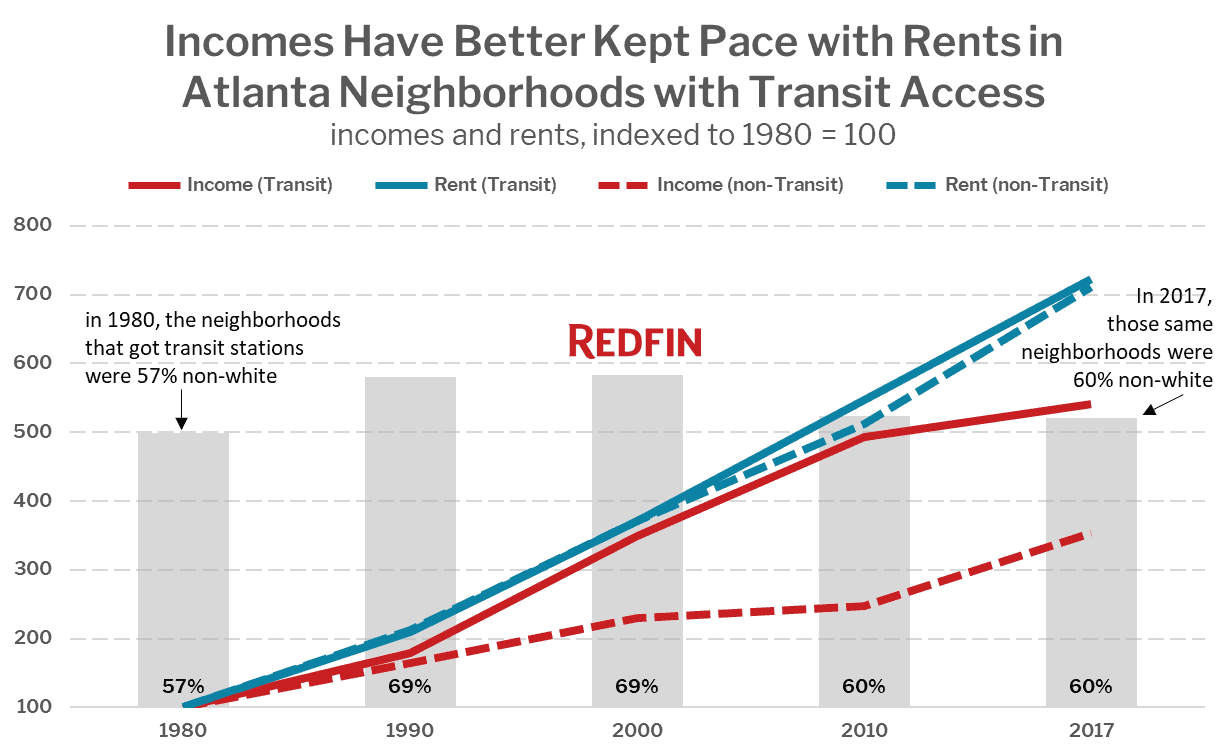
Between 1980 and 2017 in Atlanta neighborhoods that gained transit access:
- The non-white share of the population increased from 57% to 60%.
- Incomes increased 441%, compared to a gain of 253% in neighborhoods without transit access.
- Rents also increased 622%, compared to 611% in areas without transit access.
We found similar results in Los Angeles and Seattle.
“Public transportation is more than just moving people from point A to point B—it can be a powerful economic force,” said Redfin chief economist Daryl Fairweather. “Improving job access through convenient transit is one way urban planners can help make life better for people across the socioeconomic spectrum. Policies that promote dense affordable housing could mitigate the increase in rents associated with improvements in public transit. The fact that minority residents weren’t displaced by white residents as the neighborhoods we studied improved post-transit is quite encouraging because it shows that big infrastructure investments can have a positive return in terms of reducing racial inequality.”

We also considered home value data from the Census but did not include it in this analysis since that data is based only on homeowner estimates and rent is a better indicator of costs for working-class families whose outcomes are most relevant to this analysis.
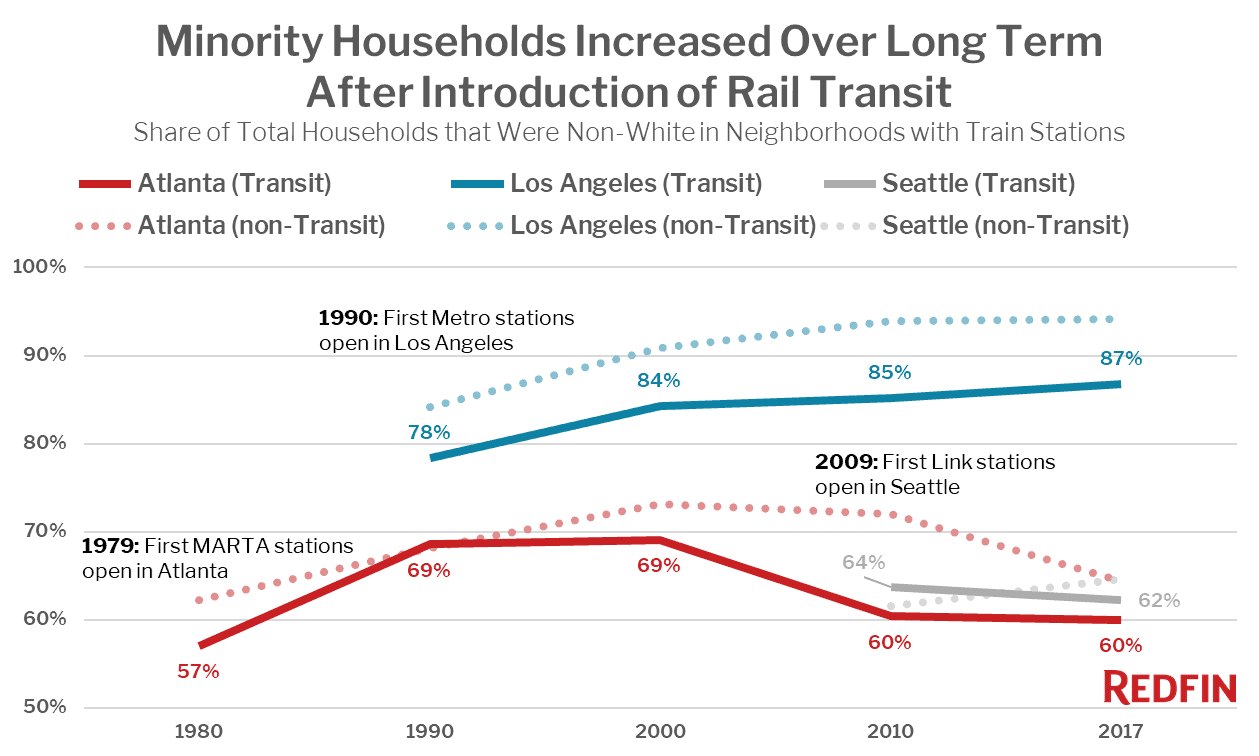
The Addition of New Rail Transit Has Not Led to a Significant Decrease in Diversity
In Atlanta, 57 percent of the households in neighborhoods that received train stations in the first five years of MARTA service were non-white. That share increased to 69 percent in 1990 and 2000 and fell to 60 percent in 2010 and 2017, still above the baseline level when the stations first opened. The control neighborhoods saw a similar pattern, rising from 62 percent non-white in 1980 to 73 percent in 2000, then back down to 64 percent in 2017.
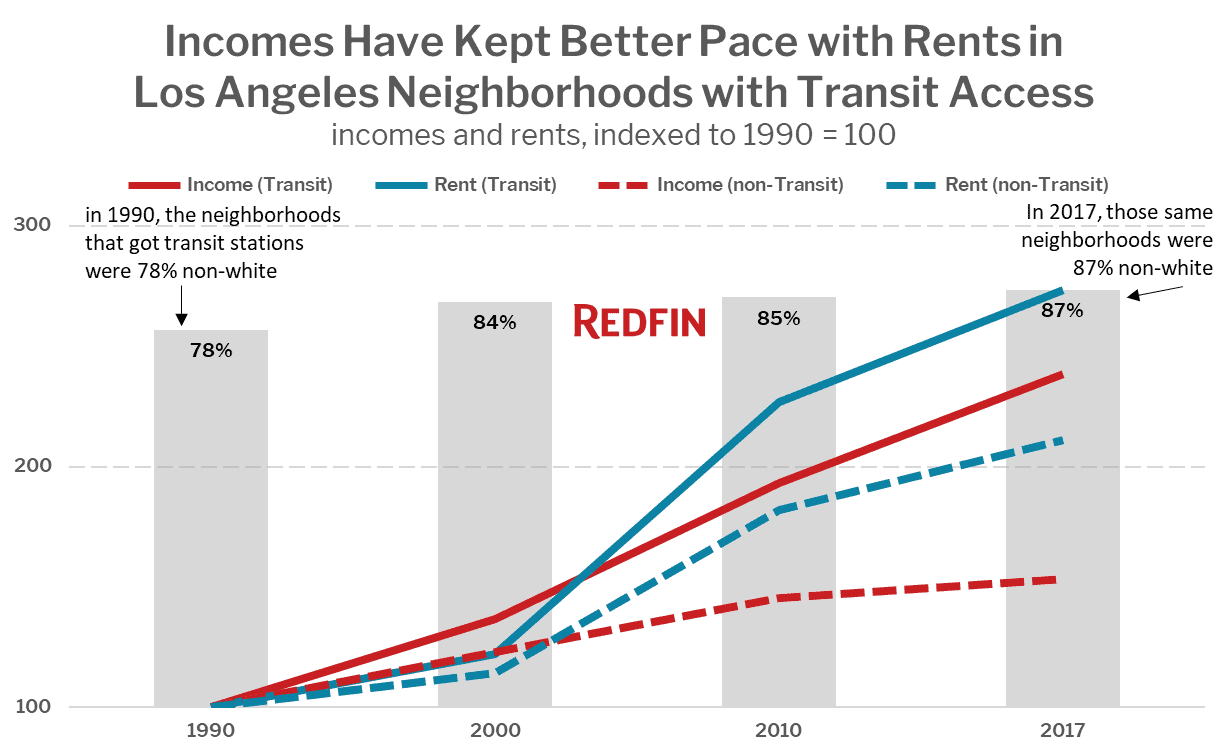
In Los Angeles, the share of non-white households in neighborhoods that gained train stations rose from 78 percent when Metro first opened in 1990 to 87 percent in 2017. The control neighborhoods likewise saw a steady increase in the share of non-white residents, rising from 84 percent in 1990 to 94 percent in 2017.
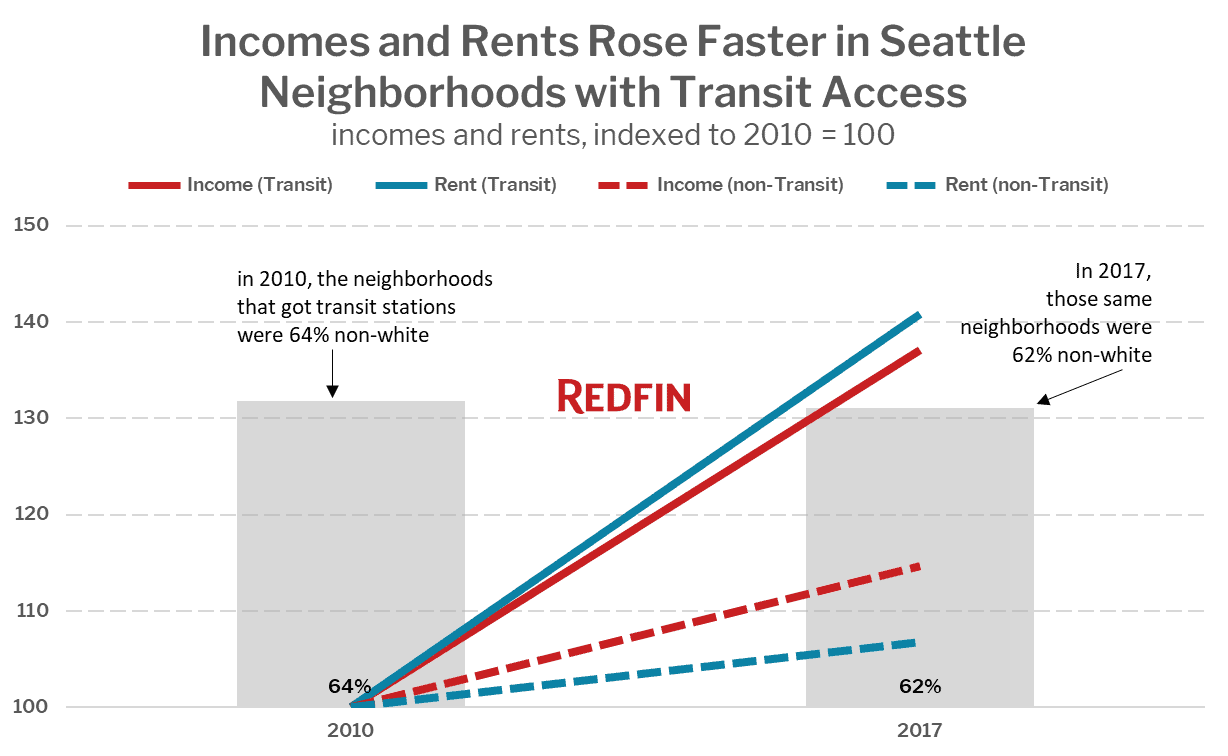
In Seattle, the share of non-white households has decreased slightly from 64 percent in 2010 to 62 percent in 2017. The control neighborhoods moved in the opposite direction, increasing from 62 percent non-white in 2000 to 65 percent in 2017. However, these changes were very small and this is also the metro area with the least amount of data available, so it is too early to say whether these movements represent the start of a trend or just a short-term aberration.
Share of Households that Were Non-White—Transit Neighborhoods and Control Neighborhoods
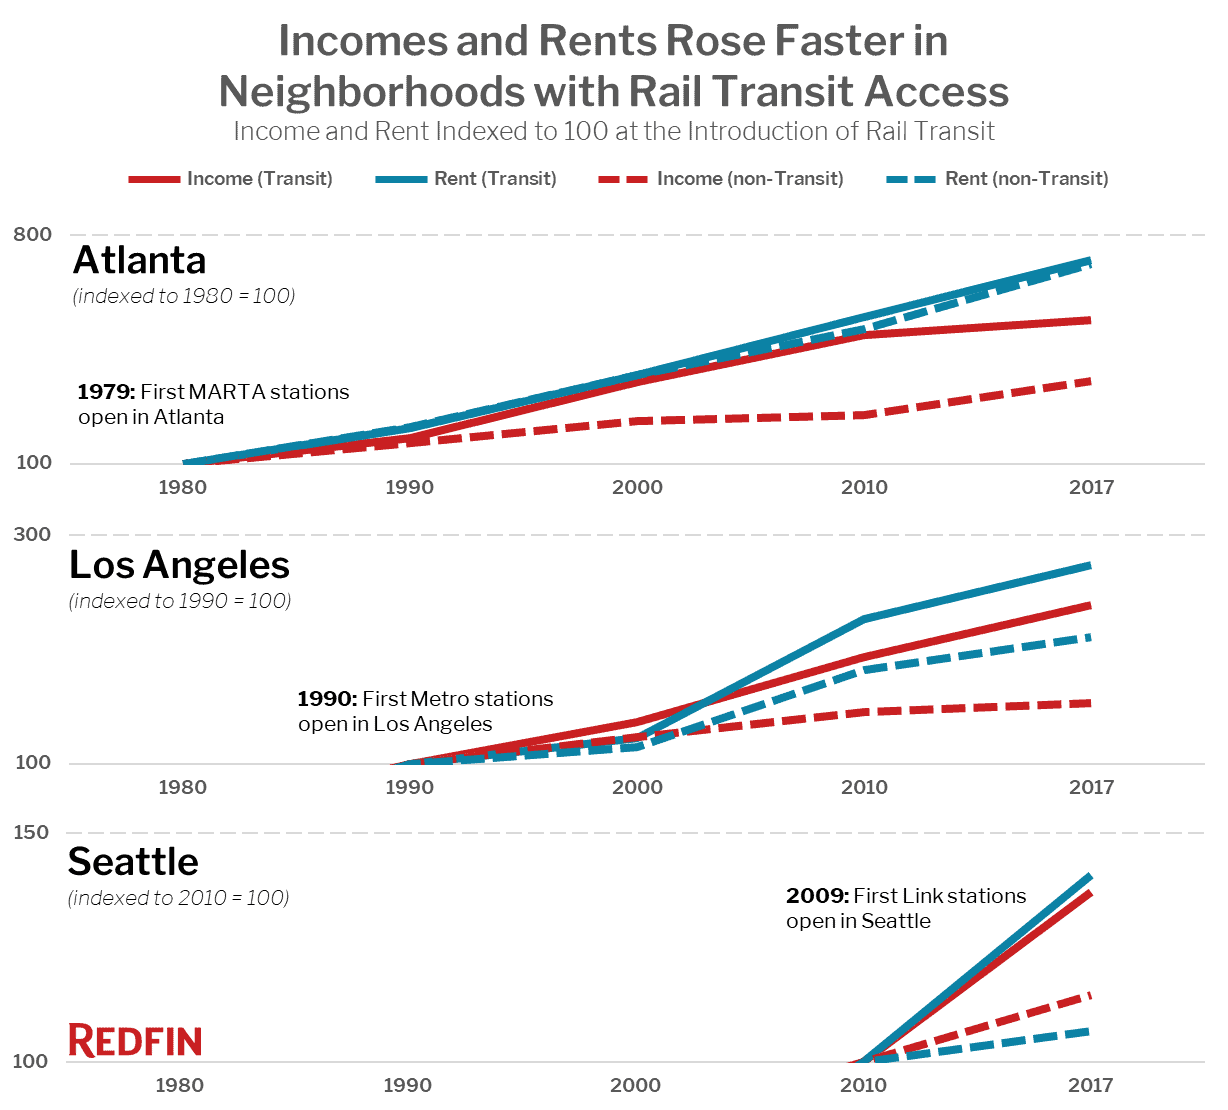
Incomes and Rents Rose Faster in Neighborhoods with Rail Transit Access
Minorities are not being edged out of neighborhoods in the wake of new rail transit, which is good since people who live near these new train stations are seeing their economic situation improve relative to similar neighborhoods in the same metro areas that lack trains.
Incomes in Atlanta neighborhoods with train stations increased 441 percent between 1980 and 2017, compared to just a 253 percent increase over the same time period in similar neighborhoods without transit access. In Los Angeles, neighborhoods near the train stops saw incomes rise 139 percent between 1990 and 2017, compared to just a 53 percent gain in the control group. In Seattle, incomes rose 37 percent between 2010 and 2017 in the neighborhoods with train stops, but just 15 percent in the control group without.
The flip side is that rents also increased faster in neighborhoods that gained transit access than those that didn’t. In Seattle, rents increased 41 percent in just seven years between 2010 and 2017 in the neighborhoods with train stations, and only 7 percent in the control group without. In Los Angeles, the neighborhoods with train stations saw rent increase 173 percent between 1990 and 2017, while the control group saw an increase of just 111 percent. Atlanta was the one exception where rents increased about the same amount between 1980 and 2017 in the transit neighborhoods (622%) and the control group (611%).
Incomes and Rents, Indexed to 100 When Transit First Arrived—Transit Neighborhoods and Control Neighborhoods
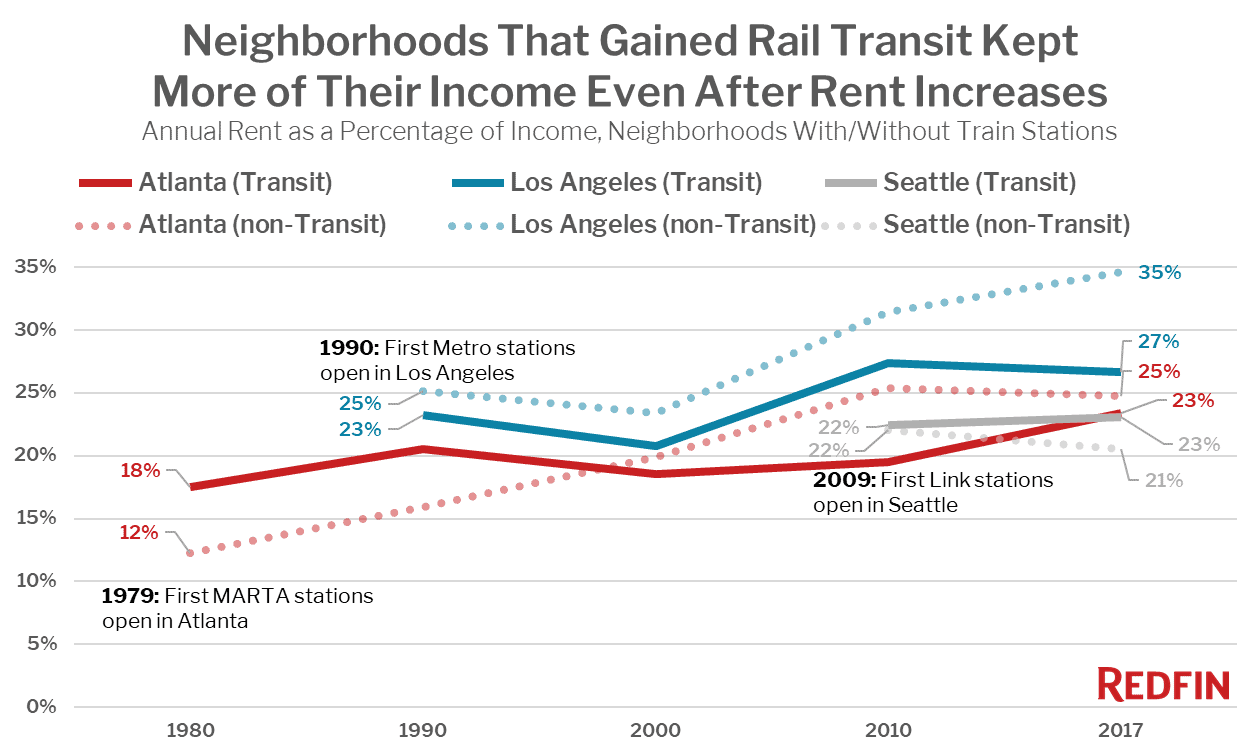
Residents in Neighborhoods with Rail Transit Access Kept More of Their Income Gains, Even After Rent Increases
When you look at annual rental costs as a percentage of annual income, you can see that in Atlanta and Los Angeles, the income gains in the transit neighborhoods kept closer pace with rent increases than what we saw in the non-transit neighborhoods.
In Atlanta, the annual rent in neighborhoods with train stations was 18 percent of income in 1980 and rose to 23 percent in 2017, compared to an increase from 12 percent of income in 1980 to 25 percent in 2017 for the control group.
In Los Angeles, rent in the transit-connected neighborhoods increased from 23 percent of income in 1990 to 27 percent in 2017, but the control group saw a much larger increase—from 25 percent in 1990 to 35 percent in 2017.
In dollar terms, that means that the typical household in a Los Angeles neighborhood that gained transit had an annual income in 1990 of $24,905 and spent $5,784 of it on rent, leaving $19,121 for other expenses. In 2017 the typical income in transit-connected neighborhoods had risen to $59,434 and annual rent had gone up to $15,828, for a remainder of $43,606. That is a $24,485 increase in post-rent income, a 128 percent gain. The typical household in a non-transit neighborhood saw its post-rent income increase over the same period by just $6,000—a 34 percent gain.
So far the same is not true of Seattle. Neighborhoods with transit saw rental costs increase just slightly from 22 percent of income in 2010 to 23 percent in 2017, but the cost of rent as a share of income in the control group actually fell from 22 percent in 2010 to 21 percent in 2017.
One possible reason we have not yet seen an advantage for newly-transit-connected neighborhoods in Seattle is that the time since the train began running has been a period of extreme economic expansion in Seattle, and with incomes and rents rising rapidly across the whole metro area, the benefits of transit are muted.
Rent as a Percent of Income—Transit Neighborhoods and Control Neighborhoods
Income Gains May Come from New Migration into Transit-Connected Neighborhoods
Other research suggests that neighborhoods with rail access tend to attract newcomers at a greater rate than non-transit-connected neighborhoods in the same metro area, which can lead to changes like the sharp increase in incomes that we found in most of the transit-connected neighborhoods. U.S. Census Bureau sociologist Brian McKenzie’s 2015 study of demographics in rail-accessible neighborhoods in the Washington, D.C. metro area found that:
Newcomers [to the Washington, D.C. metro area] have had a particularly strong effect on the demographic profiles of neighborhoods immediately surrounding rail stops. … In 2011-2013, 28.2 percent of all workers with rail access within the five-county area were recent movers, compared with 14.7 percent of workers for households without rail access.
Although it is likely that the access to high-paying jobs in the city center that comes with the addition of new transit is a boon to existing residents of a neighborhood, it is also clear that it attracts newcomers as well. Further research is needed to determine how the economic gains discussed above are distributed among existing residents versus newcomers.
Rail Transit Expansion is a Powerful Economic Weapon for Good
In general, the addition of transit seems to be a net positive for a neighborhood. Many of the neighborhoods that gained rail transit access were relatively diverse, and in the decades after the train stops opened there, they saw a stronger boost in incomes than other similar areas without transit, even while remaining diverse. This is likely due to increased access to high-paying jobs in metro job centers as well as in-migration of people who already hold these high-paying jobs.
However, as incomes rise more quickly in these areas rents also rise in kind. When residents see their incomes rise and newcomers with higher incomes move into the neighborhood, attracted by quality transit, housing costs increase in tandem with incomes. Even so, households in transit-connected neighborhoods are better off than those in similar neighborhoods without transit.
We can’t tell whether it is specifically long-time residents of an area that reap the benefit of economic expansion in these neighborhoods, but all things being equal, neighborhoods that gain transit access do see their economic trajectory changed for the better compared to similar areas without transit.
These effects are important to keep in mind as policy-makers make plans and budgets for transportation infrastructure. One way that depressed areas could see their economic fortunes improved is to connect them to the city core via rail. As existing rail systems are expanded and new systems built, it’s a good reason to be thoughtful about exactly where these benefits could do the most good.
Maps & Data Tables
Atlanta, GA – MARTA Blue and Gold Lines as of 1984
Atlanta Income and Housing Statistics for Neighborhoods where MARTA Stations Opened 1979-1984, plus control group
| Year | Income | Rent | Home Value | Percent Non-White | ||||
|---|---|---|---|---|---|---|---|---|
| Transit | Control | Transit | Control | Transit | Control | Transit | Control | |
| 1980 | $9,877 | $14,008 | $144 | $143 | $43,187 | $28,080 | 57.0% | 62.3% |
| 1990 | $17,670 | $22,962 | $302 | $305 | $94,269 | $64,125 | 68.6% | 68.1% |
| 2000 | $34,511 | $32,138 | $534 | $532 | $187,326 | $125,525 | 69.1% | 73.1% |
| 2010 | $48,653 | $34,680 | $790 | $734 | $219,160 | $203,225 | 60.4% | 72.1% |
| 2017 | $53,404 | $49,494 | $1,042 | $1,020 | $225,069 | $246,700 | 60.0% | 64.4% |
Los Angeles, CA – Metro Blue and Green Lines as of 1995
Los Angeles Income and Housing Statistics for Neighborhoods where Metro Stations Opened 1990-1995, plus control group
| Year | Income | Rent | Home Value | Percent Non-White | ||||
|---|---|---|---|---|---|---|---|---|
| Transit | Control | Transit | Control | Transit | Control | Transit | Control | |
| 1990 | $24,905 | $23,582 | $482 | $494 | $162,239 | $150,899 | 78.4% | 84.2% |
| 2000 | $34,071 | $28,990 | $589 | $564 | $144,500 | $161,149 | 84.2% | 90.8% |
| 2010 | $48,066 | $34,316 | $1,095 | $899 | $375,277 | $312,917 | 85.2% | 93.9% |
| 2017 | $59,434 | $36,170 | $1,319 | $1,043 | $353,416 | $334,900 | 86.8% | 94.2% |
Seattle, WA – Link Red Line as of 2009
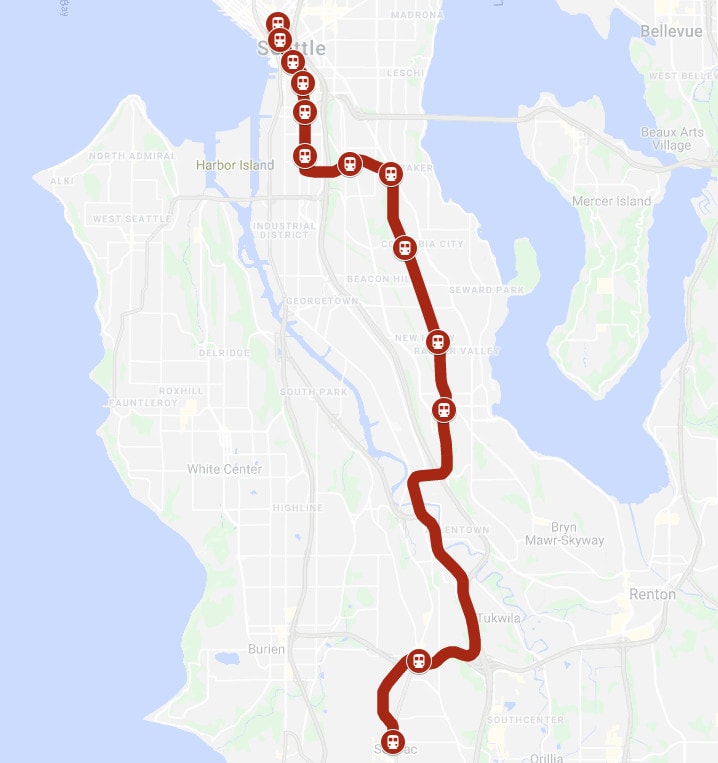
Seattle Income and Housing Statistics for Neighborhoods where Link Stations Opened in 2009, plus control group
| Year | Income | Rent | Home Value | Percent Non-White | ||||
|---|---|---|---|---|---|---|---|---|
| Transit | Control | Transit | Control | Transit | Control | Transit | Control | |
| 2010 | $47,590 | $54,343 | $890 | $999 | $341,740 | $276,550 | 63.7% | 61.6% |
| 2017 | $65,260 | $62,345 | $1,253 | $1,067 | $414,700 | $284,725 | 62.2% | 64.6% |
Methodology
We collected the following Census data from the 1980, 1990, 2000, and 2010 Censuses as well as the 2017 American Community Survey data from the Census Bureau for each Census Tract that contained a transit stop that opened within the first five years of the transit line in each metro area, as well as a selection of Census Tracts in the same metro area with similar demographic characteristics at the time of the transit opening.
Data collected:
- percent of households white
- percent of households black
- percent of households hispanic
- median household income
- median home value of occupied homes
- median rent of occupied homes


