
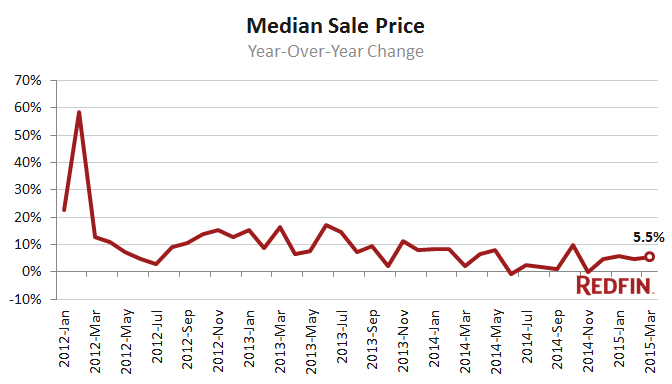
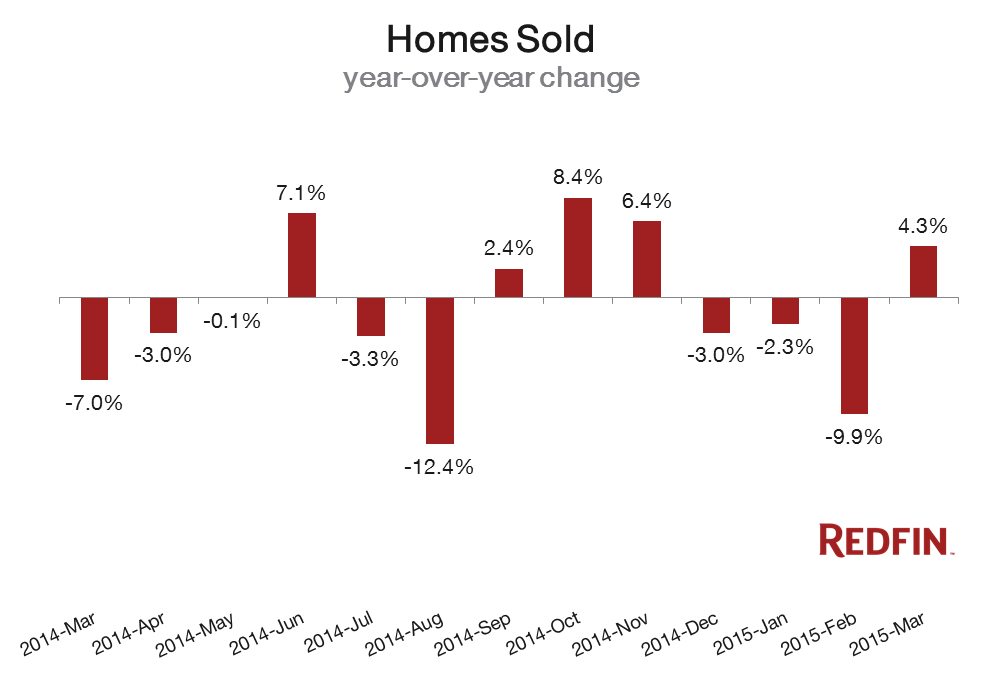
Home values rose 5.5 percent in March from a year ago and sales picked up by 4.3 percent as the city began its spring thaw after a three-month winter slowdown.
The city’s median sale price reached $500,000, a slight increase from February and up from $465,000 a year ago. Congress Heights and Capitol Hill were among neighborhoods showing especially big price gains. More than a third of homes sold above their asking price.
Although more properties came on the market citywide in March, buyers continue to be challenged by a lack of inventory. There were 967 new listings, a 6.9 percent increase from last March, but in all there were still fewer houses, condominiums and co-ops to chose from than there were a year ago. Last month, 585 properties traded hands, but with only 1,109 units on the market, the city had less than two months’ supply of homes for sale. That’s far below the six months of inventory that signals a balanced market.
That’s one reason half of all District properties sold in less than two weeks. In many neighborhoods, including Eckington, Dupont Circle, Adams Morgan and Howard University/Ledroit Park, they’re selling in less than a week.
“D.C. has struggled with lean inventory since April 2012,” Redfin Chief Economist Nela Richardson said. “Even with a 7 percent increase in new listings from this time last year, inventory has yet to keep pace with demand. With just two months of supply, the District is on par with the most inventory-constrained and competitive markets in the country.”
D.C.’s Priciest Neighborhood
Chevy Chase D.C. was the city’s most expensive neighborhood, with the median sale price reaching $1,089,000, more than 28 percent above March 2014. Eleven properties sold last month and 34 others went on the market. Still, sellers weren’t totally in the driver’s seat. On average, homes in Chevy Chase D.C. are going for about 96 percent of their list price. More than half are taking nearly two months to sell.
East of the River
In other neighborhoods, strong demand and a lack of inventory are leading to bidding wars. East of the river in particular heated up in March, with homes moving more quickly and frequently for more than asking price. The average house sold for more than 107 percent of list price in Fairlawn. In Bradbury Heights, the sale-to-list ratio was almost 105 percent. Still, there are deals to be had in Northeast. The median sales price in Congress Heights is $180,000, making it the city’s least-expensive neighborhood. In nearby Benning Heights / Capitol View / Marshall Heights, half of homes sold for $195,900 or less.
Even with prices rising, the cost of ownership remains low thanks to cheap borrowing costs, said D.C. Market Manager Sam Khosh. That has a lot of buyers motivated. “Potential buyers are well aware that this might be the last chance they can get in at these low interest rates.”
On the other side of the aisle, homeowners who might want to trade up or relocate in the region are watching the bidding wars and thinking twice about jumping into the market. “Some sellers are scared of what can happen if they jump into the buyers’ pool,” Khosh said. “They’re in the same conundrum. That has some sellers holding back.”
| Neighborhood | Median Sale Price | Year-Over-Year | Homes sold | Year-Over-Year | Inventory | Year-Over-Year |
|---|---|---|---|---|---|---|
| 16th Street Heights | $562,500 | 14.0% | 9 | 0.0% | 17 | -26.0% |
| Adams Morgan / Kalorama Heights / Lanier Heights | $557,000 | 2.0% | 24 | -17.0% | 56 | -7.0% |
| American University Park / Friendship Heights / Tenleytown | $965,000 | -2.0% | 11 | 38.0% | 20 | -23.0% |
| Anacostia | $185,000 | 38.0% | 1 | -75.0% | 7 | -50.0% |
| Atlas District | $810,000 | 32.0% | 14 | -7.0% | 18 | 20.0% |
| Bellevue / Congress Heights / Washington Highlands | $202,500 | 59.0% | 10 | -17.0% | 37 | 6.0% |
| Benning Heights / Capitol View / Marshall Heights | $195,900 | -15.0% | 24 | 500.0% | 37 | 0.0% |
| Bloomingdale | $780,000 | 17.0% | 13 | 63.0% | 11 | 0.0% |
| Capitol Hill | $971,500 | 73.0% | 20 | -38.0% | 31 | -6.0% |
| Chevy Chase | $1,089,000 | 28.0% | 11 | -35.0% | 34 | 36.0% |
| Chinatown / Mount Vernon Square / Penn Quarters | $518,000 | 15.0% | 21 | -16.0% | 54 | 4.0% |
| Cleveland Park | $401,500 | 11.0% | 10 | 67.0% | 6 | -57.0% |
| Columbia Heights | $623,500 | 13.0% | 26 | -44.0% | 37 | -5.0% |
| Congress Heights | $180,000 | 80.0% | 6 | 100.0% | 16 | 23.0% |
| Deanwood | $225,000 | 18.0% | 5 | 67.0% | 13 | 44.0% |
| Dupont Circle | $383,000 | -15.0% | 28 | 27.0% | 41 | -20.0% |
| Eckington | $540,000 | -5.0% | 5 | -58.0% | 7 | -56.0% |
| Edgewood | $569,000 | 24.0% | 3 | 50.0% | 7 | -22.0% |
| Fairlawn / Twining / Randle Highlands / Penn Branch | $274,000 | -10.0% | 9 | 50.0% | 28 | 12.0% |
| Foggy Bottom / George Washington University / West End | $500,000 | 32.0% | 13 | 44.0% | 48 | 9.0% |
| Fort Totten / Lamont Riggs / Pleasant Hill / Queens Chapel | $411,500 | 22.0% | 10 | 43.0% | 19 | -27.0% |
| Foxhall / Palisades / Spring Valley / Wesley Heights | $915,000 | -33.0% | 13 | -32.0% | 50 | 9.0% |
| Georgetown | $868,000 | -19.0% | 20 | 67.0% | 58 | 7.0% |
| Glover Park / Cathedral Heights / McLean Gardens | $360,000 | -13.0% | 30 | 15.0% | 80 | 5.0% |
| Greenway / Benning / Dupont Park / River Terrace | $274,000 | 25.0% | 5 | 25.0% | 13 | 44.0% |
| Hill East | $625,000 | 4.0% | 17 | -19.0% | 27 | 59.0% |
| Howard University / Le Droit Park | $525,500 | -5.0% | 22 | 47.0% | 18 | -14.0% |
| Kingman Park | $467,000 | 23.0% | 11 | 0.0% | 14 | 40.0% |
| Logan Circle | $610,000 | 14.0% | 52 | 18.0% | 69 | -1.0% |
| Massachusetts Avenue Heights | $375,000 | 4.0% | 7 | 75.0% | 25 | -4.0% |
| Mount Pleasant | $390,500 | -41.0% | 5 | -17.0% | 5 | -29.0% |
| Navy Yard | $415,000 | NA | 4 | NA | 3 | NA |
| NoMa | $810,000 | 42.0% | 3 | -50.0% | 2 | -75.0% |
| Petworth | $551,000 | 25.0% | 22 | 10.0% | 19 | -14.0% |
| Pleasant Plains | $460,000 | -19.0% | 5 | -17.0% | 15 | 150.0% |
| Shaw | $756,000 | 20.0% | 10 | 67.0% | 16 | 0.0% |
| Southwest / Waterfront | $320,000 | 5.0% | 22 | 38.0% | 18 | -22.0% |
| Stanton Park | $828,500 | 54.0% | 25 | -27.0% | 32 | 14.0% |
| Takoma Park | $790,000 | 29.0% | 3 | -50.0% | 6 | 0.0% |
| Trinidad / Arboretum / Ivy City | $444,950 | 19.0% | 16 | -6.0% | 20 | 25.0% |
| Truxton Circle | $700,000 | 75.0% | 4 | 33.0% | 7 | -36.0% |
| U Street Corridor | $511,000 | 4.0% | 19 | 6.0% | 18 | -25.0% |
| Union Station / Kingman Park / Stanton Park | $568,000 | 17.0% | 34 | -26.0% | 41 | 11.0% |
| Van Ness / Forest Hills / Wakefield | $480,000 | -6.0% | 5 | -50.0% | 23 | 44.0% |
| Woodley Park | $385,000 | -27.0% | 5 | 0.0% | 9 | -18.0% |
| Woodridge | $515,000 | 36.0% | 9 | 50.0% | 7 | -22.0% |
| Washington, DC | $500,000 | 5.5% | 588 | 4.8% | 1,115 | -1.7% |
Other Popular Articles
How to Create a Pet Estate Plan
How Parents Can Help Children with Different Physical Abilities Move into Student Housing at College
Prevention, Protection, and Evacuation: Fire Safety for Farm and Livestock Owners


