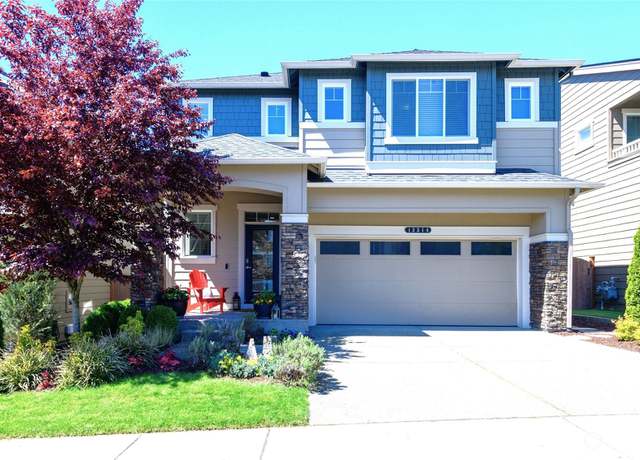
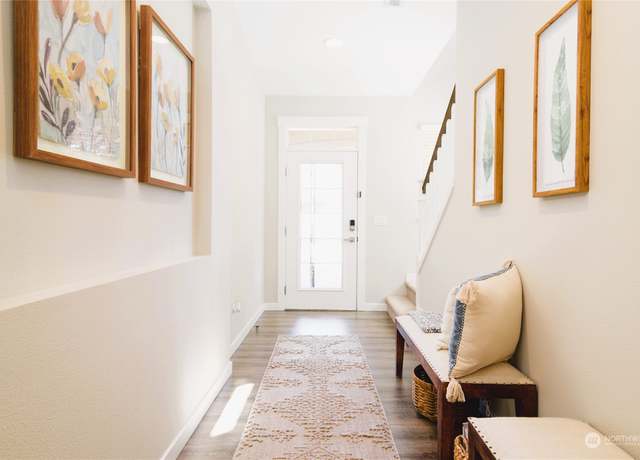
Welcome to SweetBriar! Come see this beautifully maintained home in a community featuring two private parks and playground. This 5 beds/2.75 bath home is filled with natural light due to its East/West location. Main open floor plan features a gourmet kitchen w/ spacious island that seats 4 and walk-in pantry. Formal dining area and expansive living room. Downstairs bed can be used as an office or bedroom. Upstairs enjoy four addtl. beds and an extra large bonus room for TV or playroom. Enjoy sunsets and views of Olympic mountains from the primary bedroom and five piece bath. The backyard is low maintenance with artificial grass over $20k in upgrades w/ extended patio. Home has Central A/C.
1/40
$899,999
5 beds3 baths2,929 sq ft3,920 sq ft (lot)
13314 187th Ave SE, Monroe, WA 98272
Listing provided by NWMLS as Distributed by MLS Grid
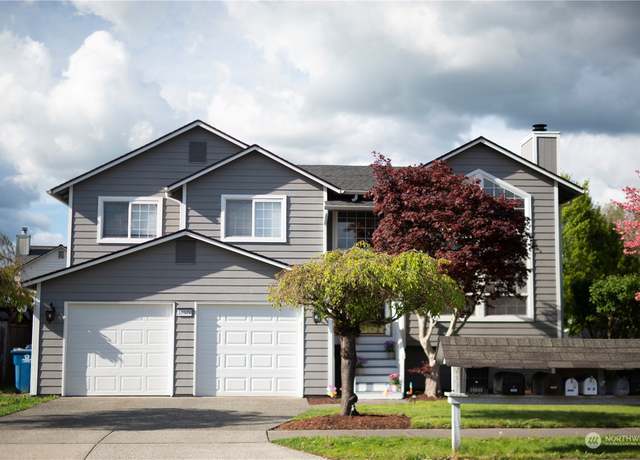
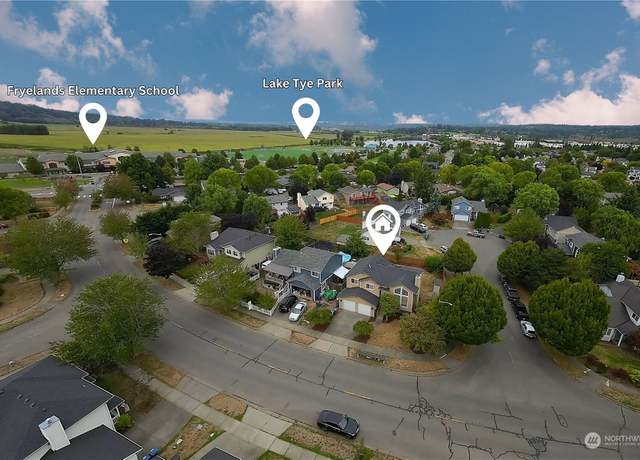
Nestled in the highly sought-after Fryelands neighborhood, this charming split-level home has received adorable updates that perfectly blend modern style with comfort. The kitchen features granite countertops, a custom tile backsplash, and stainless steel appliances, ideal for culinary enthusiasts. With updated bathrooms, you can indulge in a spa-like experience right at home. This four-bedroom beauty offers ample space, making it ideal for creating a home office or a dedicated workout area. The spacious corner lot provides endless outdoor possibilities, whether you want to garden, entertain, or simply enjoy the fresh air. Plus, you're just a short walk away from Fryelands Park, Lake Tye, a
1/32
$660,000
4 beds3 baths1,770 sq ft6,534 sq ft (lot)
16579 154th St SE, Monroe, WA 98272
Listing provided by NWMLS as Distributed by MLS Grid
Welcome to the Remington Heights community, where you will find a stunning 2,678 SQFT, 4bed, 2.5 bath home with an open and bright layout featuring new LVP flooring, new carpet, and updates throughout. Enjoy a large chef's kitchen with newly updated stainless steel appliances, custom-engineered stone countertops, and a large pantry. Featuring an expansive great room, with a gas fireplace, and pre-wired sound. Upstairs enter into your primary bedroom retreat, complete with 5 piece bath, and a massive walk-in closet. Enjoy 3 additional large bedrooms, a full bathroom, and a laundry room on the upper floor with new appliances. Enjoy
1/39
$799,950
4 beds2.5 baths2,678 sq ft7,405 sq ft (lot)
14913 SE 225th Ave, Monroe, WA 98272
Listing provided by NWMLS as Distributed by MLS Grid
Nestled on an expansive 3.46-acre estate, discover your new haven in this exquisite four-story farmhouse adorned with a charming wrap-around porch, offering captivating mountain views. Embrace the allure of small farm life as you step into the main floor, where a delightful kitchen with top-tier stainless steel appliances awaits, complemented by a screened porch area, a sophisticated dining room, an inviting office space, and a stunning stone fireplace in the great room. Ascend one level to the primary bedroom sanctuary, featuring a cozy fireplace, a spacious walk-in closet, and an ensuite bathroom adorned with a charming white claw-foot tub. Outside a beautiful barn, pond, riding trails, a
1/37
$1,200,000
3 beds3.5 baths3,609 sq ft3.46 acres (lot)
25903 120th St SE, Monroe, WA 98272
Listing provided by NWMLS as Distributed by MLS Grid
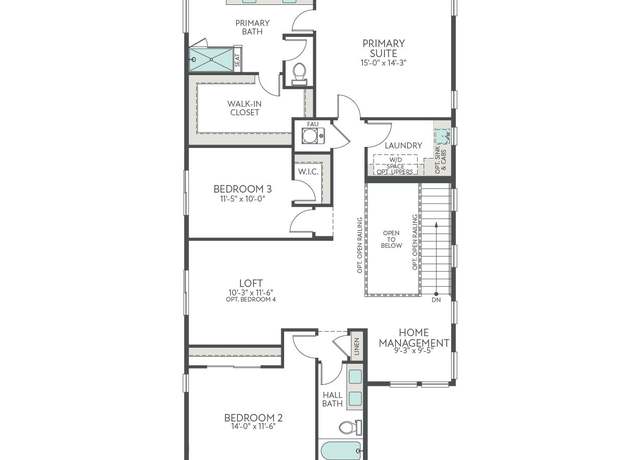
Must-see MainVue stunner! Style & comfort meet spacious living. Unobstructed mountain views & sunsets from the best lot in the community! Enjoy privacy & an abundance of natural light. Upgrades galore: dedicated 220V, pull-out shelves, AC, network package & more! Main floor boasts living room & flex/bonus or office. Kitchen overflows with counter space & a huge island that opens to dining & family areas. Mudroom leads to refreshed garage. Relax on the covered patio w/ gas fireplace in the fenced and private backyard. Upstairs features a loft, 4 bedrooms, full bath, & laundry. Primary suite has oversized closet (easily convert to a dream closet!
1/40
$1,199,900
4 beds2.5 baths3,356 sq ft5,227 sq ft (lot)
19372 136th Pl SE, Monroe, WA 98272
Listing provided by NWMLS as Distributed by MLS Grid
Beautiful home in Valley Vista Estates, located on a fully landscaped shy acre lot w/ stunning territorial and mountain views. Spacious 2-story home with vaulted ceilings and walls of windows bringing in natural light. Main level guest suite with attached ¾ bath, den and open concept great room/chefs kitchen w/ large island, Sub Zero fridge, double ovens & eating area. Primary suite w/ covered deck, 5-piece bathroom & walk-in closet. Upper level bonus room. Covered back deck w/ fireplace & lower patio, perfect for entertaining. Fully fenced landscaped backyard w/ sprinkler system. Wired for generator and EV charger in garage. Gated community w/ private river access.
1/40
$2,195,000
4 beds3.5 baths4,074 sq ft0.96 acre (lot)
20305 155th Dr SE, Monroe, WA 98272
Listing provided by NWMLS as Distributed by MLS Grid
Embrace the ease of single-story living in this exquisitely updated home, nestled in a tranquil locale. The kitchen shines w crisp shaker cabs, quartz counters & SS appliances, anchored by an island perfect for gatherings. Adjoining dining leads to an expansive deck, perfect for summer BBQs. The sunlit lvg rm w FP provides inviting spaces for relaxation. Escape to the grand primary suite, complete w deck access, lrg walk-in & a beautifully updated ¾ ensuite BA. 2 more generous beds & a full BA ensures comfort for all. New flooring, doors, trim, fixtures & finishes, fresh paint & a ton of charm. Located on a generous lot just mins from Monroe Fairgrounds
1/39
$749,950
3 beds2 baths1,806 sq ft0.29 acre (lot)
18003 133rd Pl SE, Snohomish, WA 98290
Listing provided by NWMLS as Distributed by MLS Grid
Presenting this meticulously remodeled 4-bed modern farmhouse quietly nestled in a cul-de-sac. Enhanced with custom trim and millwork, this home exudes elegance and craftsmanship. The living room boasts an exquisite shiplap modern fireplace perfect for cozy evenings. An expansive deck, off the kitchen, offers tranquil views of the backyard & greenbelt - an idyllic setting for alfresco dining. Upstairs, find 3 generous beds & 2 fully remodeled baths. The primary suite boasts vaulted ceilings, walk-in closet & luxurious walk-in shower. The basement w/ interior & exterior access, offers a versatile space or ideal MIL suite w/ 4th bed, den and bath. Tucked away in a quie
1/32
$828,000
4 beds3.5 baths2,008 sq ft0.37 acre (lot)
28603 106th Pl SE, Monroe, WA 98272
Listing provided by NWMLS as Distributed by MLS Grid
Marvel at the panoramic views of majestic mountains and the Skykomish River off your back deck, offering some of the most mesmerizing sunset views imaginable. Nestled on a ¾ acre lot, this home boasts a fenced backyard, hot tub, circular driveway with RV parking, attached 2 car garage & outbuilding. Inside features 3 beds & 3 full baths. Cozy up by the fireplace in the living area, enhanced by an open floor plan that seamlessly connects to a sizable kitchen boasting a generous island for casual dining, elegant granite countertops, bamboo floors and sleek black SS appliances. Home has been completely updated and features newer roof, interior & exterior paint, furnace
1/40
$889,000
3 beds3 baths2,019 sq ft0.78 acre (lot)
21712 Calhoun Rd, Monroe, WA 98272
Listing provided by NWMLS as Distributed by MLS Grid
Forget that you are just minutes away from downtown Monroe in this timeless colonial farm home with unparalleled privacy. Enjoy this country estate with 3 Beds / 3.25 bath, 3,216 sqft main home and additional 1 bed /. 75 bath, 784 sqft 2 story small home/ADU with full kitchen and living area. Set on a level 4.92 acres, this property blends old-world charm and modern updates with hardwood floors, box beam ceilings, wood-wrapped windows, updated kitchen and updated baths. Step outside to the gazebo covered patio with fire pit and BBQ area perfect for entertaining on summer nights. Exceptionally private grounds with mature landscaping fruit trees and gardens plus a spacious detached 40x48 thre
1/40
$1,399,950
3 beds3.5 baths3,216 sq ft4.92 acres (lot)
13421 Woods Lake Rd, Monroe, WA 98272
Listing provided by NWMLS as Distributed by MLS Grid
10 Private acres! Completely remodeled home just outside Monroe. Main home is 3 bedroom 3 bath 1620 sq ft with a 440 sq ft shop. Complete remodel to include all new kitchen with new Cabinets, Quartz countertops, stylish lighting, high end stainless appliances, Waterproof flooring throughout, new doors and millwork, new windows and a Brand new roof. Wired for Hot tub outside patio off Master bedroom. Furnace and septic professionally inspected and serviced. 1 year home Warranty and Pre Inspection report available.
1/25
$699,900
3 beds2 baths1,620 sq ft10.00 acres (lot)
18020 273rd Ave SE, Monroe, WA 98272
Listing provided by NWMLS as Distributed by MLS Grid
Need room to grow ?: 3bed 3 bath Cosmetic FIXER with a brand new painted unheated in ground pool & amazing covered atrium. Imagine a rare opportunity to enjoy 2500sqft one story Rambler and room 2 expand attached 4 Car 1000 square-foot garage. Don’t miss 2nd kitchen 1 bed 1 bath ADU on this Shy half acre lot in downtown Monroe that feels like the country. Extra finished rooms will make great nursery or office or workout gym, fully fenced and lots of offstreet parking for your RV boat or toys, island in kitchen is ready for upgrade, creative financing, and rehab loan will allow cosmetic upgrades, seller is reasonable if you are fair. Bring your rehab ideas and enjoy this proper
1/38
$769,999
3 beds3 baths3,473 sq ft0.46 acre (lot)
17623 160th St SE, Monroe, WA 98272
Listing provided by NWMLS as Distributed by MLS Grid
This must-see, fully remodeled 3,200 sq. ft. rambler is nestled on 5 acres of beautiful countryside, just moments away from Duvall, Monroe, Woodinville & Redmond. This home features 3 bedrooms and 2.5 baths of updated perfection. The inviting entry way showcases an office/den and a grand living room to start your dinner parties. As you progress through the home you will be stunned by the stone fireplace and vaulted ceilings in the family room. As you move into the Chef's kitchen you will find double ovens, stainless steel appliances, sprawling pantry and butler's pantry that leads to the dining room. Spend your time around the fire pit, on the deck or working out in your oversized 3-c
1/37
$997,000
3 beds2.5 baths3,224 sq ft5.04 acres (lot)
21522 189th Ave SE, Monroe, WA 98272
Listing provided by NWMLS as Distributed by MLS Grid
A Remarkable Opportunity Awaits! Sale includes 3 parcels totaling nearly 13.5 acres w/ so much possibility! A meticulously crafted home surrounded by private acreage & promising potential is one you do not want to miss! First time on the market it offers a CUSTOM, COMFORTABLE, & SERENE lifestyle w/ its open layout, stunning sun room filled w/ windows & natural light, expansive storage w/ built in shelving, & so many unique & special features. The 2 car detached garage w/ integrated shop offers ample space for storage, hobbies, & creative endeavors. Embrace the freedom to pursue your passions w/ room for vehicles, equipment & projects - a MUST SEE prop
1/37
$1,295,000
3 beds2 baths2,702 sq ft13.46 acres (lot)
24930 132nd St SE, Monroe, WA 98272
Listing provided by NWMLS as Distributed by MLS Grid
Luxury home built by MainVue is better than new w/ lots of upgrades! Spacious rooms w/ 10’ tall ceilings. Main level entry w/ luxurious laminate plank floors lead to open floor plan-living room, dining room, office & kitchen. Kitchen boasts expansive island, walk-in pantry, soft close drawers, quartz counters & Electrolux Appliances. Picturesque-wall of windows & sun filled rooms- slider opens to outdoor covered living space w/ gas fireplace, perfect for entertaining. Other features: attractive tiered rock wall, powder on main, mature landscaping, fully fenced backyard, bonus room, large primary suite w/ bath & 2 walk in closets, 3 addt’l good size bedroo
1/35
$1,098,000
4 beds2.5 baths2,708 sq ft6,534 sq ft (lot)
19131 136th Pl SE, Monroe, WA 98272
Listing provided by NWMLS as Distributed by MLS Grid
This stunning, like-new rambler is nestled on five acres & invites you to experience unrivaled tranquility. The home boasts impressive essentials and meticulous upgrades–a heat pump, a generator, beautiful LVP flooring, an oversized three-car garage, and more. Intentional architectural details in the great room create an unforgettable, naturally-lit entertaining space. The gourmet kitchen has an oversized centerpiece island & high-end stainless steel appliances. The ensuite in the spacious main bedroom features a luxurious walk-in shower. For effortless indoor-to-outdoor living, relax year-round on the covered deck. Best of all, the property is less than 30min from Downtow
1/40
$1,000,000
4 beds2.5 baths2,375 sq ft5.00 acres (lot)
36016 Mann Rd, Sultan, WA 98294
Listing provided by NWMLS as Distributed by MLS Grid
Welcome Home to this beautiful 2,600 sq ft home on large . 22 acre fenced lot! This 4 bed/2.5 bath home has had $50,000 in recent upgrades! Kitchen has quartz counters, black stainless Smart appliances, 25 year carpet, wood floors on upper level, updated baths & exterior paint. Enjoy entertaining year around on the 26’x16’ Trex deck & large gazebo. Formal living & dining areas along with eat-in kitchen, family room with gas fireplace. Large Primary Suite w/ 5 pc bath & corner soaking tub. Three additional bedrooms, bath, laundry and large bonus room complete the upper level. Easy access for your commute and close to schools. Many outdoor activities nearby
1/39
$799,000
4 beds2.5 baths2,600 sq ft9,583 sq ft (lot)
16843 Tester Rd, Monroe, WA 98272
Listing provided by NWMLS as Distributed by MLS Grid
This charming 3 bed, 2.5 bath home sits on 1.27 acres. A side garden area is waiting to be planted with all of your favorite veggies and flowers. A playset, chicken coop and room for your RV is ready to be used in the fully fenced yard. Inside you will find a spacious and inviting floor plan, ideal for both everyday living and entertaining guests. During the heat of the summer stay in side with cooling A/C. New vinyl plank floors, new paint throughout, new doors, new bathroom vanities and an updated kitchen are ready for you to add your personal style to. Get ready to spend all your summer days enjoying on the back patio. Create your own backyard adventure as you explore the property down t
1/21
$710,000
3 beds2.5 baths1,859 sq ft1.27 acres (lot)
24833 Florence Acres Rd, Monroe, WA 98272
Listing provided by NWMLS as Distributed by MLS Grid
Two Homes for the price of one on private, tranquil wooded 6.6+ acres. Located 10 mins to Duvall or Monroe & 25 mins to Redmond. Main home 1300sf, 3 bedrooms, 1 bath w/ huge laundry room/pantry & room to add 2nd bath. Enjoy 16x28 deck off kitchen & living room has cozy brick oven & wood stove. Detached 877sf ADU has 1 bdrm, 1.5 bths, window seat fits two xl twin beds for overnight guests, office & carport w/ electric car charger. Homes: split duct heat/AC. No HOA’s or CCR’s. Build a dream shop/garage. Tons of parking for vehicles, boats, RV’s! Near recreational areas, lakes & trails. Ask a mortgage officer to qualify using future rental
1/38
$895,000
4 beds2.5 baths1,300 sq ft7.18 acres (lot)
23325 Lake Fontal Rd, Monroe, WA 98272
Listing provided by NWMLS as Distributed by MLS Grid
Quality & Elegance, Luxurious (John Buchan) Glacier Custom Design Build. (SELLER FINANCING AVAILABLE) This Timeless Estate boasts 2.5 acres nestled next to Lake Wagner. Beautiful Floorplan 2 Story, 4 BR, Master Primary Suite on Main, 4.25 Baths, Study/Great Room/Bonus Rm, 3 Car Garage. Grand Entry, Soaring Ceilings, Finest in Material (Travertine, Granite, Stone, Hardwood). Open and Bright Great Room with Floor to Ceiling Windows/ Living Rm / Formal Dining Rm & Family Room with River Rock Fireplace. Remarkable Craftsmanship throughout. Gourmet Kitchen w/ Granite Countertops/Stainless Steel Appliances. Why walk to the Lake when you can ride your horse? (Equestrian). Large Enterta
1/40
$2,199,950
4 beds4 baths4,569 sq ft2.54 acres (lot)
12822 227th Ave SE, Monroe, WA 98272
Listing provided by NWMLS as Distributed by MLS Grid
Offer review date is 4/22/2024 by 3pm. The Oak by MainVue Homes at Eaglemont is a modern 4 bedroom home. Begin at the Foyer, then arrive at the Multi-Purpose Room before leading to the core of the home: The Great Room and Dining room provide direct access to the Signature Outdoor Room via wall-height sliding glass doors. The Gourmet Kitchen features 3cm Quartz Counters, Frameless Cabinetry and Stainless-Steel appliances. The Leisure Room connects three secondary bedrooms and the Grand Suite featuring a frameless walk-in shower, designer free-standing tub and vanities capped in 3cm Quartz. Customer registration policy: Buyer’s Broker to visit or be registered on Buyer’s 1st visit
1/9
$1,263,000
4 beds4.5 baths3,489 sq ft5,012 sq ft (lot)
13273 199th Ave SE, Monroe, WA 98272
Listing provided by NWMLS as Distributed by MLS Grid
This is a rare opportunity to own a custom built, deluxe log home on almost 40 acres. It is the perfect blend between super cool, and charming w/ open beam ceilings, exposed logs, 2 river rock fireplaces, and front & back covered porches. There is just the right amount of drywall to allow for art, and furniture placement. Main bedrooms have ensuite baths & walk-in closets. The large open loft w/ covered deck, could be a 3rd bedroom. The property features are too numerous to list, but there is a covered patio w/ river rock fireplace/BBQ, a greenhouse, and orchard. X'tra large garage w/ workshop and RV sized carport. Just 20 minutes to the eastside & 45 minutes to DT Seattle
1/40
$1,750,000
3 beds2.5 baths2,640 sq ft38.21 acres (lot)
21010 195th Ave SE, Monroe, WA 98272
Listing provided by NWMLS as Distributed by MLS Grid
Now offering special financing w/ rates as low as 4.25%! Nestled on the banks of the Snoqualmie River exists a gated community unlike any other. Welcome to Valley Vista Estates, Acme Homes’ boutique collection of luxury new construction. Offering a truly one-of-a-kind lifestyle, these 1-acre residences provide unparalleled access to nature w/ private river access & rare sandy beach waterfront. Lot 5 boasts the popular Juniper floorplan: a spacious 2 story home w/ soaring ceilings & sundrenched main level featuring an open concept great rm, office, guest suite & covered deck. Idyllic location w/ exceptional tranquility just mins to Woodinville, historic Snohomish, DT
1/32
$1,799,990
5 beds3.5 baths3,558 sq ft0.56 acre (lot)
15806 201st Pl SE, Monroe, WA 98272
Listing provided by NWMLS as Distributed by MLS Grid
Now offering special financing w/ rates as low as 4.25%! Nestled on the banks of the Snoqualmie River exists a gated community unlike any other. Welcome to Valley Vista Estates, Acme Homes’ boutique collection of luxury new construction. Offering a one-of-a-kind lifestyle, these 1-acre residences provide unparalleled access to nature w/ private river access & rare sandy beach waterfront. Lot 25 boasts walls of windows revealing breathtaking views of the Cascade Mts & Mt Baker from all levels. Open concept floorplan features great room w/ primary & guest suites on main level. Idyllic location w/ exceptional tranquility just mins to Woodinville, historic Snohomish, DT
1/32
$1,999,990
4 beds3.5 baths3,422 sq ft0.84 acre (lot)
15823 203rd Pl SE, Monroe, WA 98272
Listing provided by NWMLS as Distributed by MLS Grid
This property features third plus acre grass lot, partially fenced. The 6plex is a great valued property. Each unit is a 3 bedroom, 2 bath, 1025 sq ft. All appliances refreshed including washer and dryer in each rental. Excellent 1031 Exchange property. Over 350K invested to update all the units with LVP, trim, appliances, electrical, paint Rent roll approx 185K/pa, Cap rate ~5.8% Great property for beginning investor as owner-occupant. Do not contact or disturb residents in any way. Pre-inspected (report available in MLS) Remodel dates #1(2023) #2(2019), #3(2018), #4(2019) , #5(2021), #6(2023). New garage doors w/ openers (Dec23). Deck repaired (Dec23), Garbage box rebuilt (Jan24), Sidin
1/28
$2,400,000
18 beds12 baths6,110 sq ft0.37 acre (lot)
18461 Killarney Cir, Monroe, WA 98272
Listing provided by NWMLS as Distributed by MLS Grid
Make your dream a reality with this secluded getaway. Just what you've been looking for! This two-tiered property is a little over 5 acres that is ready to be molded into what you've always wanted. Close enough to Monroe and Duvall for convenience. The cabin is solid and waiting for your first overnight stay! Unique parcel with potential. Electric meter on cabin ready to go! People's Creek runs through the rear of the lot on the lower level. What are you waiting for?
1/15
$425,000
1 bed1 bath384 sq ft5.11 acres (lot)
19226 220th St SE, Monroe, WA 98272
Listing provided by NWMLS as Distributed by MLS Grid
This incredible property has it all! Right down to the studs remodeled Farmhouse features, 2 bedrooms & 2 bathrooms. Designer touches throughout Chef's kitchen w/ Fisher & Paykal oven & double ovens, refrigerator, dishwasher & beverage cooler. Large island in kitchen, hot tub w/ a large covered porch w/ 3 custom exterior chandeliers. Outbuildings w/ a 5500 square foot event venue w/ indoor stage, 350 ft of river frontage & access, store front, bar area, commercial kitchen, eating area and liquor license. Additional outbuildings feature a 2400 sq ft shop, chicken coop w/ run & 1800+Sq ft barn. This commercial/ residential property would be ideal for any ty
1/40
$1,699,995
2 beds2 baths1,800 sq ft8.71 acres (lot)
19829 168th St SE, Monroe, WA 98272
Listing provided by NWMLS as Distributed by MLS Grid
* * * GREAT OPPORTUNITY TO BUILD IN MOROE * * * A Level . 72 acre Property. With a GREAT LOCATION just off of West Main Street on a dead-end road. Water, Electricity, and Sewer on property. Buyer to verify all information. All studies (Survey, Geotech, etc. ) completed. 11 Unit Townhome site plan close to approval with City of Monroe.
1/1
$1,050,000
— beds— baths0.72 acre (lot)
16096 174th Dr SE, Monroe, WA 98272
Listing provided by NWMLS as Distributed by MLS Grid
36+ acres of beautiful and private land ready for your dream home or build the home that is currently approved. All the hard work has been done- access road/driveway installed, building site approved and installed, Well installed, Septic design approved. Creek boarders property offering an abundance of wildlife and privacy. Great recreation property or build to suit.
1/22
$875,000
— beds— baths36.63 acres (lot)
18812 299th Ave SE, Monroe, WA 98272
Listing provided by NWMLS as Distributed by MLS Grid
A great opportunity to build your home on this beautiful acreage in the Woods Creek area. This 6.37 acre flat lot consists of three fully fenced pastures located less than a minute drive west of Blue Boy West Golf Course. Public water and PUD power is located in the street. Wetland and percolation tests performed by previous owner and determined no wetlands present and it all percs. Buyer to verify.
1/5
$495,000
— beds— baths6.37 acres (lot)
27211 Florence Acres Rd, Monroe, WA 98272
Listing provided by NWMLS as Distributed by MLS Grid
Preliminary short plat approval & LDA in hand for this beautiful, private property of 11.35 acres with up to 3 building sites or build one dream estate. Quiet, rural living just minutes from downtown Monroe. Fantastic, secluded location with potential for mountain views with some selective thinning of trees. Highland water connection is in the street. Geotech report and septic designs are available. The preliminary short plat approval for up to 3 lots has been completed, with road construction able to proceed by May 1st, 2024. Don’t miss this amazing opportunity to build in a thriving area.
1/18
$575,000
— beds— baths11.35 acres (lot)
0 248th Ave SE, Monroe, WA 98272
Listing provided by NWMLS as Distributed by MLS Grid
5 acres in Monroe, WA - your canvas for a dream custom home! Scenic, and ready for your vision. Don't miss this opportunity! Septic designs for 4 bedroom home approved . Close to all amenities, HWY 2 .
1/2
$315,000
— beds— baths5.00 acres (lot)
26405 Fern Bluff Rd, Monroe, WA 98272
Listing provided by NWMLS as Distributed by MLS Grid
Beautiful lot with limited mountain views of Mt. Pilchuck, Liberty Mountain, Mt. Baker, and the Cascades. Small orchard onsite with producing fruit trees. River King Estates offers PRIVATE Skykomish River beach access exclusive to owners. Paved street 95% of the way to property from Ben Howard Rd. Old septic design done – will need to be revised. Well needed. Power is on the street. Gently sloping usable lot. Trails are clear – come walk the property! Could be ideal to build a daylight rambler. Bring your creativity and watch your dreams unfold. Camp now, build later.
1/19
$60,000
— beds— baths0.69 acre (lot)
0 Lot 91, Monroe, WA 98272
Listing provided by NWMLS as Distributed by MLS Grid
Based on information submitted to the MLS GRID as of Sun May 05 2024. All data is obtained from various sources and may not have been verified by broker or MLS GRID. Supplied Open House Information is subject to change without notice. All information should be independently reviewed and verified for accuracy. Properties may or may not be listed by the office/agent presenting the information. Some IDX listings have been excluded from this website.
This area's enrollment policy is not based solely on geography. Please check the school district website for more information.
Elementary schools
Middle schools
High schools
GreatSchools Summary Rating
7/10
Sky Valley Education Center
Public, K-12 • Choice school
7/10
Salem Woods Elementary School
Public, PreK-5
4/10
Fryelands Elementary School
Public, PreK-5
2/10
Frank Wagner Elementary School
Public, PreK-5
School data is provided by GreatSchools, a nonprofit organization. Redfin recommends buyers and renters use GreatSchools information and ratings as a first step, and conduct their own investigation to determine their desired schools or school districts, including by contacting and visiting the schools themselves.Redfin does not endorse or guarantee this information. School service boundaries are intended to be used as a reference only; they may change and are not guaranteed to be accurate. To verify school enrollment eligibility, contact the school district directly.
Homes for sale in Monroe have a median listing price of $695K. Some of these homes are Hot Homes, meaning they're likely to sell quickly.
How often does Redfin update their new listings?
Most of our new listings in Monroe are updated every 5 minutes so you can see new homes as soon as they come on the market. Learn more
What is transportation like in Monroe?
Monroe, Washington offers a variety of transportation options, including public transportation. The city is served by Community Transit, providing bus services that connect Monroe to other parts of Snohomish County. For those who prefer to drive, traffic levels can vary, but generally, the city experiences moderate traffic. Monroe is conveniently located near major highways, including U.S. Route 2 and State Route 522, making car travel to neighboring cities straightforward. Learn more on our Monroe city guide.
What types of properties are available in Monroe?
Monroe, Washington offers a variety of single-family home types, including ranch-style homes, split-level homes, and contemporary homes, among others. These homes can be found throughout the city, with some located in established neighborhoods and others in newer developments. Most properties in Monroe, Washington feature 3-4 bedrooms and were built within the past 20 years. To explore different property types for sale in Monroe, Washington, use the 'Home type' filter located above the active listings. Customize your search by selecting options like single-family homes, condos, townhomes, and more.
What is life like in Monroe?
Monroe, Washington offers a serene and picturesque setting with its stunning landscape of lush greenery and breathtaking mountain views. The region experiences a variety of weather patterns, from mild summers to crisp winters, providing residents with a diverse seasonal experience. The area boasts a range of job opportunities across various industries, ensuring a thriving and dynamic economy. Residents can enjoy a wide array of recreational activities, such as hiking, biking, and exploring the numerous parks and trails in the area. Additionally, the community offers a vibrant social scene with local events and gatherings that cater to different interests and hobbies.
What are the schools and amenities like in Monroe?
Monroe, Washington offers a variety of public amenities to enhance your living experience. The city boasts a number of restaurants, catering to a wide range of culinary tastes. For outdoor enthusiasts, there are several parks available for recreational use. Grocery shopping is convenient with multiple grocery stores located within the city limits. Additionally, Monroe provides other essential amenities such as schools, healthcare facilities, and public transportation.
In the past month, 25 homes have been sold in Monroe. In addition to houses in Monroe, there were also 2 condos, 4 townhouses, and 1 multi-family unit for sale in Monroe last month. Monroe is a minimally walkable city in Snohomish County with a Walk Score of 31. Monroe is home to approximately 17,033 people and 7,140 jobs. Find your dream home in Monroe using the tools above. Use filters to narrow your search by price, square feet, beds, and baths to find homes that fit your criteria. Our top-rated real estate agents in Monroe are local experts and are ready to answer your questions about properties, neighborhoods, schools, and the newest listings for sale in Monroe. Our Monroe real estate stats and trends will give you more information about home buying and selling trends in Monroe. If you're looking to sell your home in the Monroe area, our listing agents can help you get the best price. Redfin is redefining real estate and the home buying process in Monroe with industry-leading technology, full-service agents, and lower fees that provide a better value for Redfin buyers and sellers.


 REDFIN IS COMMITTED TO AND ABIDES BY THE FAIR HOUSING ACT AND EQUAL OPPORTUNITY ACT. READ REDFIN'S FAIR HOUSING POLICY AND THE NEW YORK STATE FAIR HOUSING NOTICE.
 United States
 Canada