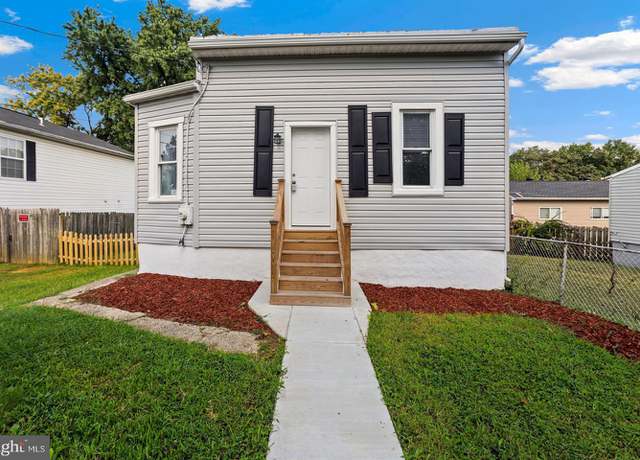
Investor Special!!! Renovated and ready for you to call it home! 3 bedroom and 2 full bath home features an updated kitchen with cabinets, countertops and appliances, New carpet throughout the home. 2 bedrooms and one full bath on the upper level. Lower level features 1 bedroom and 1 full bath plus a spacious bonus room that can make a great office or game room. Come tour today!
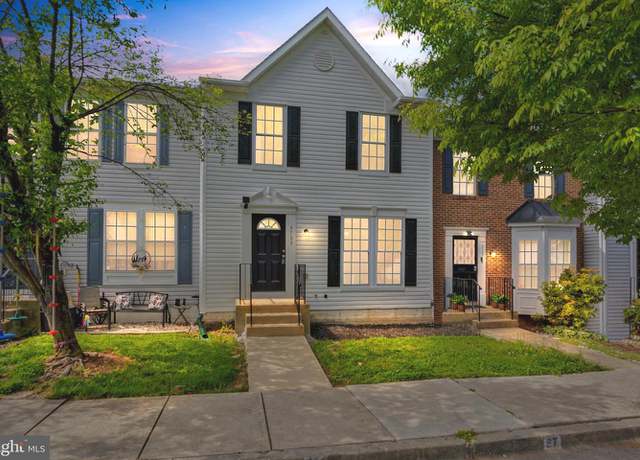
Welcome Home! This exquisite 3-level townhouse is a true gem that has it all. Recently upgraded with luxury vinyl plank flooring, a fresh coat of paint, and new carpeting throughout, this home is the epitome of move-in ready. Step into the spacious living room, bathed in natural sunlight, perfect for relaxing or entertaining guests. The dining room boasts new flooring and fixtures, setting the stage for memorable meals. The breakfast room offers direct access to the spacious deck, ideal for morning coffee or evening relaxation. The kitchen is a chef’s delight with pristine white cabinets and newer appliances, ready for culinary adventures. Retreat to the main bedroom featuring a doubl
Renovated 2 years ago, new kitchen cabinets, new kitchen appliances, renovated bathrooms, refinished hardwood floor throughout the main level, ceramic tile and laminated floors in basement, new paint, come and see this nice property
Charming/Renovated - 3 Bedroom 2.5 Bathroom Single House In Capitol Heights With Great Amenities - LOCATION !! - 5 min away from DC, Capital Heights & Seat Pleasant Metro Stations; 10 min away from Fedex-Field & Beltway. New HVAC, modern Kitchen & Bathrooms. Multiple parking space. Rent-to-Own / Owner Financing available Welcome Home! - This a convenient located & recently renovated single family house; walking distance to DC line & metro stations; 8 minutes drive to Fedex-Field. 3 Bedrooms, 2.5 Baths. Own & street parking spots. Two levels & Spacious 1,632 SF. Open floor-plan on main with custom kitchen. Private Back Yard perfect for entertaining.
Welcome to your dream home in the heart of Capital Heights, Maryland! Prepare to be captivated by this stunning, fully renovated three-level residence, where every detail has been thoughtfully designed to perfection. Step inside to discover a brand new kitchen, boasting modern appliances, sleek countertops, and ample storage space, creating the ideal setting for culinary adventures and entertaining guests. The luxurious new baths offer a spa-like retreat, ensuring relaxation and comfort after a long day. Revel in the charm of restored hardwood floors and the warmth of recessed lighting, creating an inviting ambiance throughout the home. With a spacious finished basement that has been turned
Fully renovated in 2016, this three-level home boasts five bedrooms, two full bathrooms, and is just a 12-minute walk to the Metro. The open kitchen features granite countertops and stainless steel appliances. The living room showcases beautiful wood floors and custom coffered ceilings. The spacious basement has a separate entrance leading to the extra-large backyard, fantastic for entertaining. Don't miss out on the opportunity to own this fantastic home!
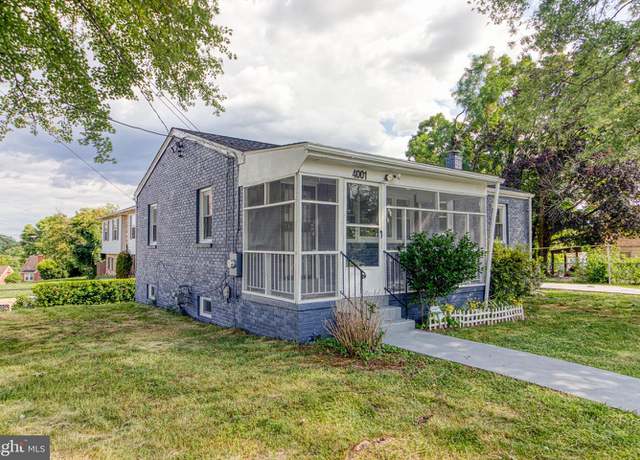
Fannie Mae property. Ranch/rambler located in the Chapel Oaks subdivision of Capitol Heights, MD. The property has three bedrooms, one bathroom, and a finished basement. There is covered off-street parking at the back of the property and a screened-in porch. The property is convenient to schools, shopping, churches, and public transportation. The property needs some updating.
Get ready to experience the perfect blend of space, style, and convenience in this fantastic home! With six bedrooms spread across three floors, along with two bathrooms to accommodate your family's needs, this home offers ample room to live, work, and play. As you enter inside, you'll be greeted by the warmth of beautiful hardwood and LVP floors that span throughout the entire house. The newly renovated kitchen, complete with sleek cabinets and modern appliances, is a chef's dream come true. The attached garage has been transformed into a versatile rec room, providing even more space for relaxation and entertainment. And with driveway and on-street parking available, parking will never be
More photos will be uploaded soon! Steps away from DC and bus station. Nesting in a commercial area -just one street away. Not your regular residential property. It has great potential and perfect for those whom want to use it as commercial and residential property, as it sits in very convenient location and accessibility. The property will be fully renovated. More photos will be uploaded soon.
Welcome Home! This Beautiful House, was just recently renovated, In Capitol Heights, MD. And It offers, 4 bedrooms, 3 Full bathrooms, finished basement, new kitchen cabinets, quartz counter tops, beautiful center Island, freshly painted, finished basement, with washer & dryer, new Electrical Pannel, ac/unit & furnace, water heater, ceramic tiles In kitchen & bathrooms, hardwood flooring throughout the main level, back yard and spacious driveway which it will easily fit about 6 cars. All Inspection required by the county have Passed! Come and make this, Your Dream Home! Cash /Conventional Financing. For FHA's buyers, Welcome, after April 27, 2024.
If you're looking for a home that has it all, then look no further! Nestled in a quiet neighborhood less than a mile from Addison Road metro, 506 Victorianna Dr. offers the perfect location for a family that would like to be close to the city, but still gives the feeling of a peaceful, suburban-like environment. With 4 beds, 4 full baths and countless upgrades, this property is everything you need and more! All furniture and fixtures convey with the property; you have total discretion regarding what you would like to keep to help begin your new home experience! All beds, couches, TVs, wall mounts, tables, chairs, appliances, and deck furniture are included. A few other notable features incl
Single Family home at town house price! This lovely home has been well maintained and boasts 3 bedrooms 1 full bath, stainless steel appliances and Is just perfect for entertaining inside or out. .. complete with bar and plenty of yard space for family gatherings. Appraised above asking . Motivated seller will pay 2% towards strong buyers closing and ready to settle quickly. May need rent back but all is negotiable. 24 hour notice. Please text listing agent for access code and instructions.
Welcome to 6814 Wynnleigh Rd, a captivating two-level colonial home that exudes charm and modern elegance. Situated on a tranquil street in the heart of Capitol Heights, this stunning property has been meticulously renovated to meet the desires of the contemporary buyer. Property Highlights: SPACIOUS INTERIORS: Boasting five generously sized bedrooms and two beautifully appointed bathrooms, this home offers ample space for family living and gracious entertaining. GOURMET KITCHEN: Step into the fully renovated kitchen, equipped with state-of-the-art stainless steel appliances, granite countertops, and custom cabinetry. The open layout and modern finishes provide the perfect setting for culin
OPEN HOUSE - SUNDAY, APRIL 28, 2024 BETWEEN 1PM-3PM. .. .. You can't miss this one!! One level living at it's finest. As you enter the front door you walk into a spacious living/dining room combo with wood flooring and tons of natural light! This is an amazing space to entertain and/or hang out with friends and family. As you move on you experience the 1st full bathroom. The 1st bedroom is a secret room. Make sure you don't walk past it. .. . (Check behind the mirror!!!!). If you made it to the kitchen you went too far! The hidden room has carpet and good sized closet. Next you have the large kitchen with mini peninsula for a great bar top seating. The kitchen has stainless steel applianc
Welcome to this charming split-level single-family home nestled in the desirable Wilburn Estate community. Featuring 4 bedrooms and 2 full bathrooms, this property offers ample space for comfortable living. The eat-in kitchen is perfect for casual meals, while the separate dining and living room combination provides an ideal space for entertaining. With an attached 1-car garage and additional 2-car parking in the driveway. Explore the bonus room, offering versatility for a home office, gym, or additional living space. Step outside to discover a spacious backyard, ideal for outdoor activities and gatherings. While this home requires a little TLC. Don't miss out on the chance to transform thi
Welcome to 311 Cedarleaf Ave - a charming oasis nestled in the heart of the bustling Washington, DC metro area! This stunning 3-bedroom, 2-bathroom home is a true gem, offering the perfect blend of modern convenience and classic charm. As you step inside, you are greeted by an abundance of natural light that fills the spacious living area, creating a warm and inviting atmosphere. The open floor plan seamlessly connects the living room, dining area, and gourmet kitchen, making it ideal for both relaxing nights in and entertaining guests. The kitchen is a chef's dream, featuring sleek countertops, stainless steel appliances, and ample storage space. The bedrooms are generously sized, providin
Newly Renovated Dream Home Awaits at 7002 Canyon Dr. , Capitol Heights, MD 20743 Welcome to your enchanting new home in Capitol Heights, a meticulously renovated masterpiece that combines modern luxury with comfort and style. This single-family detached home, nestled at 7002 Canyon Dr. , presents an inviting facade with new landscaping that whispers the promise of what lies within. As you step through the wrought iron storm doors, you're greeted by a spacious, reimagined open floor plan that seamlessly connects living, dining, and kitchen areas—perfect for entertaining and everyday life. Fresh paint inside and out, alongside new walls, floors, ceilings, and insulation, ensures every i
The buyer's loan was declined due to insufficient funds. Their loss, your gain! Welcome to this beautiful home! This home underwent a complete major renovation in 2024, ensuring a modern and updated living space. The interior features luxury vinyl flooring throughout, offering a sleek and low-maintenance option for the busy homeowner. The entry-level features an inviting living room with large windows, modern kitchen. The new kitchen is equipped with new appliances, cabinets, backsplash, and ceramic floors, providing a functional and stylish space for cooking and entertaining. The bedrooms are spacious and well-lit, creating a comfortable and inviting atmosphere. An updated hall full bathro
This house is in very bad condition. There is someone working on cars usually on site. Take driveway past other houses to the end (see pictures) There are many cars in the yard. SOLD AS IS with debris and occupant and cars. Ownership of these cars is not included in this sale. Cars can be bought from occupant, Mr. Foote. To see the property call him at 202 709-0235.
Welcome home to this beautiful 3 level end unit rowhouse with 3 entrances and all the finishes you desire in a home. Enjoy your fully updated kitchen with stainless steel appliances and quartz countertops. Two full bathrooms fully updated. A bonus room off the kitchen that lets into the backyard with a half bathroom. Upper level has 2 full bedrooms and an updated bathroom. Lower level accessible from a side entrance and complete with full bathroom and new HVAC. Large backyard. Great opportunity for a first time homebuyer.
Back on the Market !!!!Spectacular. .. .. .Welcome Home, Do not think twice, it will not last, This property has been completely renovated , New Roof, New Windows, New Floors, New Lighting, new Appliances, New HVAC, New Water heater, new Bathrooms, New kitchen, New Fence, New Driveway, and most Importantly all Electric wiring totally new, and not only that New plumbing including all sewer lines are new. Basement fully finished with a lot of potential space for kitchen, can be use as potential Rental extra Income, 2 Families can live with a very good space, Huge and Fenced backyard, Any questions please do not hesitate to call Gloria. No FHA Loans, due the timing. READY TO MOVE AND HAVE PEAC
This ready rambler is coming to the market just in time for spring, boasting 5 bedroom and 2 full baths. This home opens up to an open floor plan on the main level with a living room spaces that gazes right into an open kitchen with complimenting island right in the center. This home provides the separation of living spaces with three bedrooms on the upper level and two bedrooms on the lower level almost perfectly suitable for a separate living quarters. This home offers off street parking and a gated backyard that provides ample entertainment space, storage space and perfect for any size function. The mature and meticulous seclusion that the Pepper Mill subdivision offers does not rob you
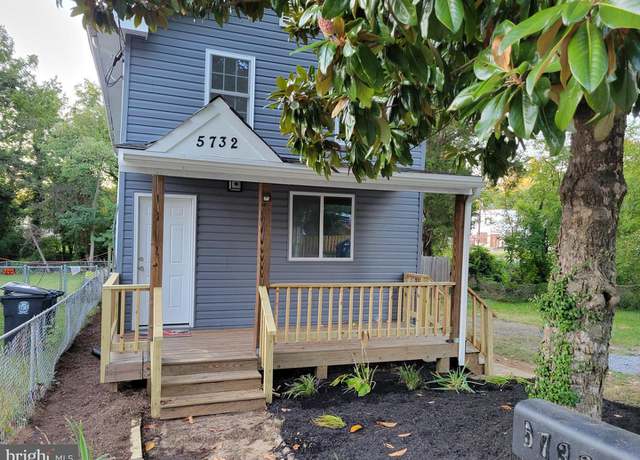
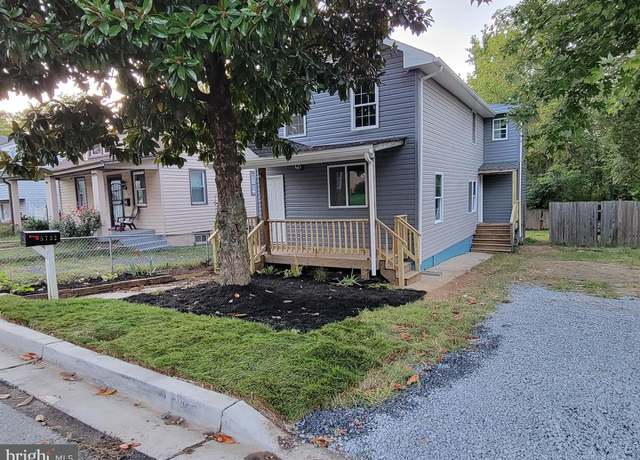
* * * Rebuilt not renovated! Welcome to 5718 Jefferson Heights, where historic charm meets modern luxury! Originally built in 1930 and meticulously Rebuilt and Reborn in 2024, this stunning residence seamlessly blends classic architectural elements with contemporary convenience was totally and completely constructed and rebuilt all the way to the studs! Situated on an expansive lot, this property boasts an impressive size, providing ample space for outdoor enjoyment, gardening, or potential expansion. The sprawling grounds offer endless possibilities for outdoor living and entertaining, making it a true oasis in the heart of the city. Nestled in a unique and vibrant neighborhood, residen
Discover an unparalleled investment opportunity with this expansive 5-bedroom, 3-bathroom home, nestled in a prime location on a substantial lot divided into two distinct parcels, each boasting its own tax code. This unique setup offers the potential to build an additional residence, presenting a lucrative chance for investment expansion or the creation of your dream living space. The property features 400 sqft of bonus storage space, ripe for conversion into a car garage or an inviting in-law suite, adding even more value and versatility to this already desirable home. Situated within easy walking distance to the metro, this home ensures commuting is a breeze. Additionally, with close prox
Agents: very nice large single family with 2128 living space lower level fully finished & maintained lovely 5Br/2Ba - 2 level home features: New roof, fresh paint, hardwood floors throughout all of the main level including the bedrooms * eat-in kitchen * dining room * living room * 3Br/1Ba on the main level and 2Br/1Ba, 2nd kitchen and combined dining/ living on the basement walkout level * fenced in backyard w/ patio * deck * roof 2022 * windows 2010 * a/c 2020 * furnace 2018 * lots of storage space * driveway parking * newer siding * perfect starter home for less then rent * move in To start the new year off in your new home * agents check doc manager for disclosures. SOLD"
This to-be-built new construction home by Werrlein Properties is will be available in the coming months. It will include three finished levels with 5 bedrooms and 3.5 baths. Capitol Heights is just a short distance from Washington D. C. , and this location is within walking distance to numerous public transportation stops that easily transport you to work and/or all of the action of the city, but offers that residential feel. A few short blocks away you will find the numerous amenities offered at the Oakcrest Community Center, which include basketball courts, a weight room, multi-purpose sports fields, and tennis courts.
PRICE JUST REDUCED - This charming home is being sold "as is" and offers incredible potential with a huge lot/yard, 5 nice sized bedrooms, 3 full baths, it is a blank canvas just waiting for your creative touch. With a little TLC, this home can become a dream haven. Home boast wood floors through out the main level including bathrooms, deck off the living room, solar panels for energery cost savings, a newer roof, furnace, water heater, all less than 5 years old. On the main level are two bedrooms and 2 full baths. The lower level has a fully finished carpeted basement with plenty of space for storage, 3 bedrooms, and a full bath. Take advantage of this amazing opportunity to own
Charming interior townhouse features three bedrooms, two full baths, and one half bath. Freshly painted and with all new carpeting, don't miss out on this one! The main level includes a large living room, dining room, kitchen with pantry, and a large deck overlooking your fully fenced private back yard. Upstairs there are three bedrooms, a family bath, and a master bath. The unfinished basement is roughed in for another bathroom, and has a washer and dryer. Two reserved parking spaces
WELCOME TO THIS BEAUTIFYLLY FINISHED 4 BED 3 BATH COZY HOME IN HEART OF CAPITOL HEIGHTS . THIS SINGLE FAMILY HOME HAS BEEN THOUGHTFULLY RENOVATED FROM TOP TO BOTTOM WITH A PERFECT COMBINATION OF ORIGINAL CHARM WITH GORGEOUS UPDATES. THE WELCOMING FRONT PORCH OFFERS THE PERFECT BACKDROP TO ENJOY MORNING COFFEE AND NEWS[PAPER! THIS HOME BOAST OF NEW FLOORING, RECESSED LIGHTING, CEILING FANS , RENOVATED BATHROOMS , BRAND NEW FRIDGE, STOVE, WASHER AND DRYER. STAINLESS STEEL APPLIANCES, GRANITE COUNTER TOP WITH BACKSPLASH, NICE KITCHEN CABINET, NEW HVAC. NEW ROOF . THE BASEMENT FEATURES 1 BEDROOM AND 1 FULL BATH WITH REC AREA, . STORAGE ROOM, WALK OUT ENTRANCE. THE HOUSE IS FEW MILES FRO
To Be Built New Construction House. New Single Family custom house to be built. Come customize your dream house for a 10,000 Sq foot lot. 6 Bedrooms and 4 bathrooms 2,700 Sq feet above grade. Features a separate detached garage can be customized into a separate unit. Construction starts in two weeks and will be completed in 12 weeks. Any buyer contracts accepted by March 15th can customize their kitchen, bathrooms, paint colors, and more! Sample rendering of photos
OPEN HOUSE SAT. & SUN. From 1-4 PM weather permitting. Newly renovated semi-detached home in Deanwood. Beautifully redesigned with an open floor plan and signature color palette that satisfies the most discerning homebuyer. The main level opens to the spacious living room and dining area followed by the modern kitchen with top-of-the-line finishes. The main level bedroom and full bathroom are ideal for any occupants who would rather not do stairs. Additionally, you have the convenient main-level laundry area with a modern state-of-the-art washer and dryer package included. The upper level has 2 spacious bedrooms, a full bathroom, and a linen closet. Both bathrooms have a beautiful cera
FULLY RENOVATED 2BR/1BA WITH AN UPSTAIRS LOFT WITHIN WALKING DISTANCE OF THE METRO. EVERYTHIN IS BRAND NEW!! NEW WOOD FLOORS, NEW WHITE SHAKER CABINETS, NEW STONE COUNTERS, NEW DESIGNER TILE, NEW CARPET, NEW SS APPLIANCES, NEW WASHER DRYER, & FRESH PAINT. MOVE IN READY! MUST SEE PICTURES!
- Your opportunity to buy this beautiful house. Are you looking for a beautiful rambler-style home in Capital Heights? Come check out this fully-renovated home in a great location just outside the Capital City. The property is stocked with 3 bedrooms and 2 full baths. Upon entry, you will stumble upon a spacious open-concept living room connecting to the dining room. The kitchen hoists stainless steel appliances and granite countertops with a stained-wood open bar between the dining room and kitchen. Rear porch access via the kitchen and dining room makes easy accessibility to the backyard. This is your opportunity for those commuters looking for an affordable home just outside the D. C. bo
School data is provided by GreatSchools, a nonprofit organization. Redfin recommends buyers and renters use GreatSchools information and ratings as a first step, and conduct their own investigation to determine their desired schools or school districts, including by contacting and visiting the schools themselves.Redfin does not endorse or guarantee this information. School service boundaries are intended to be used as a reference only; they may change and are not guaranteed to be accurate. To verify school enrollment eligibility, contact the school district directly.
Homes for sale in Capitol Heights have a median listing price of $330K. Some of these homes are Hot Homes, meaning they're likely to sell quickly.
What are some of the most popular neighborhoods in Capitol Heights?
Popular neighborhoods include Benning Heights / Capitol View / Marshall Heights, Marshall Heights, Greater Capitol Heights, Dupont Heights, and North Forestville.
Capitol Heights, Maryland offers a variety of transportation options, including a well-connected public transportation system. The town is served by the Washington Metro's Blue and Silver Lines at the Capitol Heights station, providing easy access to the surrounding areas. For those who prefer to travel by car, traffic levels can vary, but peak hours may see increased congestion. Additionally, Capitol Heights is conveniently located near major highways such as the I-495 and Route 214, facilitating quick and easy travel to and from the town.
What types of properties are available in Capitol Heights?
Capitol Heights, Maryland offers a variety of single-family home types, including ranch-style, split-level, and colonial-style homes. These homes can be found throughout the city, with some located in established neighborhoods and others in more recently developed areas. Most properties in Capitol Heights, Maryland feature two to four bedrooms and were built between the 1950s and the present day. To explore different property types for sale in Capitol Heights, Maryland, use the 'Home type' filter located above the active listings. Customize your search by selecting options like single-family homes, condos, townhomes, and more.
What is life like in Capitol Heights?
Capitol Heights, Maryland offers a vibrant and bustling urban lifestyle. The region boasts a unique blend of residential and commercial areas, creating a dynamic landscape. The weather in Capitol Heights is characterized by distinct seasons, with hot summers and cold winters. The area provides a range of job opportunities, with a diverse mix of industries, including retail, hospitality, and healthcare. Residents can enjoy a variety of activities, such as exploring local parks, visiting community centers, and participating in recreational sports leagues.
What are the schools and amenities like in Capitol Heights?
Capitol Heights, Maryland offers a variety of public amenities to enhance the living experience of its residents. The town boasts a range of dining options with numerous restaurants to choose from. For those who enjoy outdoor activities, there are several parks available for leisure and relaxation. Daily necessities can be easily obtained from the local grocery stores situated within the town. Additionally, more amenities such as libraries, fitness centers, and shopping centers are also available to meet the diverse needs of residents.
In the past month, 9 homes have been sold in Capitol Heights. In addition to houses in Capitol Heights, there was also 1 condo, 12 townhouses, and 0 multi-family units for sale in Capitol Heights last month. Find your dream home in Capitol Heights using the tools above. Use filters to narrow your search by price, square feet, beds, and baths to find homes that fit your criteria. Our top-rated real estate agents in Capitol Heights are local experts and are ready to answer your questions about properties, neighborhoods, schools, and the newest listings for sale in Capitol Heights. Our Capitol Heights real estate stats and trends will give you more information about home buying and selling trends in Capitol Heights. If you're looking to sell your home in the Capitol Heights area, our listing agents can help you get the best price. Redfin is redefining real estate and the home buying process in Capitol Heights with industry-leading technology, full-service agents, and lower fees that provide a better value for Redfin buyers and sellers.


 REDFIN IS COMMITTED TO AND ABIDES BY THE FAIR HOUSING ACT AND EQUAL OPPORTUNITY ACT. READ REDFIN'S FAIR HOUSING POLICY AND THE NEW YORK STATE FAIR HOUSING NOTICE.
 United States
 Canada