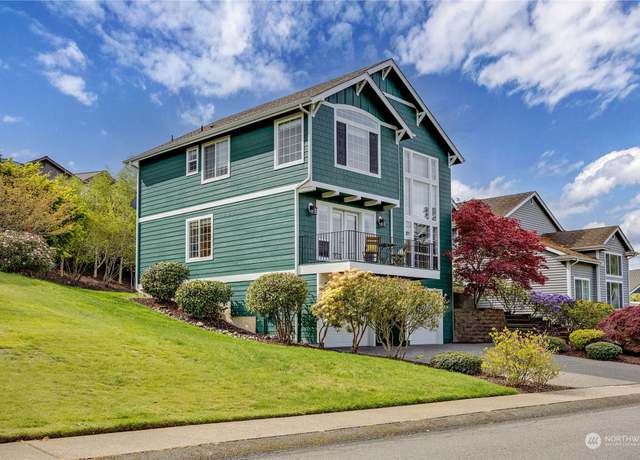
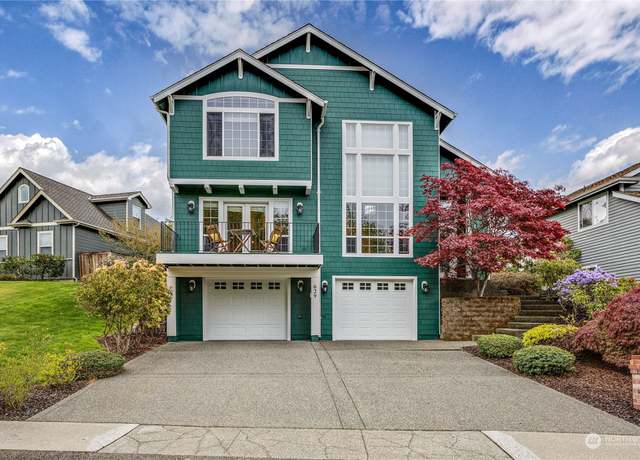
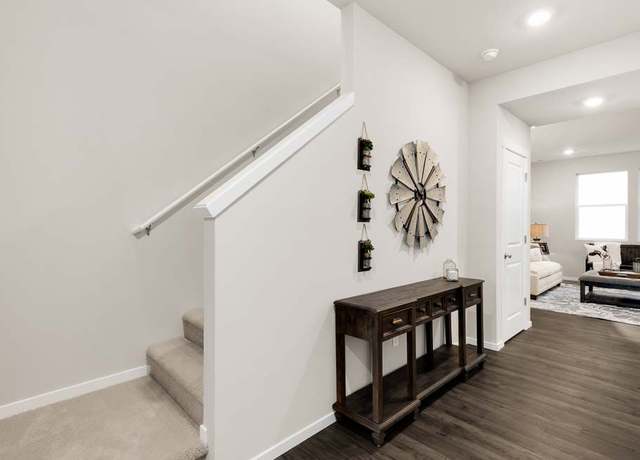
Sunlight cascades through the expansive two-story foyer & living space, painting a picture of warmth & luxury against the tall windows. The spacious kitchen, adorned w/ an island, granite countertops + gleaming stainless steel appliances, beckons culinary adventures. A see-through gas fireplace bridges the gap between the vibrant living room & cozy family area, creating an ambiance of shared comfort & connection. Step onto beautiful Acacia hardwood floors that grace the main level, inviting you to explore each corner. The Primary offers an indulgent ensuite & generous walk-in. Delve into the depths of the deep garage, extending a generous 30 feet + offering amp
1/35
$515,000
3 beds2.5 baths2,005 sq ft6,970 sq ft (lot)
629 Tufts Ave E, Port Orchard, WA 98366
Listing provided by NWMLS as Distributed by MLS Grid
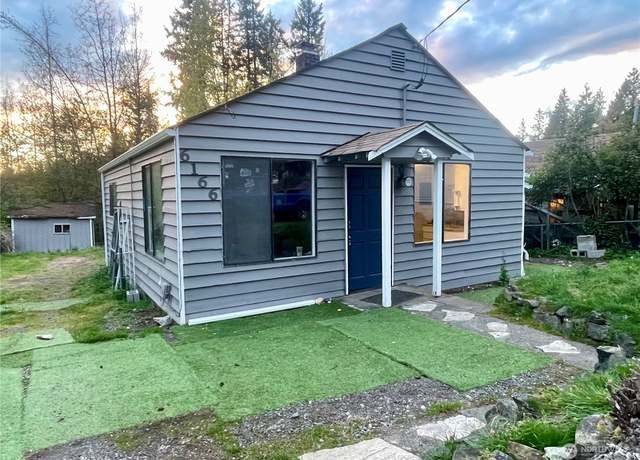
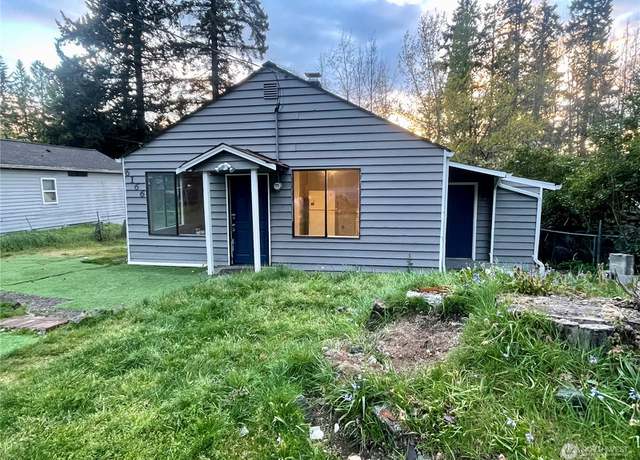
A perfect opportunity to add to your real estate portfolio. Whether you are looking to buy & hold, downsize or looking for a starter home, this one is for you! Property is fully fenced w/ a spacious detached garage w/ work bench, shed, room for gardening & tons of parking. Sitting on the outskirts of town, still conveniently located close to schools, shopping, & highway access. Bring your ideas and spice up this cutie! View today!
1/14
$287,777
2 beds1 bath771 sq ft8,712 sq ft (lot)
6166 Bethel Rd SE, Port Orchard, WA 98366
Listing provided by NWMLS as Distributed by MLS Grid
Discover serenity in Port Orchard! Original owner's meticulously maintained home, nestled on 2.5 sunny and open acres. Enjoy the wrap-around deck and take in the peek-a-boo mountain views. Enjoy easy living on one level and the convenience of a walk-out finished downstairs. Plenty of flexible space for a home office, gym, studio or more. NEW ROOF! Lovely hardwood floors, gas fireplaces. Beautiful yard with fruit trees, plenty of room for your dream garden. This property offers privacy along with easy proximity to local amenities. Banner Forest is right around the corner for forest walks. Fabulous commuter location: Southworth ferry terminal just 5 minutes down the road, ensuring easy access
$849,950
3 beds2.5 baths2,909 sq ft2.50 acres (lot)
5224 Lars Hansen Rd SE, Port Orchard, WA 98367
Listing provided by NWMLS as Distributed by MLS Grid
Come Prepared To Full In Love With Your New Home! Introducing Your Dream Home: A Spacious 3-Bedroom, 2.5-Bath Retreat! Welcome to your new oasis of comfort and style, where contemporary living meets timeless charm. This stunning 3-bedroom, 2.5-bath home offers the perfect blend of elegance, functionality, and convenience, making it your ideal choice. The exterior of the home is as captivating as the interior. Enjoy sunny afternoons in the professionally landscaped backyard, creating the perfect space for outdoor barbecues, gardening, or simply relaxing with a book. RV Parking & New Roof and Exterior Paint make this home truly MOVE IN ready. Don't miss the opportunity to make this hous
$750,000
3 beds2.5 baths2,529 sq ft0.35 acre (lot)
9664 SE Driftwood Dr, Port Orchard, WA 98367
Listing provided by NWMLS as Distributed by MLS Grid
Discover tranquility in the single-story sanctuary nestled in a sought-after locale. Embrace panoramic water vistas and stunning Olympic Mountain Range views from the comfort of your home. Mature landscaping envelopes this serene abode, offering privacy and natural beauty. Enjoy seamless access to the marina, ferry, shopping, and esteemed schools, making everyday conveniences a breeze. Don't miss this rare opportunity to embrace waterfront living in a cherished community.
$800,000
3 beds2 baths2,307 sq ft0.48 acre (lot)
1941 Vista Rama E, Port Orchard, WA 98366
Listing provided by NWMLS as Distributed by MLS Grid
Welcome Home to this pristinely maintained home in the exclusive McCormick Woods golf course enclave! This home is truly a rare find on an oversized lot backing to the greenbelt and located on a quiet cul-de-sac. Walking into the prestigious entry way you are greeted by vaulted ceilings and a spacious open floor plan. The first floor has two dining areas, a living room, office and laundry room. The elegant staircase leads to a loft area with skylights and 4 bedrooms. The ensuite primary bedroom features a dual sided gas fireplace and a 5-piece bath with a soaking tub and a oversized walk-in shower. The large yard has a patio and plenty of room for gardens or just enjoy the extra space. New
$635,000
4 beds2.5 baths2,272 sq ft0.27 acre (lot)
7786 Broadstone Pl SW, Port Orchard, WA 98367
Listing provided by NWMLS as Distributed by MLS Grid
This charming split-level home has endless potential! The starts of opening up the kitchen has already been done for you, while the shared bathroom upstairs has been tastefully updated. The main level boasts large windows allowing plenty of natural light and a spacious back deck for entertaining. Downstairs you'll find a finished basement with a bathroom and patio of its own, providing multiple living options. Conveniently tucked away from the hustle and bustle yet only a 10-minute drive to town. Whether its splitting wood, gardening, or needing space to enjoy your hobbies- this one has it all!
$430,000
3 beds2.5 baths1,907 sq ft1.25 acres (lot)
260 SE Rim Ln, Port Orchard, WA 98367
Listing provided by NWMLS as Distributed by MLS Grid
Northwest Dream Home with the perfect touches. Vaulted ceilings, river stone fireplace, custom Andersen windows and skylights throughout fill the house with natural light. Breathtaking Chef and Bakers Kitchen with drop down Marble slab, double oven, several sinks, walk-in pantry and wine storage room. Grand Primary suite with fireplace, brand new 5-piece bath and spacious walk-in closet. 800+ SQFT wrap around Ipe (Brazilian Walnut) deck ready to entertain any event and a 1400 SQFT fully insulated drive through shop/garage. Brand new roof and carpet just installed. Don’t miss out on this one of a kind, 1 story custom!
$875,000
3 beds2 baths2,892 sq ft2.08 acres (lot)
3782 SE Engledow Ln, Port Orchard, WA 98367
Listing provided by NWMLS as Distributed by MLS Grid
Tucked amidst towering pines on 1.9 acres, this exceptionally remodeled Port Orchard home close to Hwy 16 is a must-see! Discover a split-level foyer where the seamlessly flowing main entertaining areas beckon you to gather by a stately fireplace or under an elegant chandelier. Impeccably updated, the kitchen features premium appliances, sleek quartz countertops, an oversized island, a pendant-lit breakfast nook with built-in banquette seating, and custom cabinetry. Two comfortable bedrooms share an upgraded bath with heated marble flooring. The generous primary suite showcases a luxurious ensuite with skylights, radiant marble underfoot, and a freestanding tub. Come grab this opportunity b
$750,000
3 beds2.5 baths1,684 sq ft1.98 acres (lot)
5950 SE Mullenix Rd, Port Orchard, WA 98367
Listing provided by NWMLS as Distributed by MLS Grid
Why wait for new. .. this stunning home will fit the bill. McCormick Woods Gem offers 5 beds/3 baths of clean, light and bright living! Main floor bedroom & spacious entry welcome you. New paint & carpet give that new feel. Cozy gas fireplace in living room enhances the experience and view of the 17th hole from the kitchen and living room - & the 18th hole from the front. Gorgeous kitchen w/ glass tile backsplash & large quartz island w/ seating. Upper level large Den/Bonus Room is convenient for any purpose. Hot tub & back patio for full enjoyment on the golf course. Primary w/ 5 piece bath, soaking tub, walk-in closet + second walk-in closet upstairs. Just mi
$755,000
5 beds3.5 baths2,706 sq ft7,405 sq ft (lot)
7131 Roxburghe Pl SW, Port Orchard, WA 98367
Listing provided by NWMLS as Distributed by MLS Grid
Nestled amidst 1.5 acres of natural beauty, this family homestead stands as a testament to care, creativity, and connection with the land. Each log in this home carries a story, a history etched into its grain. These logs are hewn from the very property. Exquisite craftsmanship shows the labor of love that resonates in every corner. Notches fit seamlessly, chinking snugly fills gaps, and hand-carved accents add character. Enjoy a nature trail through your private forest. An art studio is a sanctuary for expression. Whether you’re a seasoned artist or a novice with dreams, this space invites you to create. A shop is ready for next project. This log home, built with love awaits its next
$419,000
1 bed1.5 baths1,050 sq ft1.52 acres (lot)
1155 SE Fauna Ln, Port Orchard, WA 98367
Listing provided by NWMLS as Distributed by MLS Grid
Welcome to your spacious haven with breathtaking views! This home boasts a generously sized layout and a large, fully fenced, backyard with low-maintenance terraced landscaping and a spacious patio perfect for enjoying outdoor living without the hassle. Every corner of this home is thoughtfully crafted for modern living. Discover the epitome of comfort, style, and functionality in this stunning abode. Situated just moments from Southworth Ferry and Manchester State Park. You'll have easy access to all Seattle has to offer or the natural beauty of the state park. Take in stunning water views and catch glimpses of the iconic Seattle skyline. Don't miss out on this rare opportunity to live the
$599,900
3 beds3.5 baths2,332 sq ft0.27 acre (lot)
7374 E Grandview St, Port Orchard, WA 98366
Listing provided by NWMLS as Distributed by MLS Grid
Searching for a single-story plan that’s perfect for entertaining? Add the Arlington to your list! This luxurious home offers an open layout with a spacious great room, a dining room and an impressive gourmet kitchen with a center island, a walk-in pantry, study and covered patio. A lavish owner’s suite featuring a private bath and an oversized walk-in closet is separated from two additional bedrooms for privacy. * * If you are working with a licensed broker please register your broker on your first visit to the community per our site registration policy.
$619,990
3 beds2 baths1,957 sq ft6,693 sq ft (lot)
6241 Marymere Rd SW #207, Port Orchard, WA 98367
Listing provided by NWMLS as Distributed by MLS Grid
“ASK ABOUT SPECIAL FINANCING!! Estimated Completion in April! The main floor features a great room with a fireplace, a gourmet kitchen w/ center island, & dining area. Upstairs, you’ll find a central laundry, a large loft, a full bath and 3 generous bedrooms, including a lavish primary suite showcasing an immense walk-in closet and private deluxe owners bath. 9 foot ceilings and 8-foot-tall doors on first and second level. * * If you are working with a licensed broker please register your broker on your first visit to the community per our site registration policy.
$574,990
3 beds2.5 baths2,300 sq ft4,591 sq ft (lot)
6455 Halyard Cir SE #111, Port Orchard, WA 98367
Listing provided by NWMLS as Distributed by MLS Grid
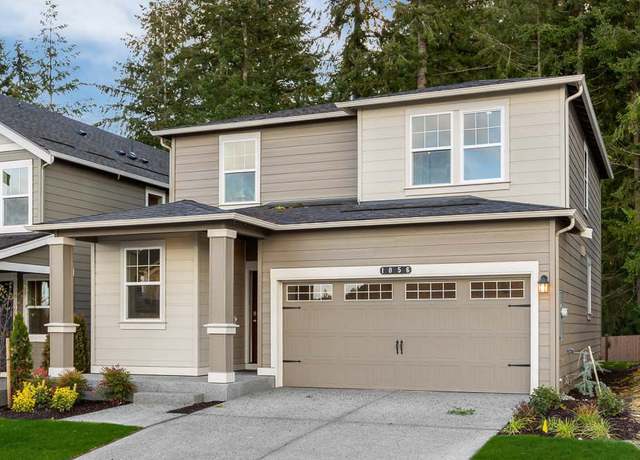
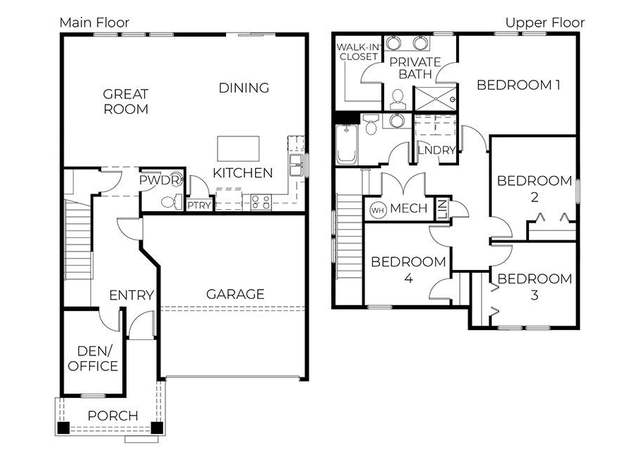
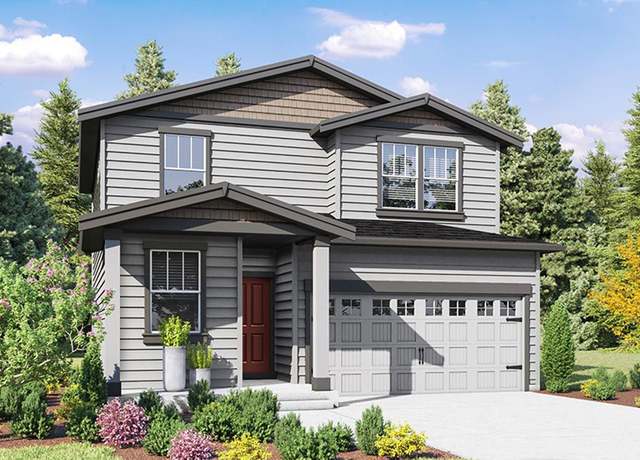
DR Horton at Stetson Heights, our gorgeous new home community in Port Orchard. The timeless CAMBRIDGE boasts a wonderful great room design w/ a large kitchen island, gas cooking w/ stainless appliances, slab quartz counters, soft-close cabinets, eating nook, & dining room. Upstairs, you'll love the 4 bedrooms + huge bonus room w/ closet (or turn the bonus into a fifth bedroom), 2 full baths, and utility room. A/C and smart home features included! Fully landscaped backyard is partially fenced. Enjoy open spaces, scenic nature views, majestic sunrise and sunsets at Stetson Heights. Brokers must register their Buyer on or before first visit, including open houses. JULY Completion.
$579,995
5 beds2.5 baths2,335 sq ft5,385 sq ft (lot)
1340 SW Fielder Pl #259, Port Orchard, WA 98367
Listing provided by NWMLS as Distributed by MLS Grid
Welcome to D. R. Horton's Stetson Heights, a new home community in Port Orchard. The BERKSHIRE has everything you need w/ lots of natural light throughout. 4 bed + office, 2.5 bath w/ all the luxury of a new home including A/C. Open entry & spacious hallway leads to your great room. Entertain easily w/ your kitchen, dining & living space all together. Enjoy the kitchen island, slab quartz counters, lots of storage & large bright windows. Main floor office makes working from home very easy! Private suite boasts separate bath & walk-in closet. Generous fully landscaped and partially fenced backyard for you! Brokers must register their Buyer on or before first visit, in
$534,995
4 beds2.5 baths1,860 sq ft3,974 sq ft (lot)
1361 SW Pendleton Way #285, Port Orchard, WA 98367
Listing provided by NWMLS as Distributed by MLS Grid
1-of-1 estate featuring a rambler home, private lake, & 3 additional buildable parcels each with lake frontage. This storybook property of 28.91 acres fully encompasses the private lake known as Honey Lake. The rambler home w/ full daylight basement is just shy of 3000 SF & has been fully remodeled. Kitchen on main & lower levels, modernized bathrooms, & massive deck overlooking the lake. Newly created beach area w/ retaining wall & expansive dock extending into lake. Gated entry w/ roads in place that circle the lake & weave throughout property. The additional land is split into 3 parcels w/ lake frontage so you can build multiple homes or keep for privacy
$1,999,000
3 beds3 baths2,904 sq ft28.91 acres (lot)
4601 Beauty Lake Rd SW, Port Orchard, WA 98367
Listing provided by NWMLS as Distributed by MLS Grid
Welcome to D. R. Horton's community Stetson Heights in Port Orchard! The SHERWOOD has everything you need with natural light throughout. 4 bed, 2.25 bath with the luxury of a new home. Entertain easily w/ your kitchen, dining and living space all open together. Enjoy the island kitchen w/ slab quartz counters, walk-in pantry, lots of storage and large bright windows. Upstairs utility room w/ all 4 bedrooms. Private primary suite boasts a walk-in shower with double sinks and walk-in closet. Large flat and landscaped front & backyard for you! A/C and smart home features included! It will be close to the 2nd park being installed in Phase 3. Brokers must register their Buyer on or before
$518,995
4 beds2.5 baths1,725 sq ft4,000 sq ft (lot)
1358 SW Pendleton Way #204, Port Orchard, WA 98367
Listing provided by NWMLS as Distributed by MLS Grid
Stetson Heights Phase 3, D. R. Horton's new home community in Port Orchard. The BALLARD is a large 4 Br + loft home featuring a den/5th bedroom and 3/4 bath on the main floor, a fabulous great room w/ island kitchen, slab quartz counters, stainless appliances, soft-close cabinets, and separate dining room. Upstairs, 4 bedrooms, 2 bathrooms, open loft, and utility room finish off this fantastic home. Partially fenced and fully landscaped backyard! A/C and smart home features included! Enjoy open spaces, beautiful views and easy highway access. The Port Orchard waterfront and marina feature a great place for walks. Brokers must register their Buyer on or before first visit, including open hou
$614,995
5 beds3 baths2,535 sq ft6,999 sq ft (lot)
1339 SW Fielder Pl #257, Port Orchard, WA 98367
Listing provided by NWMLS as Distributed by MLS Grid
Welcome to Dunmore in McCormick Woods. This rambler is simply stunning. Great room concept lives large with the spacious kitchen with granite counters, and stainless steel appliances, walk-in pantry & a kitchen island great for entertaining. Living area has a cozy gas fireplace to keep you warm. Tall ceilings makes this home live large. Primary suite has a nice walk-in tile shower, tall counters and double sinks. The other 2 bedrooms are on the other side of the home with a bath in between. Great for guests or office space. Enjoy the fenced backyard with beautiful landscaping, a covered patio and your very own putting green. Enjoy the McCormick Woods lifestyle with golf course, nature
$719,900
3 beds2 baths1,814 sq ft7,841 sq ft (lot)
2261 Donnegal Cir SW, Port Orchard, WA 98367
Listing provided by NWMLS as Distributed by MLS Grid
* Curated, upgraded finishes included * Searching for a single-story plan that’s perfect for entertaining? The brand-new plan, the Abbot, offers an open layout with a spacious great room, a dining room and an impressive gourmet kitchen with a center island, a walk-in pantry, study and covered patio. A lavish owner’s suite featuring a private bath and an oversized walk-in closet is separated from two additional bedrooms for privacy. * * If you are working with a licensed broker, please register your broker on your first visit to the community per our site registration policy. "ASK ABOUT SPECIAL FINANCING!!”
$624,990
3 beds3 baths1,965 sq ft5,048 sq ft (lot)
6201 Marymere Rd SW #203, Port Orchard, WA 98367
Listing provided by NWMLS as Distributed by MLS Grid
Come home to this centrally located in the heart of Port Orchard, 2020 built, 1814 sqft home featuring 3 beds & 2.5 baths on a quiet dead end street. The open concept floor plan on the main level boasts high ceilings & allows for ease of entertaining. The eat-in kitchen include SS appliances & walk-in pantry with lots of storage. The open concept great room area has a lovely gas fireplace for comfort & ambiance. Upstairs you will find a large loft area plus 3 bedrooms & a full bath. The primary suite includes a private ensuite & 2 closets. Enjoy convenient upstairs laundry. New interior paint throughout. Backed up to a treed greenbelt, the easy maintenanc
$525,000
3 beds2.5 baths1,814 sq ft3,750 sq ft (lot)
2202 Garfield Pl SE, Port Orchard, WA 98366
Listing provided by NWMLS as Distributed by MLS Grid
Home Sweet Home awaits you in this 3-Bed/1.75-Ba/2-Car Rambler!Perfect blend of modern comfort and cozy living w/ oodles of upgrades throughout including beautiful remodeled kitchen w/ gorgeous cabinets(soft close & pullouts), quartz countertops & SS appliance w/ a gas cooktop with grill, heated bath tile floors-primary bath has shower panel w/ rainfall feature-jetted tub/shower combo in 2nd bath, year-round comfort w/ mini-split system(heat/ac), temperature-controlled gas FP, fenced backyard w/ Trex decking-hot/cold water spigot, updated plumbing & windows, tankless water heater, wired for generator, carpet free, storage sheds, covered carport for boat storage, and ample
$465,000
3 beds2 baths1,217 sq ft0.24 acre (lot)
2845 SE Alson Ct, Port Orchard, WA 98366
Listing provided by NWMLS as Distributed by MLS Grid
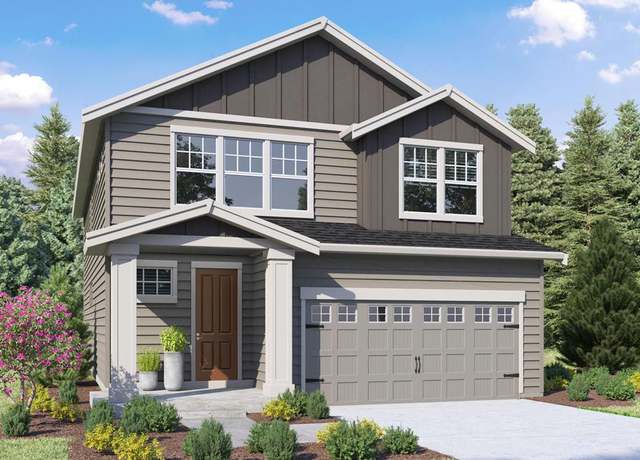
Looking for a home that checks all the boxes? THIS IS IT!! Close to the Ferry's, Seattle, shopping and more! Welcome to Lennar's newest community, Parkside in Port Orchard! Introducing the Winnipeg plan! The first level of this two-story home is host to a generous open floorplan shared between the kitchen, dining room and Great Room, with access to the outdoor space for easy entertaining. All four bedrooms occupy the second level of the home, including the luxe owner’s suite, which is comprised of a restful bedroom, en-suite bathroom and walk-in closet. If you are working with a Licensed Broker they must accompany you on the first visit per site registration policy.
$464,950
4 beds2.5 baths1,950 sq ft3,889 sq ft (lot)
4317 SE Elijah Ct #20, Port Orchard, WA 98366
Listing provided by NWMLS as Distributed by MLS Grid
Welcome to Lennar's newest community Four Season's in Port Orchard!! Introducing the Sawyer plan! The first level of this two-story home is host to a generous open floorplan shared between the kitchen, dining room and Great Room, with access to the outdoor space for easy entertaining. All four bedrooms occupy the second level of the home, including the luxe owner’s suite, which is comprised of a restful bedroom, en-suite bathroom and walk-in closet. If you are working with a Licensed Broker they must accompany you on the first visit per site registration policy.
$449,950
4 beds2.5 baths1,687 sq ft3,735 sq ft (lot)
4258 SE Woodford Ct #7, Port Orchard, WA 98366
Listing provided by NWMLS as Distributed by MLS Grid
Welcome home to your low maintenance, single level, corner lot home with so many upgrades! This 3 bedroom 1.75 bath plus an office home has it all. Chefs kitchen with upgraded countertops, laminate flooring, open floorplan, 9 foot ceilings, surround sound speakers, gas fireplace, and A/C for the coming summer days! Covered back patio/deck with gas plumbed for all of the BBQ'ing. Front yard is equipped with sprinklers. Huge primary suite with walk-in closet and private bathroom, separate laundry room, large garage, this home has it all!! All appliances stay. Best of all, convenient location to town, the freeway, and ferry but just out of the hustle and bustle of it all. Check this place out
$625,000
3 beds2 baths1,740 sq ft4,792 sq ft (lot)
6762 Skipper Ln SE, Port Orchard, WA 98367
Listing provided by NWMLS as Distributed by MLS Grid
Stunning home in The Ridge at McCormick Woods! Previously a model home to showcase superior craftmanship & upgrades, this home features engineered hardwood flrs, whole house speaker system, A/C, gas fireplace, sprinkler systems, tankless H20 heater & 90% efficient furnace! Main floor includes bdrm w/ full bath, fully-finished garage w/ add'l flex room! Enjoy the open concept kitchen w/ large island, SS appliances, gas range & walk-in pantry. Upstairs, discover a huge loft w/ more flex space, mastersuite w/ massive walk-in closet & 5 pc bath, 2 add'l bdrms w/ walk-in closets. Discover your private, fenced yard boasting new composite deck w/ built-in hot tub
$629,950
4 beds3 baths2,770 sq ft5,663 sq ft (lot)
4680 Chanting Cir SW, Port Orchard, WA 98367
Listing provided by NWMLS as Distributed by MLS Grid
Have you ever dreamt of a picturesque PNW ranch nestled among the emerald woodlands of the Kitsap Peninsula? An enchanting welcome awaits you at this spacious single level home & massive 36x40 shop, thoughtfully situated on 2.54 tranquil acres. Spacious layout leaves room for all & has been recently adorned with multiple new upgrades! The chef of the house will swoon over massive kitchen featuring designer finishes, gas range & picture windows overlooking your private forest. Retreat like primary suite with W/ I closet & large tiled shower. Enjoy your favorite refreshment by the mesmerizing Koi pond. Massive shop and detached garage is perfect collectors of vehicles
$719,900
3 beds2 baths1,815 sq ft2.54 acres (lot)
3575 SE Soholt Ln, Port Orchard, WA 98367
Listing provided by NWMLS as Distributed by MLS Grid
Based on information submitted to the MLS GRID as of Sun Apr 28 2024. All data is obtained from various sources and may not have been verified by broker or MLS GRID. Supplied Open House Information is subject to change without notice. All information should be independently reviewed and verified for accuracy. Properties may or may not be listed by the office/agent presenting the information. Some IDX listings have been excluded from this website.
This area's enrollment policy is not based solely on geography. Please check the school district website for more information.
Elementary schools
Middle schools
High schools
GreatSchools Summary Rating
6/10
Hidden Creek Elementary School
Public, PreK-5
6/10
East Port Orchard Elementary School
Public, PreK-5
5/10
Explorer Academy
Public, K-12 • Choice school
4/10
Sidney Glen Elementary School
Public, PreK-5
School data is provided by GreatSchools, a nonprofit organization. Redfin recommends buyers and renters use GreatSchools information and ratings as a first step, and conduct their own investigation to determine their desired schools or school districts, including by contacting and visiting the schools themselves.Redfin does not endorse or guarantee this information. School service boundaries are intended to be used as a reference only; they may change and are not guaranteed to be accurate. To verify school enrollment eligibility, contact the school district directly.
Port Orchard, Washington boasts a well-structured transportation system with several options for residents. The city experiences moderate traffic levels, making driving by car a relatively smooth experience. Public transportation is available, with Kitsap Transit providing bus services throughout the region. Additionally, Port Orchard is conveniently located near major highways, including Highway 16 and 3, offering easy access to surrounding areas. Learn more on our Port Orchard city guide.
What types of properties are available in Port Orchard?
Port Orchard, Washington offers a variety of single-family home types, including ranch-style homes, contemporary homes, and craftsman-style homes. These homes can be found throughout the city, with ranch-style homes commonly found in neighborhoods like McCormick Woods and contemporary homes scattered throughout various subdivisions. Craftsman-style homes can be found in established neighborhoods such as Manchester and Annapolis. Most properties in Port Orchard offer 3-4 bedrooms and were built between the 1970s and early 2000s. To explore different property types for sale in Port Orchard, Washington, use the 'Home type' filter located above the active listings. Customize your search by selecting options like single-family homes, condos, townhomes, and more.
What is life like in Port Orchard?
Port Orchard, Washington offers a serene and picturesque setting with its stunning landscape surrounded by lush greenery and breathtaking water views. The region experiences a mild climate, with warm summers and cool winters. Job opportunities in Port Orchard are diverse, with a range of industries such as healthcare, education, and manufacturing. Residents can engage in various recreational activities, including exploring local parks, hiking trails, and enjoying water sports on the nearby Puget Sound. The community also hosts a variety of cultural events and festivals throughout the year, providing ample opportunities for residents to immerse themselves in the local culture.
What are the schools and amenities like in Port Orchard?
Port Orchard, Washington is well-equipped with various public amenities to cater to the needs of its residents. The city boasts a number of restaurants, offering a variety of cuisines to satisfy diverse culinary preferences. Outdoor enthusiasts will appreciate the numerous parks scattered throughout the city, providing ample space for relaxation and recreation. For daily necessities, there are several grocery stores conveniently located across Port Orchard. Additional amenities in the city include libraries, fitness centers, and a post office, ensuring a comfortable and convenient lifestyle for all residents.
In the past month, 54 homes have been sold in Port Orchard. In addition to houses in Port Orchard, there was also 1 condo, 1 townhouse, and 3 multi-family units for sale in Port Orchard last month. Find your dream home in Port Orchard using the tools above. Use filters to narrow your search by price, square feet, beds, and baths to find homes that fit your criteria. Our top-rated real estate agents in Port Orchard are local experts and are ready to answer your questions about properties, neighborhoods, schools, and the newest listings for sale in Port Orchard. Our Port Orchard real estate stats and trends will give you more information about home buying and selling trends in Port Orchard. If you're looking to sell your home in the Port Orchard area, our listing agents can help you get the best price. Redfin is redefining real estate and the home buying process in Port Orchard with industry-leading technology, full-service agents, and lower fees that provide a better value for Redfin buyers and sellers.


 REDFIN IS COMMITTED TO AND ABIDES BY THE FAIR HOUSING ACT AND EQUAL OPPORTUNITY ACT. READ REDFIN'S FAIR HOUSING POLICY AND THE NEW YORK STATE FAIR HOUSING NOTICE.
 United States
 Canada