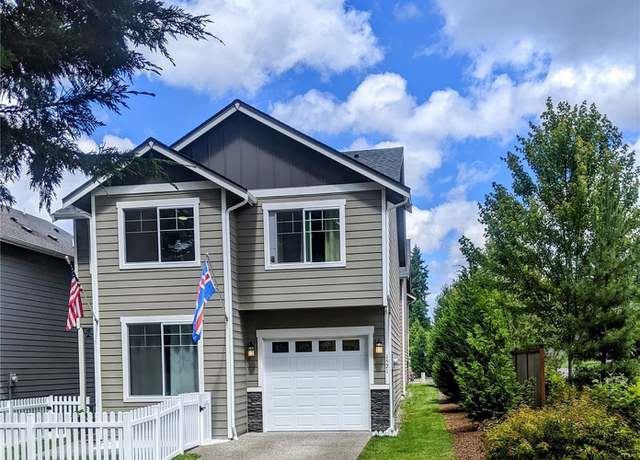
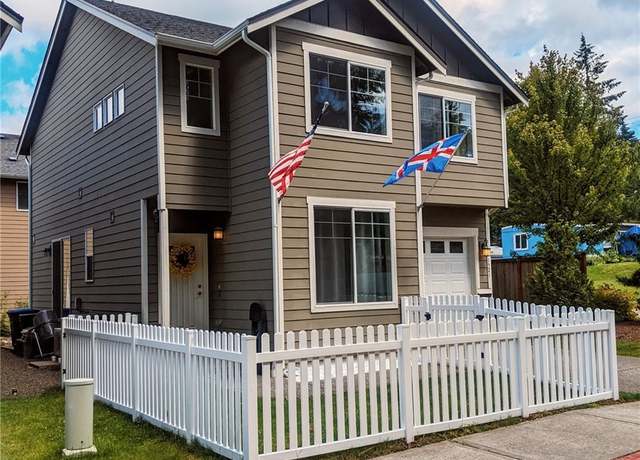
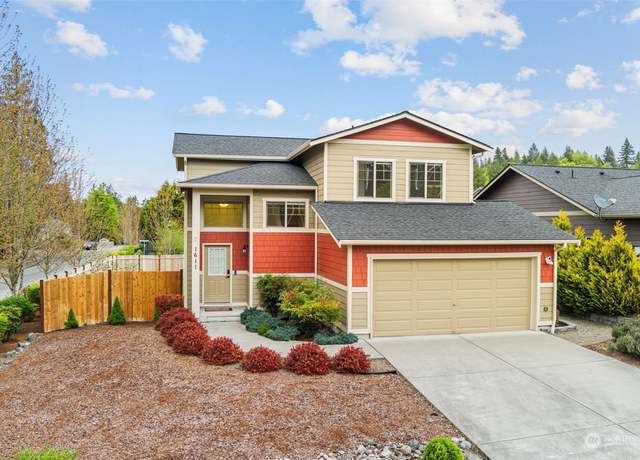
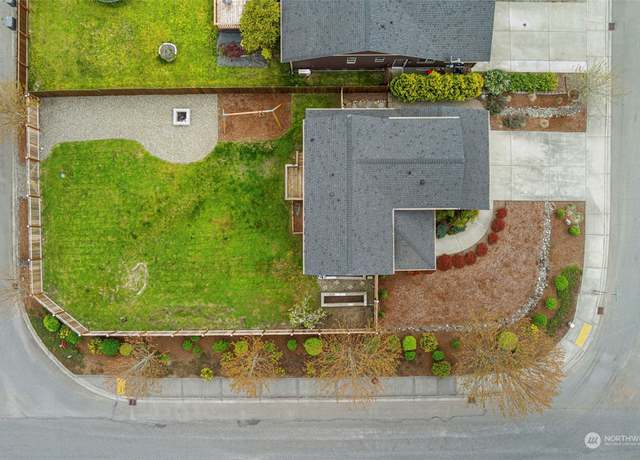
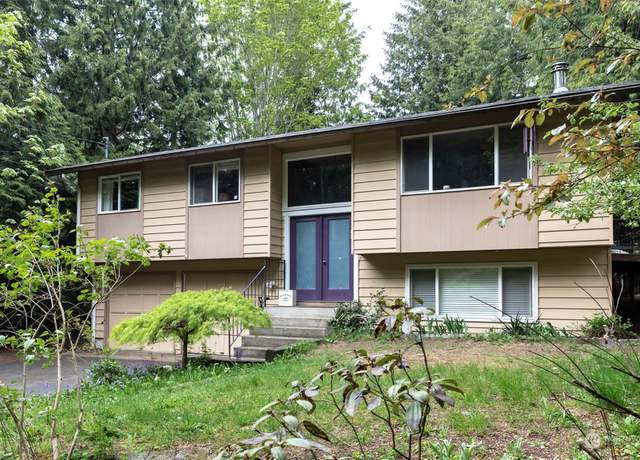
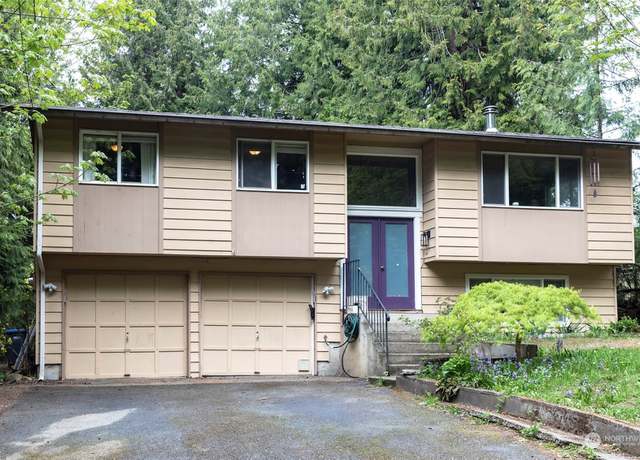
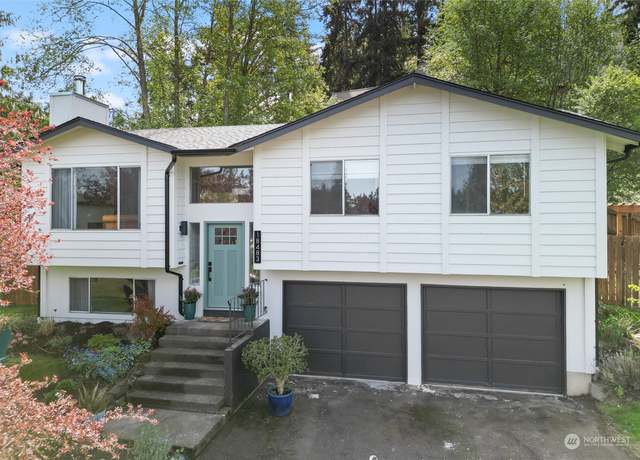
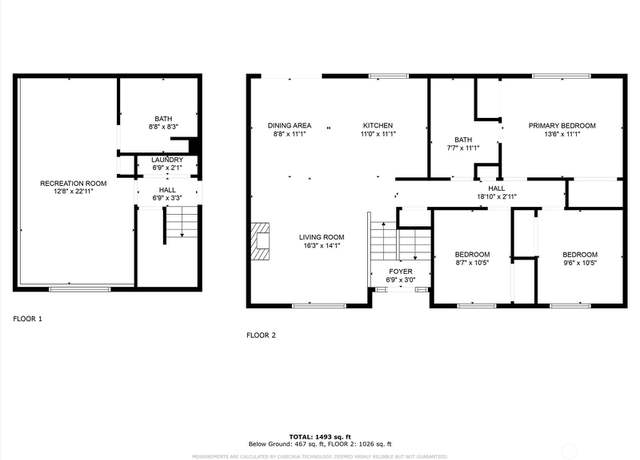
MOTIVATED SELLER ~ Must Sell !! Welcome home to this charming 4-Bed, 2.5-bath haven in the highly sawt after heart of Poulsbo! The open floor plan boasts a beautiful eat-in kitchen with a Large Island, seamlessly connecting to the Great Room featuring a cozy fireplace for chilly nights. The spacious Primary Bedroom offers a Private Bath and ample closet space. You'll love the thoughtful decorative touches from children throughout. Close to shopping, award-winning Poulsbo Schools, & wonderful Raab Park, it's truly an ideal location! Commuting is a breeze with easy access to Navy Bases: Bangor, Keyport, and PSNS. Don't miss out on your dream home with a white picket fence! Short Sale: re
1/22
$499,000
4 beds2.5 baths1,682 sq ft2,178 sq ft (lot)
1521 NE Fontaine Way, Poulsbo, WA 98370
Listing provided by NWMLS as Distributed by MLS Grid
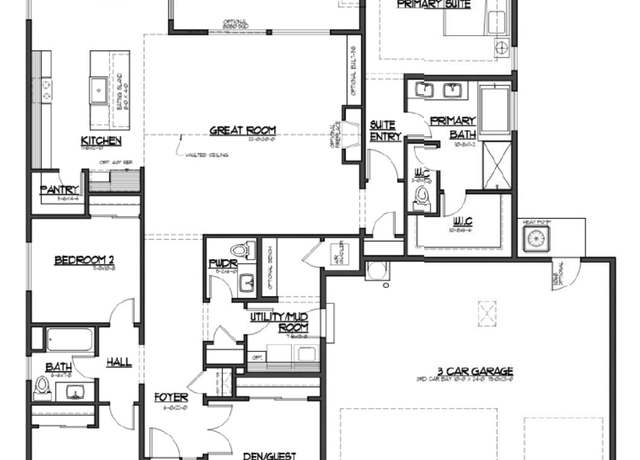
Royal Valley Farms presents our popular 2286sf rambler by JK Monarch Fine Homes. Sitting on . 89/acre corner lot, homesite 13 offers 1-level living with 4bd (3bd + den), 2.5ba. Included features: engineered hardwood/tile flooring, wrapped windows, quartz counters, 8' doors, 5" base millwork, etc. .. Great room w/ tile surround fireplace flows to chefs kitchen featuring KitchenAid appliances, spacious island & soft-close cabinets. Dining room opens to the large covered patio w/ natural pine ceiling. Primary bedroom features ensuite w/ 2 sinks, soaking tub & walk-in tile/glass shower. Spacious 3 car garage, front yard landscaping & heatpump (A/C) too. Gorgeous community
1/33
$1,044,950
4 beds2.5 baths2,286 sq ft0.89 acre (lot)
10116 Royal Valley Rd NE, Poulsbo, WA 98370
Listing provided by NWMLS as Distributed by MLS Grid
Climb the Forest Rock Hill to a little slice of paradise on the corner of Caldart & Nutkana. Spacious corner lot with a charming bungalow. Main floor living with fresh interior & exterior paint, newer laminate floors and SS appliances in a great easy flow floor plan. Upstairs 3 bedrooms, including a primary en-suite. Each room has it's own mini-split for heat & AC! Move in for fun summer days and evenings in the large back yard, with firepit, garden box & swing set. Inside, cool off with AC in each space. Oversize 2 car garage. Just minutes to the amenities of Poulsbo. Close to schools, shopping, highway access & in a wonderful established neighborhood. Great s
1/27
$540,000
3 beds2.5 baths1,381 sq ft8,276 sq ft (lot)
1611 NE Nutkana Way, Poulsbo, WA 98370
Listing provided by NWMLS as Distributed by MLS Grid
Wanting to create your perfect home in Poulsbo? Look no further than Edgewater Estates! Surrounded by a tranquil community and lush landscapes, this property offers the perfect canvas for your dream renovation. From the custom built patio to the 2nd kitchen downstairs, the possibilities are endless. This home is an ideal project for those passionate about creating a personalized living experience. Don't forget to check out the community beach, clubhouse, and playground, perfect for gatherings! In recognizing the unique opportunity this "as is" property presents, we invite buyers who appreciate the blend of challenge and reward that comes with personalizing a home. Seller will repl
1/25
$444,000
3 beds2 baths1,620 sq ft9,148 sq ft (lot)
25976 NW Circle Dr S, Poulsbo, WA 98370
Listing provided by NWMLS as Distributed by MLS Grid
You'll be wowed by the clean modern lines of this beautifully updated home. The home is located just minutes to downtown Poulsbo shopping and restaurants and to Hwy 305 making an easy commute to PSNS and Bangor. Situated on a large lot in an established neighborhood, the charming backyard is fenced with multiple garden spaces, and a patio for your outdoor entertaining. Step inside and up the stairs to a spacious living room open to the dining room and kitchen. Dreamy island kitchen looking out to the backyard, features custom backsplash, corian counters and plenty of storage. Spacious owner's suite & 2 other beds on this level. Lower level features huge multi-use room with adjacent la
1/30
$499,000
3 beds2 baths1,560 sq ft7,841 sq ft (lot)
18483 NE 15th Loop, Poulsbo, WA 98370
Listing provided by NWMLS as Distributed by MLS Grid
Live a life of luxury in this desirable Poulsbo Meadows neighborhood of Poulsbo! Sitting handsomely on the end of a cul-de-sac, this home exudes elegance at every turn. Seamlessly integrate indoor living with outdoor fun with the open floorplan, complete with chef's kitchen with gas stove, & spacious, functional kitchen island with stone countertops. Flexible floorplan includes bedroom & full bathroom on the main floor. Spoil yourself in the Primary suite, with a beautiful attached 5-piece bath. Custom shutters, A/C & gas piping for your outdoor grill are just a few upgrades of this stylish home. Sit outside on your covered back porch and take in the PNW air, or walk to sch
$849,900
4 beds3 baths2,717 sq ft4,356 sq ft (lot)
2444 NE Athlon Ct, Poulsbo, WA 98370
Listing provided by NWMLS as Distributed by MLS Grid
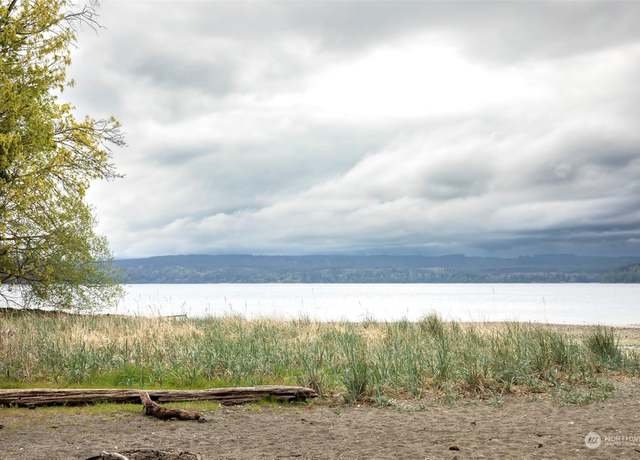
Tucked away on idyllic Lemolo Shore Drive, this waterfront treasure awaits you. A stylish combination of contemporary materials & thoughtful design, this could be your forever home or your favorite weekend destination. Turn key & low maintenance, this home was created for ease of living & boasts a floorplan that takes full advantage of the spectacular water & mountain views. High ceilings, abundant windows & a spacious covered deck & patio allow for year-round enjoyment. The home's serene palette & mod aesthetic serve to accentuate the dramatic landscape. Make time to walk the property, visit the sauna & the 540 square ft. guest quarters above
$1,498,000
2 beds2.5 baths1,496 sq ft1.06 acres (lot)
16333 Lemolo Shore Dr NE, Poulsbo, WA 98370
Listing provided by NWMLS as Distributed by MLS Grid
Comfort, convenience & an unbeatable location are all right here at this spacious & charming Craftsman home in the heart of Poulsbo. 1st floor showcases open-concept living & dining w/ hardwood floors, high ceilings & an abundance of natural light. The kitchen is equipped w/ S/S appliances, ample storage & breakfast bar seating. Main floor bonus room provides opportunities for additional living space, a home office, gym and more! Upstairs, the Primary bedroom features an ensuite bathroom & walk-in closet + 2 more bedrooms, laundry, full bath & cozy nook w/ a view. Easy access to shops, restaurants, marinas, & community events. This home overloo
$675,000
3 beds2.5 baths1,585 sq ft3,049 sq ft (lot)
19332 Front St NE, Poulsbo, WA 98370
Listing provided by NWMLS as Distributed by MLS Grid
Space for all, both inside and out, in this conveniently located, 5 bedroom, 3 full bath home! The home is situated on a 1/2 acre, fully fenced, level lot with a spacious deck ready for entertaining and a lush, parklike yard for endless outdoor enjoyment. Step beneath the welcoming canopy of a mature pink magnolia tree as you enter through glass doors into the inviting foyer. The main level unfolds into a seamless open-concept layout, encompassing the living, dining and kitchen. Retreat to the main floor, primary bedroom, complete with an ensuite bathroom and expansive windows. Upstairs boasts 4 bedrooms and 2 full baths. The 2 car garage features a separate heated & airconditioned w
$599,950
5 beds3 baths2,309 sq ft0.50 acre (lot)
3741 NE Lincoln Rd, Poulsbo, WA 98370
Listing provided by NWMLS as Distributed by MLS Grid
This exquisite 3-bedroom home is sure to impress with its sweeping Puget Sound and Mountain views! Beautifully updated throughout with wide-plank white oak floors, all new windows, Bosch appliances, tankless water heater, and tons more. Formal living and dining areas, gorgeous kitchen with Silestone quartz counters & walk-in pantry, and family room with contemporary gas fireplace. Huge upstairs primary bedroom with attached 5-pc bath, walk-in closet, and French doors to a private deck. On . 49 acres with a 3-car garage with electric car charging, cabana, and generous views of Mt. Baker, Mt. Rainier, Cascades, and partial Seattle skyline. Great location near Navy Bases, Ferries, shoppi
$967,000
3 beds2.5 baths2,426 sq ft0.49 acre (lot)
13626 Briggins Pl NE, Poulsbo, WA 98370
Listing provided by NWMLS as Distributed by MLS Grid
30YR Fixed Rates from 5.5% Available/Included! Move-In June into Our LAST NEW Rambler "Addison" single-level 2237SF 3BR/2BA/2CG SMART home w/ wooded backyard on private greenbelt Lot 5. 8' entry door, 9' ceilings, great rm w/ GAS fireplace. Gourmet island kitchen w/ 42" soft close/dovetail white maple cabs w/ pulls, tile backsplash, matte black fixtures. KitchenAid GAS cooktop w/ hood, convection wall oven & micro, pendant lights + WI pantry. HUGE Primary BR w/ ensuite bath w/ tiled shower w/ 18" tiled bench, raised vanity w/ 2 sinks, linen & HUGE WIC. Quartz counters@kitchen & baths, laundry sink/cabs, BBQ gas stub@19' covered patio! Fridge, W/ D availab
$699,990
3 beds2 baths2,237 sq ft6,002 sq ft (lot)
22108 Jameson Ave NW #05, Poulsbo, WA 98370
Listing provided by NWMLS as Distributed by MLS Grid
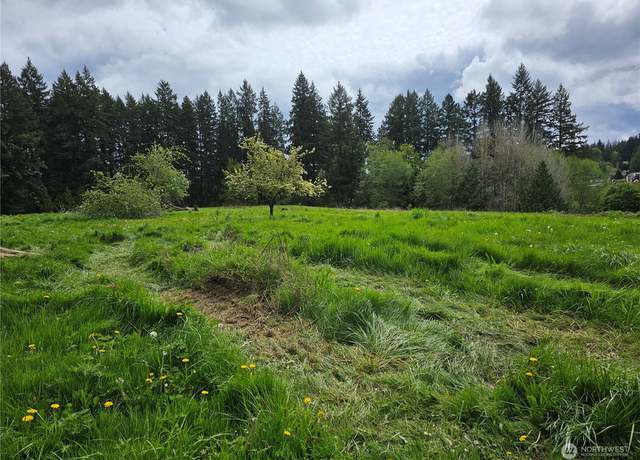
Absolutely gorgeous . 95 acre of high bank waterfront Land. This lot features newer stairs to the beach, 100' feet of waterfront where oysters, manila clams & geoducks have been planted and Stunning Views of the Olympic Mountains. The lot is level with a nice front yard overlooking the hood canal and the bridge. There is a 1941 cabin that has been cleaned out/gutted, a large detached garage, outbuilding with a concrete floor, Carport, Room for Boat & RV parking, Power is on the property, an old individual well and a 3 bedroom septic from 1980 per county records. Buyer to verify all info. There are a couple old fruit trees, cedars and it has a large back yard that is level with r
$649,000
2 beds0.5 baths953 sq ft0.95 acre (lot)
31711 State Hwy 3 NE, Poulsbo, WA 98370
Listing provided by NWMLS as Distributed by MLS Grid
Here is it, the custom built, one level home you've been searching for. Beautiful kitchen built to entertain, outfitted w/ Thermador cooking, 142 bottle wine fridge, ceiling height custom cabinetry, double islands, designed to delight any chef. The owners suite is nicely sized & features soaking tub, dual sinks, separate shower, double closets. Adjacent den offers a variety of possibilities. Guest/additional bedrooms in their own wing w/ separate full bath. Upgraded insulation, ADA doors & desirable age in place design. Big Laundry room w/ extra sink & storage cabinets. Patio enjoys the country setting on 2 plus level acres w/ shed & garden space. The enormous finish
$989,000
3 beds2.5 baths2,615 sq ft2.32 acres (lot)
138 NE Old Grange Way, Poulsbo, WA 98370
Listing provided by NWMLS as Distributed by MLS Grid
In town Poulsbo! This is the largest floorplan in Sommerset on one of the largest lots in the neighborhood. Three bedroom, two and a half bath home with a fully fenced backyard and two car garage. Freshly painted with new flooring - this home is move in ready! The open main floor is light filled and well designed with a great room, kitchen (w/ walk-in pantry) and powder room. The large primary bedroom ensuite features a full bath and walk-in closet. The two secondary bedrooms are across the staircase with the laundry room and another full bath. The ductless heat pump provides energy efficient heat in the winter and cooling in the summer. Close to the Poulsbo transit center, highways, Fish P
$499,000
3 beds2.5 baths1,647 sq ft4,356 sq ft (lot)
420 NE Ohenry Ct N, Poulsbo, WA 98370
Listing provided by NWMLS as Distributed by MLS Grid
Discover the perfect blend of comfort and community in this fully remodeled manufactured home within Cedar Glen; a serene 55+ park. This updated home boasts an open layout, and features a roomy kitchen with stainless steel appliances, quartz countertops, and custom cabinets. The primary suite offers a walk-in closet and attached primary bath with oversized shower. Enjoy outdoor living in the private back yard. Two like new sheds provide ample storage. The community boasts paved roads for leisurely walks, access to a clubhouse, events, and laundry room. Just minutes to downtown Poulsbo, shopping and Clearwater Casino Resort. This home is ideal for those seeking a move-in ready, low-maintenan
$189,000
2 beds2 baths1,400 sq ft
16300 NE State Highway 305 #52, Poulsbo, WA 98370
Listing provided by NWMLS as Distributed by MLS Grid
Introducing an amazing opportunity with this 2 bedroom, 1.75 bathroom condo in Downtown Poulsbo, nestled within the desirable community of Vikings Crest. The open living space seamlessly integrates the living room and well appointed kitchen, all of which are bathed in natural light. Two spacious bedrooms, including a Primary suite with attached bath and ample closet space. Enjoy the sunsets on your deck with mesmerizing partial mountain views. This charming association offers an array of amenities, including a clubhouse with gym, lounge area and an outdoor pool for the hot summer days ahead. Conveniently positioned car charging stations are available to make this a truly easy living communi
$279,777
2 beds2 baths998 sq ft
20161 Vikings Crest Loop NE Unit 5-304, Poulsbo, WA 98370
Listing provided by NWMLS as Distributed by MLS Grid
One of a kind private waterfront retreat! Sited on over 5 lush private acres and nestled on 246 feet of low-bank waterfront - The Miller Bay Estate redefines coastal living. This one-of-a-kind property features immaculate grounds with a main residence, guesthouse, bunk house, custom tree house, ice cream parlor, heli pad, oversized garage for RV or boat storage, private dock and sweeping views of the Puget Sound, Mt. Rainier and the Seattle Skyline. Designed for gathering: spend your days boating, swimming, kayaking, crabbing, fishing and evenings around the bonfire with all of your people. A MUST SEE. .. This is truly PNW living at it's best. Your private paradise awaits!
$5,798,000
8 beds5.5 baths10,410 sq ft5.14 acres (lot)
21330 Miller Bay Rd NE, Poulsbo, WA 98370
Listing provided by NWMLS as Distributed by MLS Grid
Incredible views from this gorgeous waterfront home located just a mile from the Brownsville Marina! Looking out over the Bay towards Bainbridge Island, you will be mesmerized by your daily vistas. Catch the occasional whale as they frolic on their migration through Puget Sound. Currently operated as a successful vacation rental, this home features the primary with ensuite bathroom and guest room/office and bath on the main level. Downstairs are 2 additional bedrooms, a fantastic great room for games, tv watching and easy access to the outdoors. High ceilings throughout and loads of light, a large 3 car garage with large parking pad, and easy access to Silverdale, downtown Poulsbo and Breme
$1,148,000
3 beds3 baths2,853 sq ft0.73 acre (lot)
2677 NE Fern Glen Rd, Poulsbo, WA 98370
Listing provided by NWMLS as Distributed by MLS Grid
Welcome to your dream beach house! This gem offers expansive views of the Olympic Mountains & Hood Canal in a private & serene setting. Wake up to breathtaking vistas & relax in the evening watching sunsets & listening to the sounds of the water. This spacious home's level, sunny property is a master gardener's dream. Built to take advantage of this special spot, most rooms are oriented towards the spectacular scenery. Abundant year-round light & multiple spaces created for entertaining. Two of the bedrooms on the main level & the large primary suite upstairs all feature decks. Fully finished walkout basement. Private stairs to the bulkheaded beach make w
$1,698,000
4 beds2 baths3,468 sq ft0.42 acre (lot)
28483 Shorebrook Dr NW, Poulsbo, WA 98370
Listing provided by NWMLS as Distributed by MLS Grid
High above Salsbury Point Park, one mile from historic Port Gamble, a long & meandering driveway "lushly lined with colorful trees & shrubs" beckons you to the serene setting of this home. With picturesque views of Puget Sound, snow-capped mountains, and spectacular sunsets, this private paradise offers you a peaceful hideaway. Known as the ‘Gateway to the Olympic National Park and the Kitsap Peninsula’, this location truly offers you the best of the Pacific Northwest! Inside this spacious home on the main level, an elegant entry leads you into a great room floor plan that takes full advantage of the views of Sound, sky, and gardens. Offering vaulted ceilin
$899,999
3 beds2.5 baths3,748 sq ft2.30 acres (lot)
31860 Salsbury Hill Pl NE, Poulsbo, WA 98370
Listing provided by NWMLS as Distributed by MLS Grid
30YR Fixed Rate from 5.5% Included/Available! NEW "Aurora" Rambler 1726SF 3BR/2BA/2CG SMART single-level w/ private grass yards - backs to the woods@Lot 7. 8' entry dr, 9' ceilings, great rm split plan w/ GAS fireplace. Gourmet island kitchen w/ 42" soft close/dovetail white maple cabs w/ pulls. KitchenAid appliances: 5-burner GAS cooktop w/ hood, built-in convection wall oven/micro combo, d/w. WI pantry, pendant lights, tile backsplash + quartz ctops@kitchen & baths! Matte black fixtures t/o. Primary BR w/ ensuite bath w/ tub on tile deck & sep tiled shower w/ heavy frameless glass. Side Service/man door@garage. BBQ gas stub@covered patio. W/ D/F avail. Partial f
$649,990
3 beds2 baths1,726 sq ft6,001 sq ft (lot)
22112 Jameson Ave NW #07, Poulsbo, WA 98370
Listing provided by NWMLS as Distributed by MLS Grid
Final opportunity to buy one of our most popular plans at Blue Heron! The S320 is an open concept living with versatile spaces to fit your lifestyle. Spacious living/dining and large gourmet kitchen! You'll have a guest suite and 3/4 bath on main level. Large, 3 Car Bay Garage! The second floor features a primary suite with dual walk-in closets and ensuite. THREE additional bedrooms and a spacious loft adds a second living area! Also includes HomeSmart features, large upstairs laundry for convenience. Still time to personalize your home at our Design Studio! Located near schools/shopping/dining! Site Reg. Policy-Buyer Broker must accompany and personally register buyer at first visit. Photo
$841,900
5 beds3.5 baths3,270 sq ft7,554 sq ft (lot)
18208 Marsh Ave NE #78, Poulsbo, WA 98370
Listing provided by NWMLS as Distributed by MLS Grid
Final opportunity to buy one of our most popular plans at Blue Heron! The S320 is an open concept living with versatile spaces to fit your lifestyle. Spacious living/dining and large gourmet kitchen! You'll have a guest suite and 3/4 bath on main level. Large, 3 Car Bay Garage! The second floor features a primary suite with dual walk-in closets and ensuite. THREE additional bedrooms and a spacious loft adds a second living area! Also includes HomeSmart features, large upstairs laundry for convenience. Still time to personalize your home at our Design Studio! Located near schools/shopping/dining! Site Reg. Policy-Buyer Broker must accompany and personally register buyer at first visit. Photo
$842,900
5 beds3.5 baths3,270 sq ft7,846 sq ft (lot)
2436 NE Waterlily Way #15, Poulsbo, WA 98370
Listing provided by NWMLS as Distributed by MLS Grid
This once in a lifetime property has been a treasured family compound for 40 years. Main Home plus two cabins located on the Hood Canal, the private property has 300 feet of waterfront. The custom built, three story, five bedroom house features wrap-around porches with vista views. The primary suite has a sauna, jacuzzi, and walk-in shower. The top floor is 1800 feet of play space with a 500-foot attic. Two working fireplaces. Wood floors throughout. The garage has a separate studio space. Main house and garage have new roofs. House is handicap accessible. Property includes one-bedroom cottage and guest cabin, with new septic systems. Three pathways lead to the beach. Present owner windsurf
$2,500,000
5 beds5.5 baths5,400 sq ft7.60 acres (lot)
2020 NW Lutes Rd, Poulsbo, WA 98370
Listing provided by NWMLS as Distributed by MLS Grid
Charming one-story rambler nestled a couple miles from the heart of historic downtown Poulsbo. 1290 sq. ft. , this one-owner home offers a blend of comfort and convenience with four bedrooms and two bathrooms and open concept living room/dining & kitchen. The layout is thoughtfully designed to maximize space and create a warm, inviting atmosphere. Step outside to discover a fully fenced, level backyard that promises privacy and space for pets, outdoor activities or some gardening. Located just moments from downtown's vibrant shops, eateries, and waterfront parks, this home combines the tranquility of suburban living with the perks of the Poulsbo lifestyle. Don't miss the opportunity t
$480,000
4 beds2 baths1,290 sq ft7,405 sq ft (lot)
383 NE Max William Loop, Poulsbo, WA 98370
Listing provided by NWMLS as Distributed by MLS Grid
Viking Park premier community over 55+ community, has a new listing on the market. Highly sought after location at the NW corner of this park. And even better is a detached 2 car garage with workshop. Well maintained 2 bedroom 2 bath 1989 Goldenwest is on a cul de sac that is so secluded, delightful backyard larger than most. Heatpump forced air heating with a Pellet Stove in the main area. Vaulted ceilings and large living room. Spacious kitchen with abundance of cabinets and storage. Breakfast nook in the kitchen overlooks the backyard. Two steps down from formal dining room is a large covered patio, steps away from the backyard and access to the workshop in the detached garage. Shopping
$190,000
2 beds2 baths1,264 sq ft
1754 NE Mesford Rd #21, Poulsbo, WA 98370
Listing provided by NWMLS as Distributed by MLS Grid
Located in the desirable Poulsbo Place neighborhood. Easy access to all the downtown has to offer--waterfront parks, art galleries, and an eclectic mix of shops and cafes. The main floor features beautiful pear wood floors, open floor plan, and updated kitchen. Enjoy outdoor space on the front deck, as well as the sunny patio off the kitchen with colorful garden. Many recent improvements including a 2nd energy efficient heat pump for heat and air conditioning, bright new quartz countertops in the kitchen and baths, as well as luxurious wool carpet in the upper-level bedrooms. Flexible floor plan with a large primary suite and attached bath, second upper-level bedroom, and lower-level bedroo
$650,000
3 beds2.5 baths1,648 sq ft1,742 sq ft (lot)
19502 Scoter Ln NE, Poulsbo, WA 98370
Listing provided by NWMLS as Distributed by MLS Grid
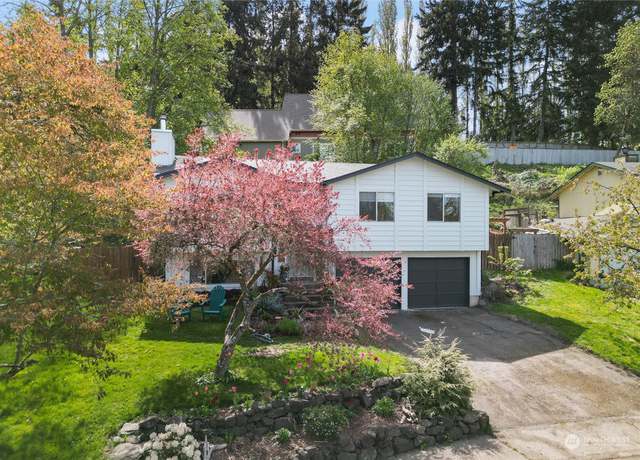
A private oasis surrounded by woods, minutes to town and ferries. The sunny lot makes enjoying the acreage a treat. Spacious decks & patios, fountain & firepit, even a chicken coop! It's a prime spot for NW living. Easy flow interior offers many options. Main floor living w/ beautiful hardwood floors that flow through the great room, dining area, primary suite & 2nd bedroom/office. Nicely updated kitchen and beautiful full bath. Vaulted ceilings, cozy gas insert & slider to wrap around deck perfect the main level. The oversize, walk-out family room downstairs, spacious 1/2 BA, bonus room w/ French doors & a bedroom with walk in closet, offer lots of options. Do
$825,000
3 beds2.5 baths2,326 sq ft2.07 acres (lot)
4545 NE Totten Rd, Poulsbo, WA 98370
Listing provided by NWMLS as Distributed by MLS Grid
Personalize your home! This S280 is an open concept living with versatile spaces to fit your lifestyle! Spacious great room that opens into dining and kitchen perfect for hosting your latest dinner party! GRAND entry open to second level! Large, covered patio off the kitchen to enjoy the outdoors rain or shine. Home office on the main level for your convenience. Upstairs you'll find your primary suite with large walk-in closet and ensuite. THREE secondary bedrooms and an open loft space adds a second living area! Also includes HomeSmart feature and spacious laundry room. Site Registration Policy-Buyer Broker must accompany and personally register buyer at first visit. Photos are of complete
$774,900
4 beds2.5 baths2,844 sq ft7,674 sq ft (lot)
18528 Sawgrass Dr NE #58, Poulsbo, WA 98370
Listing provided by NWMLS as Distributed by MLS Grid
Here is your chance to buy the MODEL HOME at Blue Heron. This home has it all with the best of our Design Features showcased in our S-280 Plan! Great room concept living with space for everyone! Convenient home office on the main level. Covered patio off the kitchen/dining to bring outdoor living to life. The second floor features a large primary suite with a large walk-in closet and an amazing ensuite! Three additional secondary bedrooms upstairs and a spacious loft adds a second living area! Also includes HomeSmart features, upstairs laundry with sink for convenience. Located in beautiful Poulsbo near to schools, parks, shopping and dining! Site Registration Policy-Buyer Broker must accom
$919,900
4 beds2.5 baths2,844 sq ft6,500 sq ft (lot)
2432 NE Waterlily Way #14, Poulsbo, WA 98370
Listing provided by NWMLS as Distributed by MLS Grid
30YR Fixed Rates from 5.5% available/included! May Move-In! NEW Under Construction "Warren" 2448SF 4BR+Office+Bonus/3BA/2CG SMART home on a private, Sunny E/W facing w/ no direct rear neighbor@Lot 79 in Glennwood. 1st floor: 8' entry door, 9' ceilings, GAS fireplace, Office w/ doors, mud rm & 3/4 Bath w/ walk-in shower. Gourmet island kitchen w/ 42"soft close WHITE maple cabs, 5 Burner GAS cooktop w/ hood, convection wall oven & micro, pantry, pendant lights, tile backsplash+quartz counters@kitchen & baths! Upstairs: 3BR's, BA, bonus rm/loft, laundry. Primary BR w/ ensuite bath w/ 2 sinks, 6ft tub on tile deck, tile shower & Huge WIC. BBQ gas stub@cove
$729,990
4 beds3 baths2,448 sq ft5,497 sq ft (lot)
22109 Jameson Ave NW #79, Poulsbo, WA 98370
Listing provided by NWMLS as Distributed by MLS Grid
Turnkey! This one level home has been completely updated for modern comfort and style. A new roof, new windows, and thoughtful updates throughout. You’ll be greeted by the spacious living area, w/ new flooring that extends throughout the home. A beautiful kitchen, equipped with new cabinets/countertops provides ample storage and workspace for all your culinary adventures. Enjoy private backyard that backs up to a lush greenbelt. This property has an array of amenities for outdoor enthusiasts. Beach cabana & playground w/ views of the Olympics. Lounge in the sun, build sandcastles, or enjoy a game of volleyball, it has something for everyone. Add’l rec area w/ basketball an
$475,000
3 beds1 bath1,196 sq ft9,148 sq ft (lot)
25963 NW Circle Dr S, Poulsbo, WA 98370
Listing provided by NWMLS as Distributed by MLS Grid
Discover convenience at its best! Just 1.02 miles from a bustling Super Shopping Center, Home Depot, and an array of dining options in a lively strip mall setting. This property has upgraded electric panels as they planned for a large building onsite. There is enough power for a 28K sq ft building. Only minutes from charming downtown Poulsbo, this property offers commercial mix-use potential. Unleash your creativity in this spacious haven with abundant amenities right at your doorstep. Silverdale and access to Kingston or Bainbridge Island is just a highway away. So bring your endless creativity into this spacious property of possibilities! Conditional use permits are available with Kitsap
$822,800
3 beds1 bath3,198 sq ft3.84 acres (lot)
2356 NW Rude Rd, Poulsbo, WA 98370
Listing provided by NWMLS as Distributed by MLS Grid
Based on information submitted to the MLS GRID as of Sat Apr 27 2024. All data is obtained from various sources and may not have been verified by broker or MLS GRID. Supplied Open House Information is subject to change without notice. All information should be independently reviewed and verified for accuracy. Properties may or may not be listed by the office/agent presenting the information. Some IDX listings have been excluded from this website.
School data is provided by GreatSchools, a nonprofit organization. Redfin recommends buyers and renters use GreatSchools information and ratings as a first step, and conduct their own investigation to determine their desired schools or school districts, including by contacting and visiting the schools themselves.Redfin does not endorse or guarantee this information. School service boundaries are intended to be used as a reference only; they may change and are not guaranteed to be accurate. To verify school enrollment eligibility, contact the school district directly.
Poulsbo, Washington, offers a variety of transportation options for its residents, including a well-maintained network of roads for car travel. Traffic levels in Poulsbo are generally moderate, making driving a convenient option for many. The city also provides public transportation services, ensuring accessibility for all residents. Additionally, Poulsbo is conveniently located near major highways, providing easy access to surrounding areas. Learn more on our Poulsbo city guide.
What types of properties are available in Poulsbo?
Poulsbo, Washington offers a variety of single-family home types, including ranch-style homes, craftsman-style homes, and contemporary-style homes. These homes can be found throughout the city, with many located in established neighborhoods and newer developments. Most properties in Poulsbo feature 3-4 bedrooms and were built within the last 20 years. To explore different property types for sale in Poulsbo, Washington, use the 'Home type' filter located above the active listings. Customize your search by selecting options like single-family homes, condos, townhomes, and more.
What is life like in Poulsbo?
Poulsbo, Washington offers a peaceful and serene living experience with its picturesque landscape. The region is blessed with breathtaking natural beauty, including stunning mountains, lush forests, and sparkling water bodies. The weather in Poulsbo is characterized by mild summers and cool winters, providing a pleasant climate throughout the year. The area provides a range of job opportunities across various industries, ensuring a diverse and thriving economy. Residents can engage in a variety of recreational activities, such as exploring hiking trails, enjoying water sports, or immersing themselves in the local arts and culture scene.
What are the schools and amenities like in Poulsbo?
Poulsbo, Washington offers a variety of public amenities to its residents. The town boasts numerous restaurants, offering a diverse range of cuisines to satisfy your palate. Outdoor enthusiasts will appreciate the well-maintained parks for relaxation and leisure. For your daily needs, there are several grocery stores available within the town. Additionally, Poulsbo provides other amenities such as libraries, fitness centers, and a post office, ensuring all your essential needs are catered to within the town.
In the past month, 30 homes have been sold in Poulsbo. In addition to houses in Poulsbo, there were also 3 condos, 1 townhouse, and 1 multi-family unit for sale in Poulsbo last month. Find your dream home in Poulsbo using the tools above. Use filters to narrow your search by price, square feet, beds, and baths to find homes that fit your criteria. Our top-rated real estate agents in Poulsbo are local experts and are ready to answer your questions about properties, neighborhoods, schools, and the newest listings for sale in Poulsbo. Our Poulsbo real estate stats and trends will give you more information about home buying and selling trends in Poulsbo. If you're looking to sell your home in the Poulsbo area, our listing agents can help you get the best price. Redfin is redefining real estate and the home buying process in Poulsbo with industry-leading technology, full-service agents, and lower fees that provide a better value for Redfin buyers and sellers.


 REDFIN IS COMMITTED TO AND ABIDES BY THE FAIR HOUSING ACT AND EQUAL OPPORTUNITY ACT. READ REDFIN'S FAIR HOUSING POLICY AND THE NEW YORK STATE FAIR HOUSING NOTICE.
 United States
 Canada