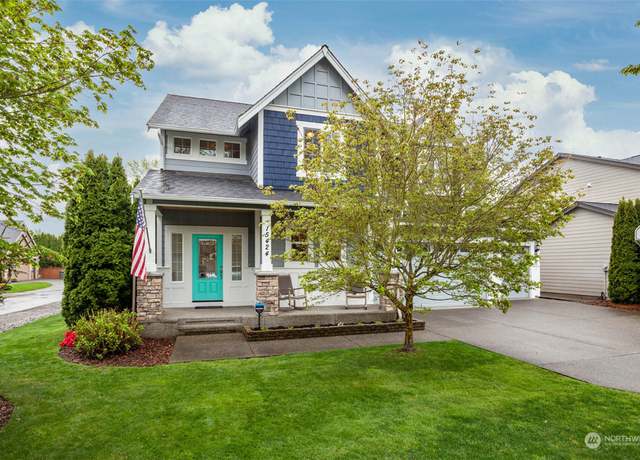
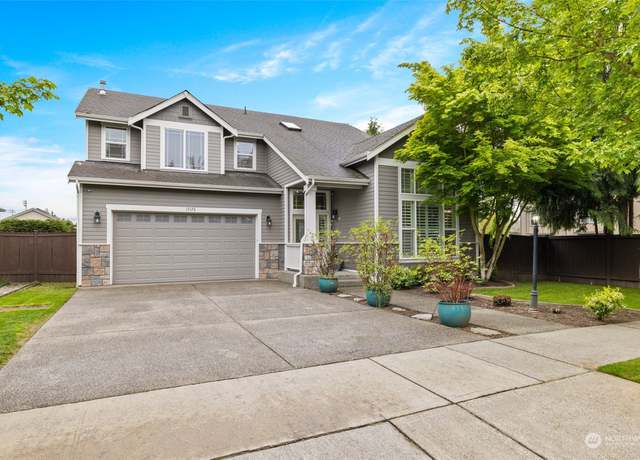
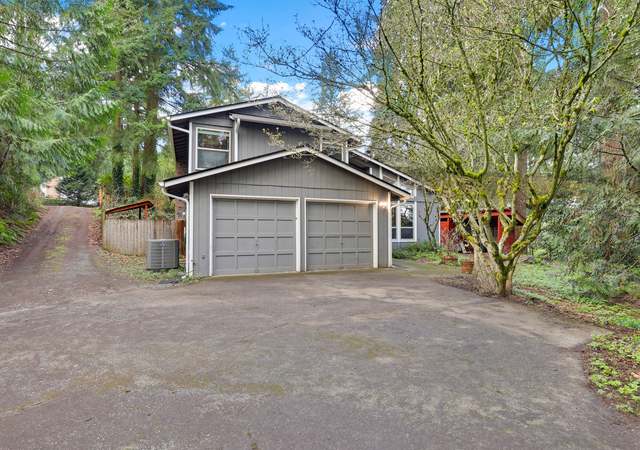
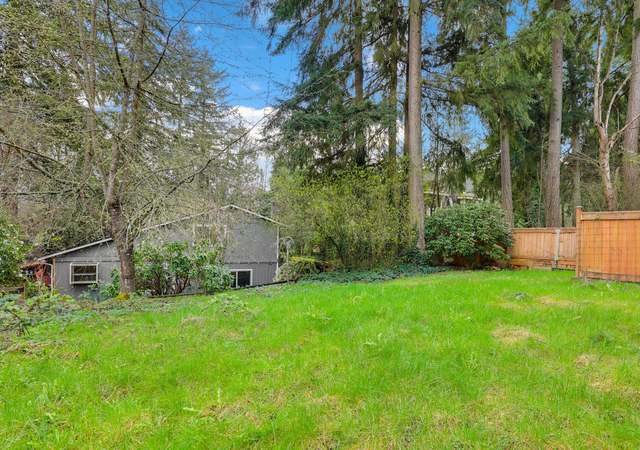
This well-maintained charmer is move-in ready! The covered porch welcomes you into the formal living room boasting hardwood floors & elegant millwork. The generous kitchen features a gas range, butler's pantry & gorgeous quartz countertops. Dining & family rooms overlook the beautiful low-maintenance landscaping. Entertain on the patio, play on the lush lawn, or relax with the garden beds. Upstairs, the bonus room is a great flex space for home office, gym, playroom, etc. Primary suite is a lovely retreat with 5-piece private bath. Laundry & 3 more bedrooms down the hall. The 4-car garage provides plenty of storage space; tandem bay opens to the back yard. With centr
1/36
$774,950
4 beds2.5 baths2,595 sq ft7,333 sq ft (lot)
15424 48th Street Ct E, Sumner, WA 98390
Listing provided by NWMLS as Distributed by MLS Grid
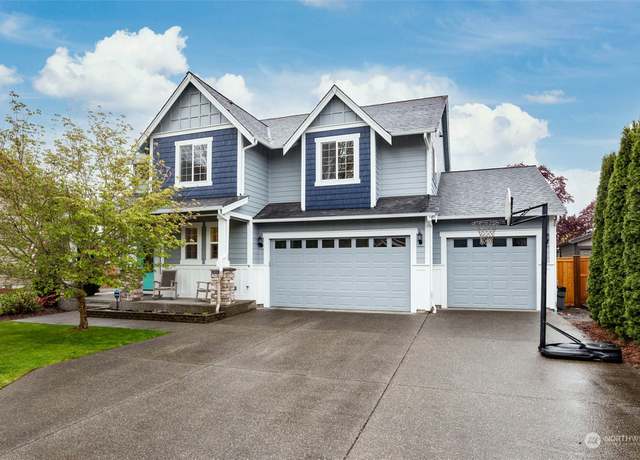
Discover the luxury and warmth of this remodeled home featuring a stunning 2-story entrance, gleaming hardwood floors, gourmet kitchen with high end appliances, welcoming family room, and separate living and dining rooms. Updates include plantation shutters, Lutron light switches, newer heat pump, and fresh interior paint. Upstairs the tranquil primary suite features a fully remodeled bath with soaking tub and spacious walk-in closet. Two roomy bedrooms with walk-in closets and ceiling fans, den/office, plus laundry room for added convenience. Picture-perfect moments await in the fully fenced backyard with plenty of space to relax and entertain. Quiet and private, this is more than a house;
1/35
$750,000
3 beds2.5 baths2,606 sq ft5,968 sq ft (lot)
15120 Daffodil Street Ct E, Sumner, WA 98390
Listing provided by NWMLS as Distributed by MLS Grid
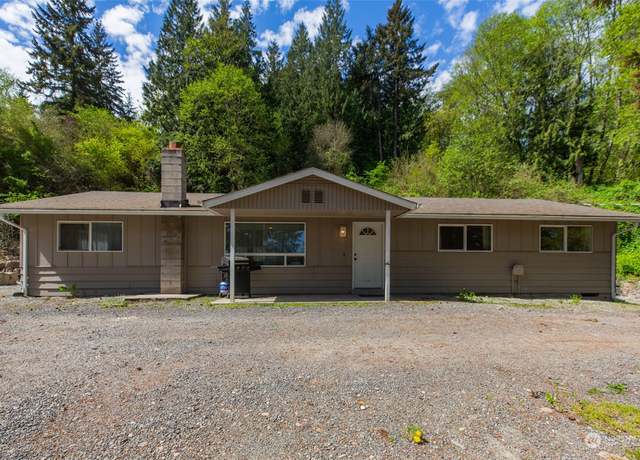
Do you run a business and/or need a move in ready property with a lot of parking? This nicely updated one-story home perched above 1.06 acres with 3 Bedrooms, 2 new bathrooms is ready for you. Open floor plan with living rm, dining rm and kitchen. Hardwood flooring, vinyl flooring, interior paint, quartz countertops, along with a detached 432 sf shop/garage. Low towards the street, terraced upward with a circular drive. Lower part of the property is level for all your vehicles. New Fence with 2 entrances along the 90ft of frontage on West Valley Hwy. City of Edgewood will allow conditional use permit for business use or keep it rural and residential. Buyer to verify all info with City. Thi
1/40
$850,000
3 beds2 baths1,500 sq ft1.06 acres (lot)
2004 W Valley Hwy E, Edgewood, WA 98372
Listing provided by NWMLS as Distributed by MLS Grid
Tranquility w/ convenience at this 1.24 acre, gated, high bank riverfront paradise! Imagine waking up each morning to the soothing sounds of the river. Modern updates seamlessly blend w/ nature’s beauty at this meticulously maintained 4 BD/2.5 BA home w/ bonus rm & office. Chef's dream kitchen w/ convection dbl oven & induction cooktop. Huge covered patio w/ add'l kitchen, heaters & shades allow you to enjoy the outdoor space year-round. Main garage wired for EV charger. 40x44 SF shop w/ 12' and 14' doors. Solar panels, fruit trees & garden beds for the eco-conscious soul. BONUS 2nd home: Fully renovated 2 BD, 2.5 BA 1236 SF DADU provides multi-generational liv
1/40
$1,700,000
4 beds2.5 baths3,187 sq ft1.24 acres (lot)
14707 80th St E, Puyallup, WA 98372
Listing provided by NWMLS as Distributed by MLS Grid
And Edgewood duplex like this doesn't come along every day! Each unit is over 2,100 square feet. Privately situated and overlooking the Sumner Valley, you'll enjoy open views that include Mt Rainier! Thoughtfully updated with vinyl plank flooring, bamboo flooring, new carpets, and new appliances, in 2021. Even the units feel private, they are separated by two garages, only the kitchens share a common wall on the main floor. Owner has maintained the yard beautifully with a professional landscaper. Excellent investment opportunity or super affordable living with owner financing/creative financing options to lock in a low interest rate. Live on one side, and rent out the other, one tenant is m
1/37
$925,000
8 beds4 baths4,224 sq ft0.57 acre (lot)
4714 E Caldwell Rd E, Edgewood, WA 98372
Listing provided by NWMLS as Distributed by MLS Grid
This Mid-Century single story beauty is just a 5-10 min walk to the train station, easy access to freeways & close to all the charm Sumner offers! On Entry, you’re greeted by a light & bright living area with a converted gas fireplace! You’ll wander into the oversized galley kitchen w/ ample seating. Brazilian Cherry cabinets, durable counters, & soft close drawers draw you in here. The 1+ car garage & storage area sits off the kitchen too. 3 good sized bedrooms, and a full guest bathroom dot the hallway. The addition includes a Primary Bedroom with 3/4 bathroom and large second living or bonus room! Step outside to a HUGE deck overlooking the mature back
1/36
$595,000
4 beds2 baths1,744 sq ft6,600 sq ft (lot)
711 Chestnut St, Sumner, WA 98390
Listing provided by NWMLS as Distributed by MLS Grid
Two houses, multiple possibilities! Live in one, rent one or rent both with good renters who would like to stay and are on month to month now. All in downtown Sumner with fabulous walking location to the commuter train, dining, parks and shopping. House #1 has 4 bedrooms and 1 bath with a large living and dining room. House #2 has been totally updated, has newer hardwood floors, new paint, kitchen and bathroom. Large 1 car detached garage with alley access also. GREAT POTENTIAL.
1/19
$699,500
6 beds2 baths2,146 sq ft6,000 sq ft (lot)
1113 Ryan Ave, Sumner, WA 98390
Listing provided by NWMLS as Distributed by MLS Grid
Charming turn of the Century home within 4 blocks of downtown Sumner, Sounder commuter train, and great schools. This 2 story open floor home was remodeled and updated in 2022. Kitchen has stainless steel appliances. 1st floor bedroom, laundry and living room, and full bath with 9 foot ceilings. 2nd floor family room, 3 bedrooms and full bath. 2 plus car garage with finished bonus room above(additional 300sqft). Home has a secure, fenced back yard with dog kennel. Driveway is large enough to hold 6 cars. Covered front porch with swing. Large front yard with 4 shade trees and grassy lawn. Easy access to Hwy 410 and 167 - 30 minutes from Seattle and Olympia. 20 minutes to Seatac Airport.
1/29
$649,000
4 beds2 baths1,628 sq ft5,000 sq ft (lot)
612 Hunt Ave, Sumner, WA 98390
Listing provided by NWMLS as Distributed by MLS Grid
This newly remodeled bright craftsman home offers turn of the century charm featuring 4 bedroom and 2.75 bathroom living space with hardwood floors, wainscoting, clawfoot bathtub, beautiful granite countertop, french doors, library/study, built-in home office area, lots of storage, and more! Walkable neighborhood close shopping, restaurants, parks and transit! New Roof!
1/36
$775,000
4 beds3 baths1,560 sq ft9,207 sq ft (lot)
1403 Rainier St, Sumner, WA 98390
Listing provided by NWMLS as Distributed by MLS Grid
Remodeled singlewide for sale at Summerville Estates (All-Ages). This 1979 Liberty is ready for new memories. 2 Bed / 1 Bath / 728 Sq. Ft. Featuring fresh paint inside and out, new flooring, new cabinets, and landscaping. This beautiful and clean home has a good sized back yard that is partially fenced, and the storage shed is also included. The home is ready with a washer and dryer, both are included in the sale. Summerville estates is conveniently located, and close to everything Sumner has to offer. Come make it yours!
1/9
$120,000
2 beds1 bath728 sq ft
15817 56th St E #23, Sumner, WA 98390
Listing provided by NWMLS as Distributed by MLS Grid
Investor Alert. 1.84 acres zoned LDR-72. 3 parcels being sold together totalling 1.84 acres. There are 2 homes on this property and outbuilding. Oak trees, Cedar trees, Blue Spruce, plum trees, hazel nuts, Bing cherry tree, blackberries & Walnut trees including a walnut tree over 100 years old. Good valley soil. Was licensed as organic farm in the past. Subdivide and build. Great location close to Hwy 410, Hwy 167, Sumner & Bonney Lake. First house (#7216) is 1506 sq ft with 4 bdrms. Second house (#7302) is 696 sq ft with 2 bdrms. Third lot is a vacant lot in front of 2nd house.
1/26
$1,500,000
4 beds2 baths1,506 sq ft1.85 acres (lot)
7216 Orting Hwy E, Sumner, WA 98390
Listing provided by NWMLS as Distributed by MLS Grid
Attn Builders/ Developers: Rare building lot literally 5 min to all the shopping & restaurants in the area yet site feels rural. Zoned for residential, these lots have a septic design that will be completed before closing. Water availability letter through 4/17/26. Lot has been surveyed and staked. Soils have been tested. Water and power at end of street. This is an opportunity for a builder to buy this lot and the one adjacent (also available) and build two custom homes.
1/1
$110,000
— beds— baths0.33 acre (lot)
0 106th Street Ct E, Bonney Lake, WA 98391
Listing provided by NWMLS as Distributed by MLS Grid
Don't miss out on one of the ONLY multi-family development sites available right in Downtown Sumner. This property is located within the town center which allows it to qualify for 8-12 year tax exemption! Majority of the preliminary work has been completed allowing a quick turn around to getting permits and breaking ground. The zoning allows for 16 units of multi-family with parking on site. This property is adjacent to the Sounder Train Station. Walking distance to Main Street in Sumner, cafes, restaurants, bars and grocery stores. It has quick access to Highway 410 & 167. With the desirability of Downtown Sumner and a huge shortage of housing, this would be a perfect property to dev
1/13
$575,000
— beds— baths0.25 acre (lot)
0 Narrow St, Sumner, WA 98390
Listing provided by NWMLS as Distributed by MLS Grid
Henderson Homes resale end unit townhome with attached 2 car garage, patio and HOA maintained yard. Lower level garage and guest bed #1 with built in bedframe; bonus huge walk in closet for extra storage. Main level kitchen w/ easy care laminate counters, oak cabinets w/ built in pantry + bar seating opens to dining + living w/ 9' ceilings, gas fireplace and sliding glass door access to patio and yard. Upper level landing w/ bonus cabinet storage; primary bedroom w/ updated 3/4 bath w/ 2 sinks & quartz ctops, one additional guest bedroom and full guest bath w/ skylight. Tons of windows for natural light, minutes to parks, trails, Lakeland Hills Center and Hwy 167 for an easy commute.
1/29
$409,950
3 beds2.5 baths1,673 sq ft1 sq ft (lot)
4726 Mill Pond Dr SE #601, Auburn, WA 98092
Listing provided by NWMLS as Distributed by MLS Grid
Stunning 3 bed + 2 bath Tri level home conveniently located on a spacious & secluded 1/3 acre lot in Lake Tapps! Greeted on entry with soaring vaulted ceilings & a bright and open concept great room with white mill work and a cozy fireplace. Updated kitchen features white cabinets with quartz counter tops, SS appliances and a spacious dining area. 3 generous bedrooms on 2nd level, including the sunny primary with attached en suite bath. Large utility room on lower level. Large lot with outbuildings & private drive. A/C, new roof & furnace! Don’t miss this opportunity!
1/32
$569,950
3 beds2 baths1,408 sq ft0.32 acre (lot)
4315 170th Ave E, Lake Tapps, WA 98391
Listing provided by NWMLS as Distributed by MLS Grid
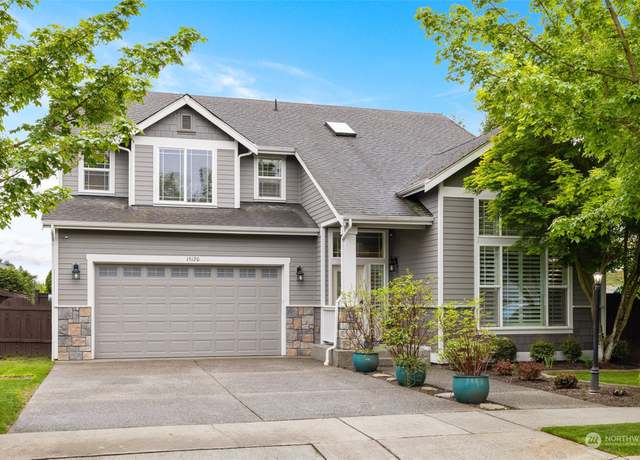
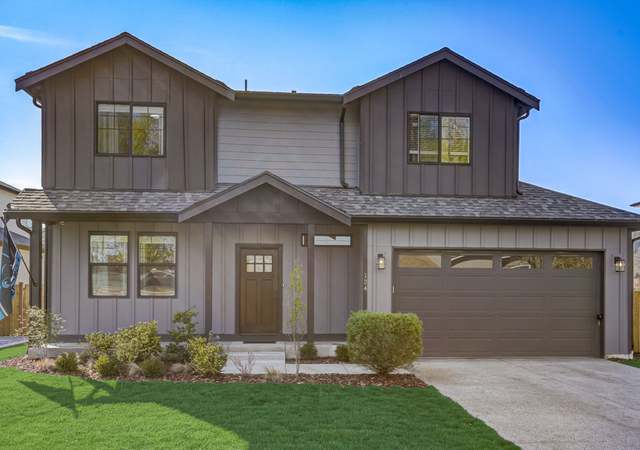
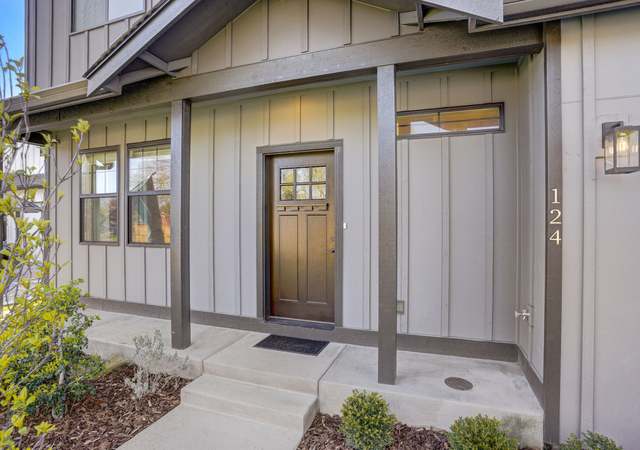
Move-in perfect & meticulously maintained, this 4-bed, 3-bath modern farmhouse offers an unparalleled living experience. Unleash your inner chef in the stunning gourmet kitchen, complete with top-of-the-line appliances. The main floor features a convenient home office with an en-suite bath, perfect for work-from-home. Upstairs, unwind in the luxurious primary suite boasting a spa-like en-suite bathroom with a walk-in shower. Three additional bedrooms and a hall bath provide ample space for guests. Enjoy outdoor entertaining on the large level lot in this peaceful Pacific location that is a commuter's dream to Hwy 167, 18, & I-5. Close to shopping/dining and with no HOA, you can
1/30
$775,000
4 beds3 baths2,090 sq ft8,860 sq ft (lot)
124 Homer Ave SW, Pacific, WA 98047
Listing provided by NWMLS as Distributed by MLS Grid
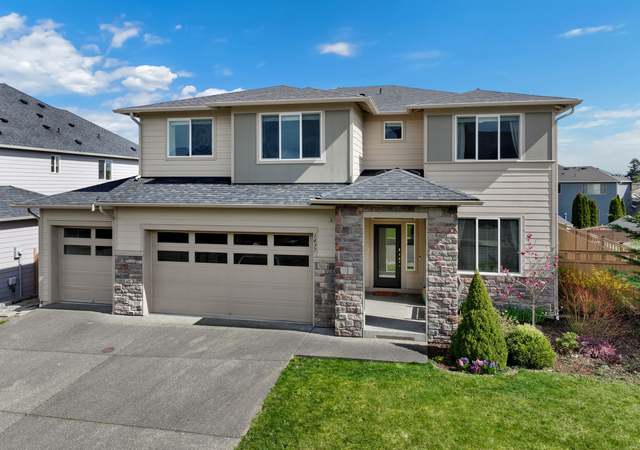
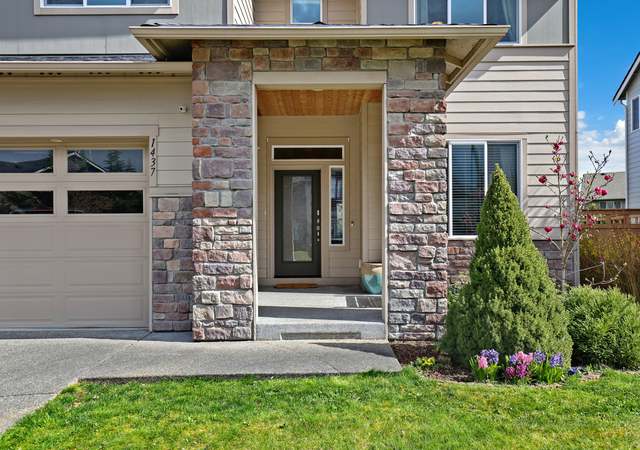
SELLER IS OFFERING 15K FOR RATE BUYDOWN! Mt View NW Contemporary off Shaw Rd in the Highlands. Spacious, yet practical floor plan. The kitchen is an absolute dream! Expansive cabinetry, quartz counters, farmhouse sink, giant dbl fridge/freezer, incredible millwork, no expense spared on this home. Hi-end laminate hardwoods on main inc. the den/office. Upstairs has luxurious primary w/ 5 pc bath PLUS a JR suite w/ full bath. Large family/rec room up as well as convenient laundry and another full bath. Mtn views from all rooms upstairs, 4 car garage, 240V EV station, wired for generator. Uniquely private fenced backyard has big Trex deck and concrete patio, complete w/ a fun play structure. Mi
1/49
$845,000
5 beds3.5 baths3,094 sq ft8,021 sq ft (lot)
1437 40th St SE, Puyallup, WA 98372
Listing provided by NWMLS as Distributed by MLS Grid
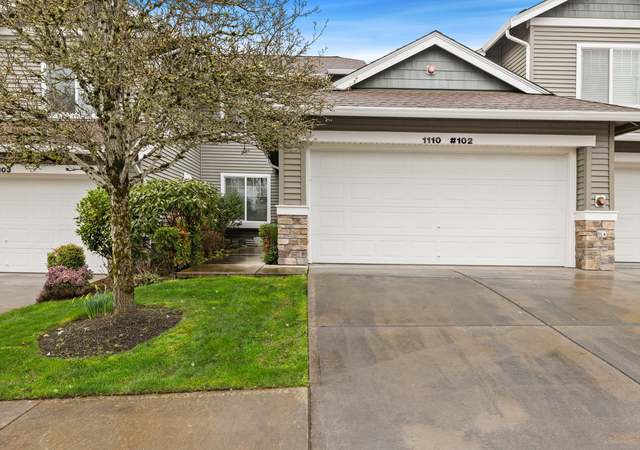
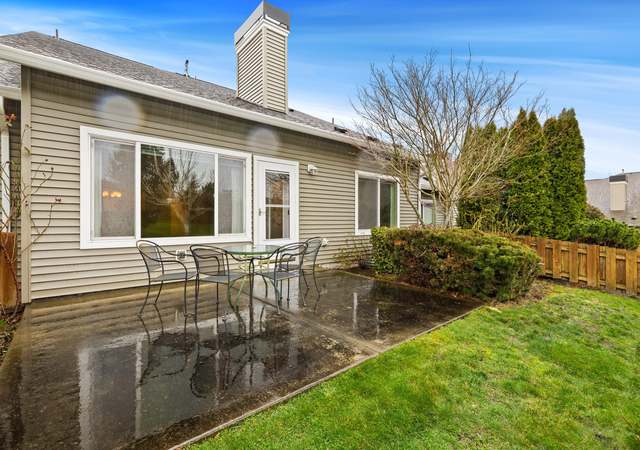
Buyers financing failed! Spacious 2 bedroom townhome in a beautifully maintained gated community that boasts a nice clubhouse with parks; close to trails, shopping and schools. This special unit backs up to the putting green and has a view of the Mountain! Superb layout with the large primary suite on main level, with generous walk-in shower. Hardwood entry, tile floors, brand new W/ W throughout. Super large eat-in kitchen has lots of cabinets and a nice eating bar that opens to the great room with gas fireplace and vaulted ceilings. Convenient laundry (W/ D stay) and 1/2 bath on main. The upper floor has a generous loft with a full bath and bedroom. Heat Pump/AC. Mini blinds throughout.
1/30
$534,000
2 beds2.5 baths1,727 sq ft
1110 63rd St SE #102, Auburn, WA 98092
Listing provided by NWMLS as Distributed by MLS Grid
Stunning Edgewood 3-bed, 4.5 bath home! Featuring beautiful mountain views, sports court, detached 3-car garage & RV parking! Offering a grand foyer, open floorplan, and fantastic kitchen with large island & stainless steel appliances. Massive windows bringing in tons of natural light. Main floor offers spacious living room with wood burning fireplace, dining room, home office, and laundry room. The primary bedroom is also located on the main floor featuring a large deck, spa-like en-suite full bath & expansive walk-in-closet. Upper level has 2 more bedrooms, 2 bathrooms, and a bonus room. Downstairs you will find a large rec room, 3/4 bath, and an additional room that cou
1/40
$1,100,000
3 beds4.5 baths5,320 sq ft0.49 acre (lot)
2717 125th Avenue Ct E, Edgewood, WA 98372
Listing provided by NWMLS as Distributed by MLS Grid
Exquisite open-concept residence situated in a tranquil neighborhood with convenient freeway connectivity. This residence features a gourmet chef's kitchen with a walk-in pantry, stainless steel gas range, and a 5-foot refrigerator. Revel in the expansive quartz island and hardwood flooring that flows throughout the main living areas, complemented by a picturesque garden visible through the windows. The primary suite presents a spa-like bathroom complete with a chic barn door, a luxurious freestanding tub, and an expansive tiled shower. A/C, many upgrades A fully fenced yard with impeccably landscaped grounds and a covered patio w/ an outdoor fireplace and lighting fixtures. The property al
1/39
$1,095,000
5 beds2.5 baths3,168 sq ft9,190 sq ft (lot)
12319 41st Street Ct E, Edgewood, WA 98372
Listing provided by NWMLS as Distributed by MLS Grid
Craftsman-style home in downtown Puyallup fully remodeled with over $100,000 in upgrades. Primary w/ full bath + additional bedroom on main level w/ 2 more bedrooms upstairs, plus smaller craft/office loft area. Many upgrades including: whole house generator, customized central vacuum, air conditioning, custom wrought iron fence, new walkway and front porch steps. There is 480 sf unfinished 'loft' above the garage that would make a perfect office, craft space, studio or maybe even a small apartment. Drip line installed on both sides of house for automatic timed watering. Wheelchair accessible. Complete new sewer line and low maintenance landscaping. Easy access to downtown restaurants, shop
1/40
$630,000
4 beds2 baths2,480 sq ft5,600 sq ft (lot)
625 17th St SE, Puyallup, WA 98372
Listing provided by NWMLS as Distributed by MLS Grid
Unlock the door to this exceptional opportunity and your new home in the North Tapps Estates neighborhood and the Dieringer School District! This lovely 3 bedroom, 2.5 bath, with loft features tall ceilings, wood floors, quartz countertops, central A/C, and an open concept layout. The spacious kitchen has countertop space galore with seating open to the great room with fireplace. Upstairs you'll find the primary suite with walk-in closet and 5-piece bath, 2 spacious bedrooms and extra flex space in the loft. There's plenty of space in the fully fence backyard but also conveniently located across from the community basketball court and playground. Location is close to Lakeland Hills town cen
1/37
$645,000
3 beds2.5 baths1,774 sq ft5,914 sq ft (lot)
6709 Douglas Ct SE, Auburn, WA 98092
Listing provided by NWMLS as Distributed by MLS Grid
Unparalleled modern luxury in this exceptional MainVue resale. Immerse yourself in the seamless fusion of sophistication and contemporary design, where every detail exudes beauty and functionality. Retreat to the lavish primary bedroom with its spa-like ensuite, or entertain effortlessly in the covered outdoor oasis with a cozy gas fireplace. Boasting 4 bedrooms, 4.5 bathrooms, an office, and a versatile bonus room, this home offers ample space for both relaxation and productivity. Nestled in Lakeland Hills near Lake Tapps, with top-rated schools and convenient access to Hwy 167 and the Sounder Train, this residence defines modern living at its finest. Elevate your lifestyle in this exquisi
1/28
$949,950
4 beds4.5 baths3,870 sq ft6,448 sq ft (lot)
5622 Franklin Ave SE, Auburn, WA 98092
Listing provided by NWMLS as Distributed by MLS Grid
Stunning Lake Tapps home in the Estates within the coveted Dieringer school district. Enjoy this ideal open-concept floor plan that is light & bright & freshly painted throughout. The kitchen boasts ample storage, granite countertops, rich cherry wood cabinets w/ pantry. This rare gem features a main-floor bedroom, a spacious family room & living room w/ a gas fireplace & A/C. Upstairs is a generous primary bedroom with a 5-piece bath w/ walk-in closet. The versatile bonus room has a Murphy bed w/ shelves, which offers flexibility as a guest room or media space. The fully fenced backyard, complemented by a large patio, for your enjoyment. Located near Estates Neighbo
1/23
$699,995
4 beds3 baths2,629 sq ft7,041 sq ft (lot)
2331 165th Avenue Ct E, Lake Tapps, WA 98391
Listing provided by NWMLS as Distributed by MLS Grid
Welcome to Lakeland living! This 3-bedroom, 2.5-bathroom gem is ready to welcome you home. The backyard features a pool, gazebo, and landscaping that creates an oasis perfect for relaxing and get togethers. Inside, the living and dining areas with their high ceilings feel spacious and comfortable. The large main floor office is a perfect work from home space. Whip up meals in the roomy updated kitchen, and take advantage of nearby parks and schools. Come see why this place is perfect for you – schedule a viewing today!"
1/32
$674,999
3 beds2.5 baths1,960 sq ft7,119 sq ft (lot)
1322 49th St SE, Auburn, WA 98092
Listing provided by NWMLS as Distributed by MLS Grid
Beautiful corner lot home in Lakeland Hills. Designed to maximize space and light, this open concept plan offers soaring entryway, inviting rooms, gleaming floors, fashionable fixtures and lighting, gas frplc, and is complemented by tasteful finishes throughout. Well-equipped island kitchen features plentiful cbntry, pantry, casual eating, opens to living area. Bedroom on main w 3/4 bath. Gracious primary suite with vaulted ceilings, indulgent bath; sizable bdrms, stylish baths, den. Central AC, kitchen applcs stay. Expansive patio, fire pit, fenced yard, landscaping create fabulous outdoor spaces. Lakeland community enjoys trails, baseball field, sport court and parks. Easy access to Lakel
1/39
$785,000
4 beds3 baths2,870 sq ft7,347 sq ft (lot)
2025 65th St SE, Auburn, WA 98092
Listing provided by NWMLS as Distributed by MLS Grid
Are you looking for an opportunity to turn your vision into reality? This Edgewood home offers you a large, single family structure with panoramic views, a fantastic deck for entertaining and lots of space for parking. The interior of the home is in need of a new vision to bring it back to life to create a modern home with your touch of flair. The home does have good bones and features radiant heat. The photos are a fair representation of it's current condition and is being sold in as-is condition.
1/35
$565,000
4 beds2.5 baths2,385 sq ft0.67 acre (lot)
5422 Monta Vista Dr E, Edgewood, WA 98372
Listing provided by NWMLS as Distributed by MLS Grid
2.84 acres of development land zoned RS-08 which permits a minimum lot size of 8,000 SF per single-family unit, 10,000 SF per duplex, & a maximum density of 5 units per acre. Public water, public sewer, & electric are in 25th Street SE at property’s eastern boundary. Level topography that varies less than 2 feet throughout the property. This offering is located just west of the intersection of East Pioneer & Shaw Roads making it well-suited for residential development with shopping, entertainment, & commuter options all within close proximity. Project should yield approximately 10 single-family lots. Geotech, conceptual site plan, topographical survey & pre-
1/30
$875,000
— beds— baths2.84 acres (lot)
950 25th St SE, Puyallup, WA 98372
Listing provided by NWMLS as Distributed by MLS Grid
A home unique as you are where traditional elegance meets modern convenience. Nestled high in a neighborhood w/ distinct personality, this entertainer's dream is far from cookie-cutter! High ceilings on every level create sense of grandeur. Main floor's circular floor plan blends formal & informal areas. Chef's kitchen, stainless appliances, gas range and double oven. Home office with window seat, XL laundry w/ storage & sink. Massive primary w/ vaulted ceilings, 5 piece bath, 2 walk in closets & deck with valley views. Two spacious bedrooms 1 w/ walk-in closet share a full bath. Basement provides entertaining area w/ 2nd kitchen, two bedrooms, 1 w/ ensuite bath, walk-in c
1/40
$915,000
5 beds4.5 baths3,190 sq ft0.39 acre (lot)
5335 Highland Dr SE, Auburn, WA 98092
Listing provided by NWMLS as Distributed by MLS Grid
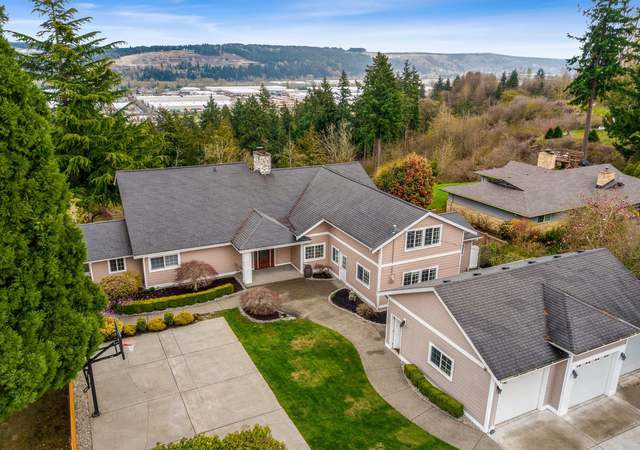
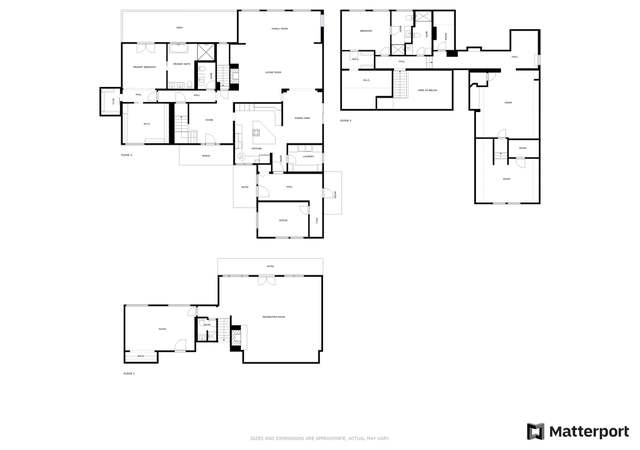
Unparalleled retreat nestled within a gorgeous 3-acre gated estate. The estate has been thoughtfully laid out with its formal tree-lined drive, timeless architectural styling, elegantly landscaped grounds, detached shop/garage with car lift & 1/2 bth, & beautiful cedar-lined barn. Crafted by a master builder, no expense has been spared in selecting the finest materials, promising enduring elegance. The main floor primary suite boasts a walk-in tile shower, indulgent jetted soaking tub, coffered ceilings, expansive wardrobe room, & private deck. High ceilings throughout the home impart a grand ambiance, balanced by the warm of rich woodwork. Beautifully appointed chefs kitche
1/26
$2,295,000
4 beds4 baths5,219 sq ft2.84 acres (lot)
12310 12th St E, Edgewood, WA 98372
Listing provided by NWMLS as Distributed by MLS Grid
Perfect home in Lakeland Hills neighborhood Edgeview! 4 bedrooms 2.5 baths Open concept living with a grand entrance and dramatic ceilings. Freshly painted and move in ready for a new owner! Gorgeous kitchen with hardwoods throughout, extra large island, SS appliances, gas range, full tile back splash, granite counter top and eating area that leads to a fully fenced back yard with covered back patio perfect to enjoy the outdoors year round. Super close to parks, trails, shopping, restaurants, entertainment and Lake Tapps. Great schools and easy commute to the freeway.
1/35
$674,990
4 beds2.5 baths1,850 sq ft5,372 sq ft (lot)
2032 57th St SE, Auburn, WA 98092
Listing provided by NWMLS as Distributed by MLS Grid
Welcome to Heatherwood at Lakeland! Desirable top-floor 2 Bedroom/2 Bath end unit featuring updates throughout to create welcoming vibes. Bright & open layout where you'll enjoy entertaining with ease & private covered balcony with territorial views to relax after long day. Completely turn-key offering newer flooring, interior paint, modern accents and lighting fixtures, cozy living area with electric F/P, updated Bathrooms + Kitchen with beautiful quartz counters, tiled ceramic backsplash and newer SS appliances that all stay! Includes individual 25x12 garage below unit. Located within quiet community, walking distance to parks and trails, shopping, restaurants, highly rated sc
1/32
$400,000
2 beds2 baths932 sq ft
1129 61st St SE Unit E-16, Auburn, WA 98092
Listing provided by NWMLS as Distributed by MLS Grid
Tucked back from the road and only has neighbors on two sides. Enjoy spacious views and bountiful natural light. A desirable layout for entertaining. Tile countertops, walk in pantry, island with motion sensor sink, gas range with downdraft vent, and beautiful cabinets. Gas fireplace and broad windows in the living room. Carpeted upstairs with tiled bathrooms, and hardwood and LVP downstairs. Master includes ensuite and spacious walk-in. Two additional bedrooms are good size. Views to the south and west offer beautiful sunsets from the hot tub spa. Lot has plenty of off street parking. Community features include walking trails, courts, parks and gathering spaces. Grocery, gym, restaurants,
1/25
$675,000
3 beds2.5 baths1,813 sq ft5,524 sq ft (lot)
2409 53rd St SE, Auburn, WA 98092
Listing provided by NWMLS as Distributed by MLS Grid
Based on information submitted to the MLS GRID as of Fri May 03 2024. All data is obtained from various sources and may not have been verified by broker or MLS GRID. Supplied Open House Information is subject to change without notice. All information should be independently reviewed and verified for accuracy. Properties may or may not be listed by the office/agent presenting the information. Some IDX listings have been excluded from this website.
School data is provided by GreatSchools, a nonprofit organization. Redfin recommends buyers and renters use GreatSchools information and ratings as a first step, and conduct their own investigation to determine their desired schools or school districts, including by contacting and visiting the schools themselves.Redfin does not endorse or guarantee this information. School service boundaries are intended to be used as a reference only; they may change and are not guaranteed to be accurate. To verify school enrollment eligibility, contact the school district directly.
Homes for sale in Sumner have a median listing price of $600K. Some of these homes are Hot Homes, meaning they're likely to sell quickly.
What are some of the most popular neighborhoods in Sumner?
Popular neighborhoods include Dieringer, Lakeland, and Sumner Town Center.
How often does Redfin update their new listings?
Most of our new listings in Sumner are updated every 5 minutes so you can see new homes as soon as they come on the market. Learn more
What is transportation like in Sumner?
Sumner, Washington is well-connected with a variety of transportation options, including public transit. The city's traffic levels for car travel are moderate, with peak hours typically seeing the most congestion. Public transportation in Sumner is available, with services like Sound Transit and Pierce Transit offering bus and train routes. Additionally, Sumner's strategic location offers easy access to major highways and freeways, including State Route 167 and Interstate 5. Learn more on our Sumner city guide.
What types of properties are available in Sumner?
Sumner, Washington offers a variety of single-family home types, including ranch-style homes, split-level homes, and contemporary homes. These homes can be found throughout Sumner, Washington, in neighborhoods such as Downtown Sumner, East Sumner, and West Sumner. Most properties feature three to five bedrooms and were built in various years. To explore different property types for sale in Sumner, Washington, use the 'Home type' filter located above the active listings. Customize your search by selecting options like single-family homes, condos, townhomes, and more.
What is life like in Sumner?
Sumner, Washington offers a pleasant living experience with its picturesque landscape that includes rolling hills, lush greenery, and stunning views of Mount Rainier. The region experiences a mild climate with warm summers and cool winters, making it enjoyable to explore the outdoors year-round. The area boasts a range of job opportunities across various industries, including manufacturing, healthcare, and professional services. Residents can engage in a variety of recreational activities such as hiking, biking, and exploring the local parks and trails. The community also organizes numerous cultural events and festivals that showcase the vibrant local arts and entertainment scene.
What are the schools and amenities like in Sumner?
Sumner, Washington offers a variety of public amenities to its residents. You'll find a selection of restaurants serving a range of cuisines to satisfy diverse culinary preferences. The city also boasts well-maintained parks, providing serene green spaces for leisure and relaxation. For your shopping needs, there are grocery stores stocked with a wide array of products. Additionally, other amenities such as schools, libraries, and fitness centers are available in Sumner, Washington.
In the past month, 9 homes have been sold in Sumner. In addition to houses in Sumner, there was also 1 condo, 1 townhouse, and 1 multi-family unit for sale in Sumner last month. Find your dream home in Sumner using the tools above. Use filters to narrow your search by price, square feet, beds, and baths to find homes that fit your criteria. Our top-rated real estate agents in Sumner are local experts and are ready to answer your questions about properties, neighborhoods, schools, and the newest listings for sale in Sumner. Our Sumner real estate stats and trends will give you more information about home buying and selling trends in Sumner. If you're looking to sell your home in the Sumner area, our listing agents can help you get the best price. Redfin is redefining real estate and the home buying process in Sumner with industry-leading technology, full-service agents, and lower fees that provide a better value for Redfin buyers and sellers.


 REDFIN IS COMMITTED TO AND ABIDES BY THE FAIR HOUSING ACT AND EQUAL OPPORTUNITY ACT. READ REDFIN'S FAIR HOUSING POLICY AND THE NEW YORK STATE FAIR HOUSING NOTICE.
 United States
 Canada