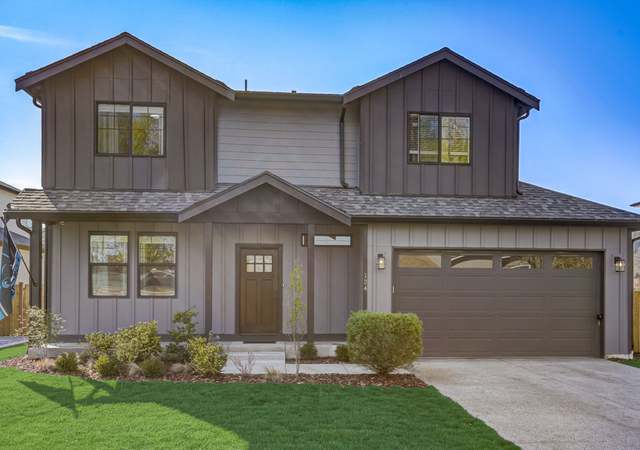
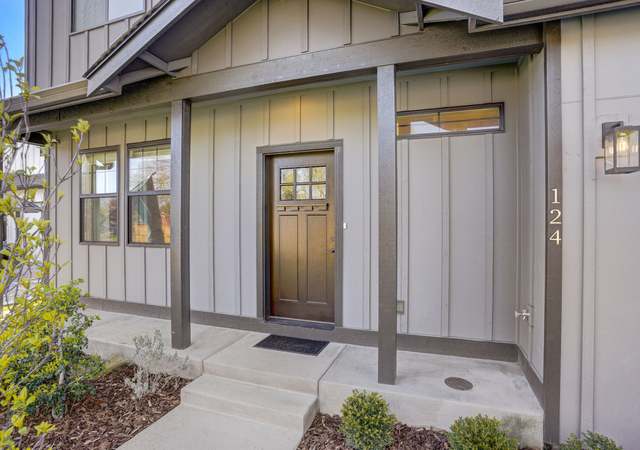
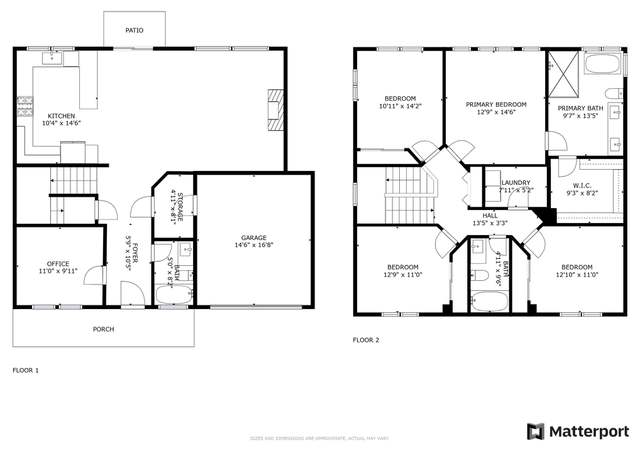
Move-in perfect & meticulously maintained, this 4-bed, 3-bath modern farmhouse offers an unparalleled living experience. Unleash your inner chef in the stunning gourmet kitchen, complete with top-of-the-line appliances. The main floor features a convenient home office with an en-suite bath, perfect for work-from-home. Upstairs, unwind in the luxurious primary suite boasting a spa-like en-suite bathroom with a walk-in shower. Three additional bedrooms and a hall bath provide ample space for guests. Enjoy outdoor entertaining on the large level lot in this peaceful Pacific location that is a commuter's dream to Hwy 167, 18, & I-5. Close to shopping/dining and with no HOA, you can
1/30
$775,000
4 beds3 baths2,090 sq ft8,860 sq ft (lot)
124 Homer Ave SW, Pacific, WA 98047
Listing provided by NWMLS as Distributed by MLS Grid
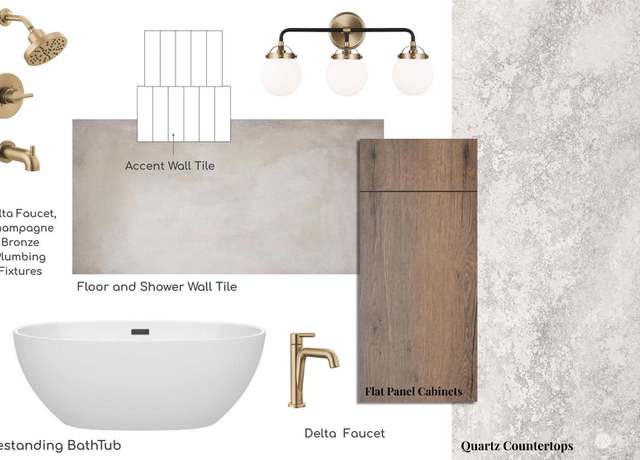
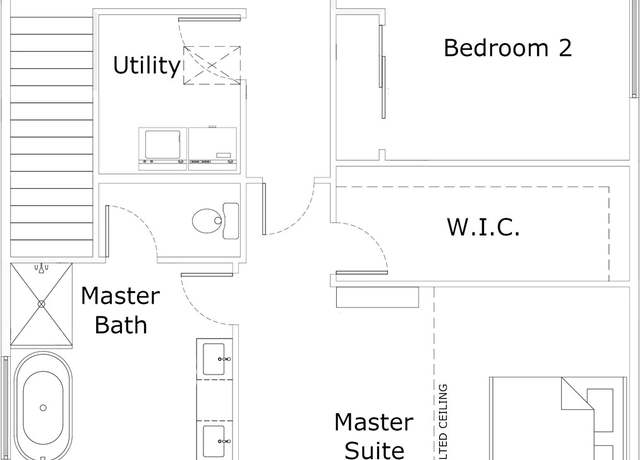
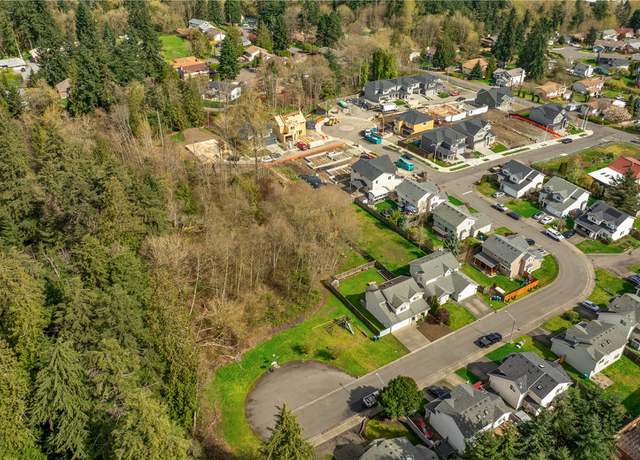
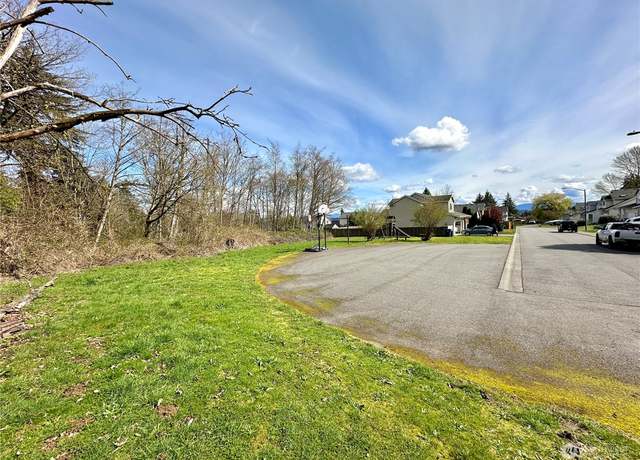
Pre-Sale (Completion June/July). Perfectly blending modern elegance with functional design. Situated on an expansive . 24-acre lot, there's ample room for the future owner to build a garage, shop or DADU. Home will feature engineered hardwood floors, custom cabinetry, quartz countertops, and premium appliances. The bedrooms are spacious with plush carpeting and ample storage space. The primary features a walk in closet, free standing tub and walk in shower. Conveniently and privately located in a desirable neighborhood near parks, schools, and amenities, this home offers both luxury and practicality. Schedule a viewing today before it's gone! Ask about preferred lender bonus/incentives!
1/4
$789,999
4 beds2.5 baths2,331 sq ft0.24 acre (lot)
202 Cedar Ct S, Pacific, WA 98047
Listing provided by NWMLS as Distributed by MLS Grid
This prime land parcel in Auburn, WA, offers a rare opportunity for development in a desirable neighborhood. Zoned R-5, the property allows for a single-family residence with a density of up to 5 dwellings per gross acre. Additionally, permitted uses include the addition of a detached dwelling unit, manufactured home, or adult family home, with limited use for an accessory dwelling unit (ADU). Located in a well-established neighborhood, this property is conveniently close to grocery stores, gas stations, schools, and other amenities. Most utilities, including gas, electric, and sewer, are already available on the street, simplifying the development process. While the neighborhood was initia
1/8
$127,500
— beds— baths8,643 sq ft (lot)
0 55th Ave S, Auburn, WA 98001
Listing provided by NWMLS as Distributed by MLS Grid
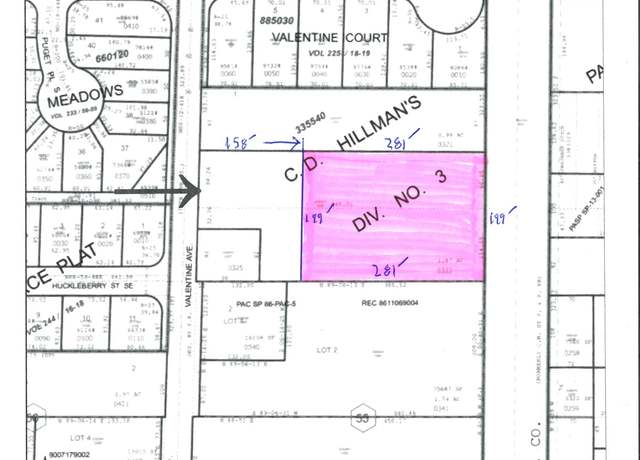
1.28 acres of level and cleared land; utilities available in street. Sold subject to short platting and revised title; survey and short plat process to be Buyer's responsibility. Buyer to have and maintain liability insurance to cover Buyer adequately during survey/short plat process. Adjacent . 99 parcel concurrently for sale with another cooperative Seller with separate Realtor; MLS# 2167661; suggested highest and best use would be for Buyer to obtain both parcels.
1/1
$500,000
— beds— baths1.28 acres (lot)
519 Valentine Ave, Pacific, WA 98047
Listing provided by NWMLS as Distributed by MLS Grid
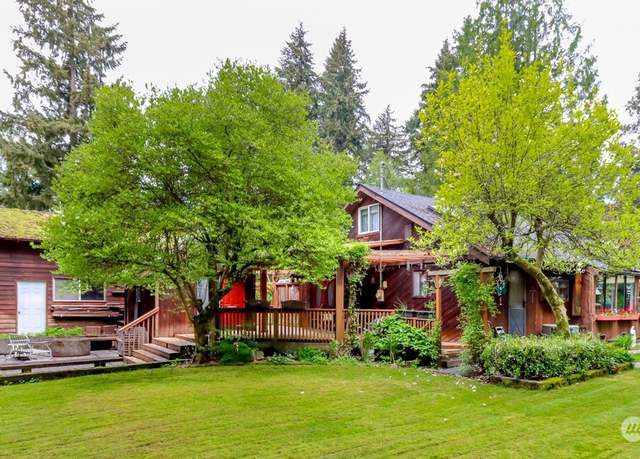
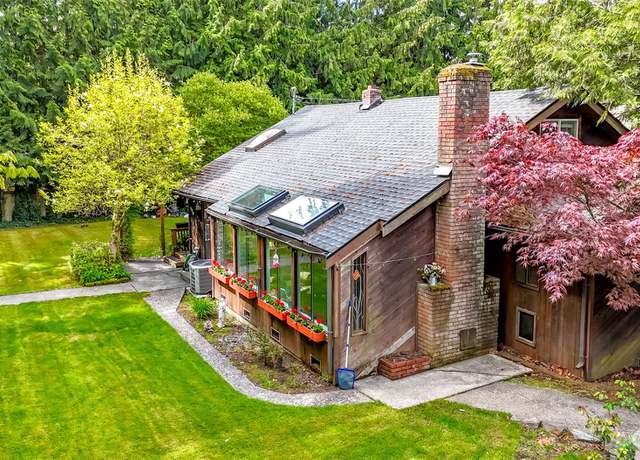
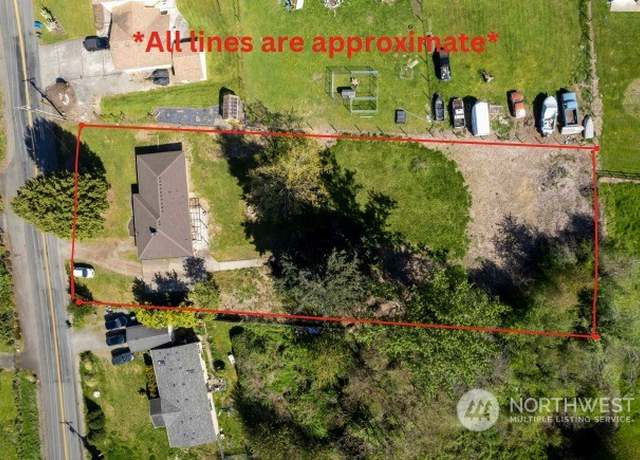
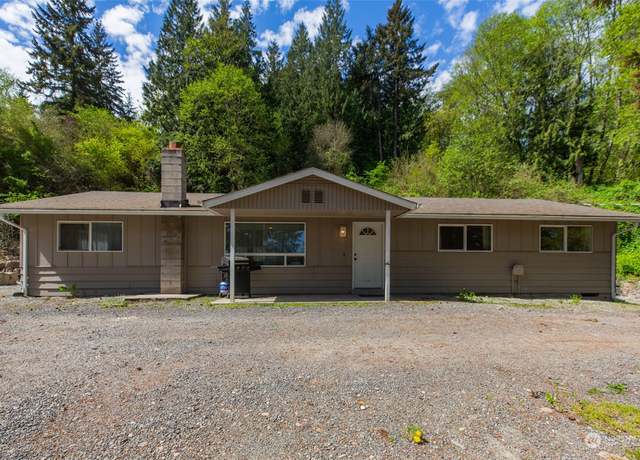
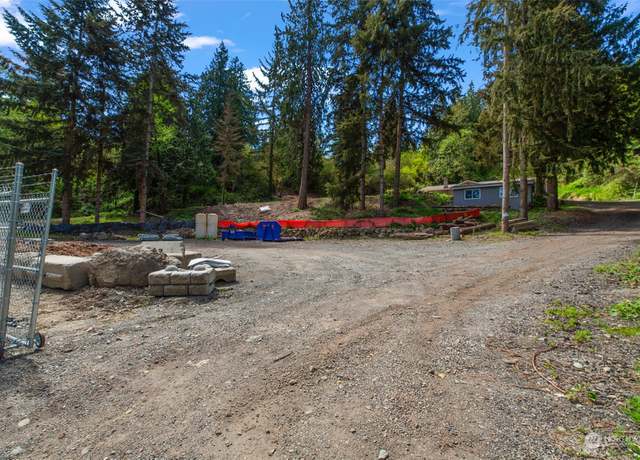
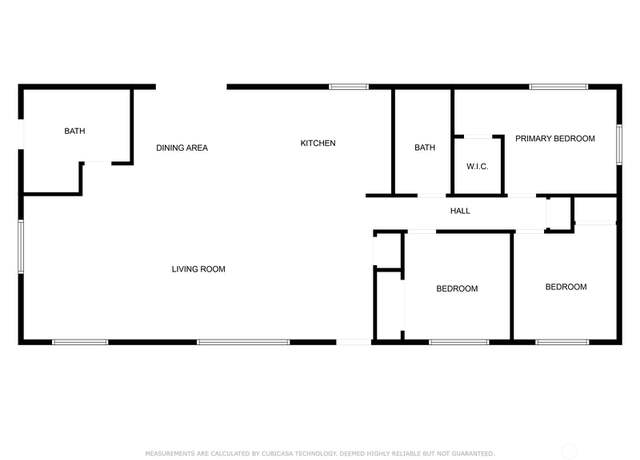
This charming spacious country home sits on almost . 50 acre offering a serene retreat. Bright and open entry which goes into living and open country kitchen that includes eating space along with your dining area. Enjoy the cooler evenings with your wood pellet stove. Main bedroom on main floor and 2 bdrms. upstairs. Outstanding 3 car garage and workshop. Fully fenced property with ample parking for RV or toys. Substantial oversized deck including a separate structure. On a private road. Garage also includes 2 extra finished rooms. You will have the instant feel for the perfect quality lifestyle! Enjoy your days with serenity or the right home for entertaining. Close to freeway access, shop
1/40
$625,000
3 beds1 bath1,430 sq ft0.42 acre (lot)
5025 366th St S, Auburn, WA 98001
Listing provided by NWMLS as Distributed by MLS Grid
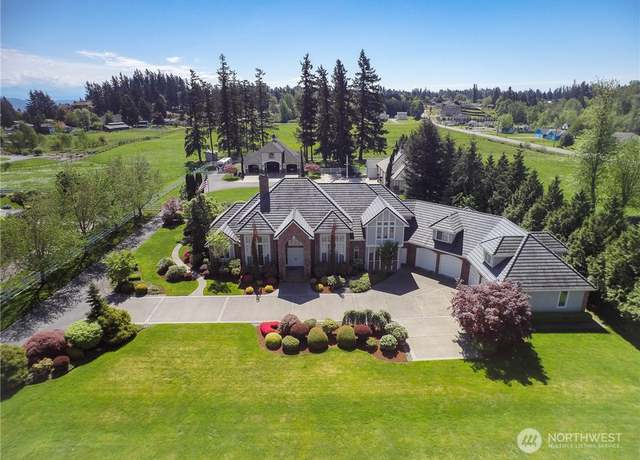
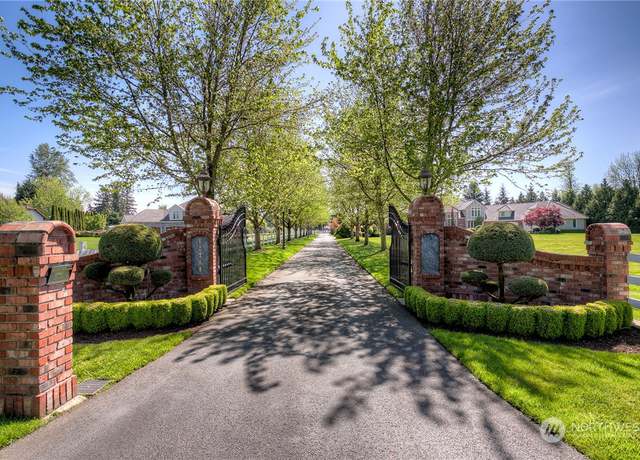
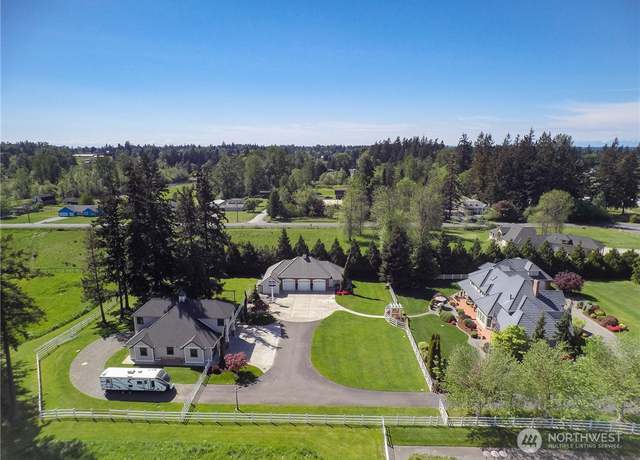
Unparalleled retreat nestled within a gorgeous 3-acre gated estate. The estate has been thoughtfully laid out with its formal tree-lined drive, timeless architectural styling, elegantly landscaped grounds, detached shop/garage with car lift & 1/2 bth, & beautiful cedar-lined barn. Crafted by a master builder, no expense has been spared in selecting the finest materials, promising enduring elegance. The main floor primary suite boasts a walk-in tile shower, indulgent jetted soaking tub, coffered ceilings, expansive wardrobe room, & private deck. High ceilings throughout the home impart a grand ambiance, balanced by the warm of rich woodwork. Beautifully appointed chefs kitche
1/26
$2,295,000
4 beds4 baths5,219 sq ft2.84 acres (lot)
12310 12th St E, Edgewood, WA 98372
Listing provided by NWMLS as Distributed by MLS Grid
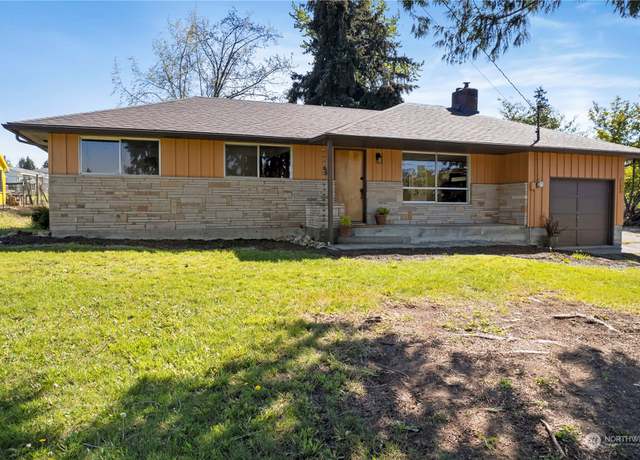
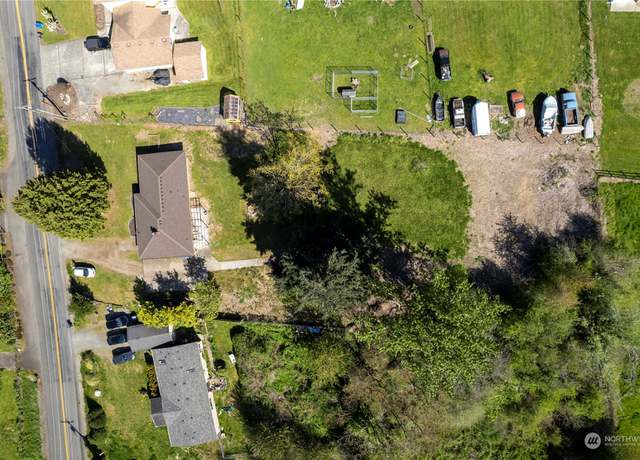
Nestled on a spacious . 75 - acre lot, this rambler is 3 bedrooms, 1 bathroom and 1,086 square feet. Some qualities include: NEW ROOF, NEW PAINT IN AND OUT and NEW electric hot water heater. Cedar board & bat siding w/ wilkinson sandstone accent. As you walk through the front door, you have original hardwoods in the living room, hall and all bedrooms. Livingroom w/ Fireplace and coffered ceilings. The kitchen has an eating nook, original cabinets and Formica countertops. Only one of the bedrooms has closets. This big lot provides space for you to park your RV and is perfect for entertaining w/ a large backyard. Additionally, one car garage & extra storage. Plenty of space for AD
1/30
$535,000
3 beds1 bath1,086 sq ft0.75 acre (lot)
12020 18th St E, Edgewood, WA 98372
Listing provided by NWMLS as Distributed by MLS Grid
Do you run a business and/or need a move in ready property with a lot of parking? This nicely updated one-story home perched above 1.06 acres with 3 Bedrooms, 2 new bathrooms is ready for you. Open floor plan with living rm, dining rm and kitchen. Hardwood flooring, vinyl flooring, interior paint, quartz countertops, along with a detached 432 sf shop/garage. Low towards the street, terraced upward with a circular drive. Lower part of the property is level for all your vehicles. New Fence with 2 entrances along the 90ft of frontage on West Valley Hwy. City of Edgewood will allow conditional use permit for business use or keep it rural and residential. Buyer to verify all info with City. Thi
1/40
$850,000
3 beds2 baths1,500 sq ft1.06 acres (lot)
2004 W Valley Hwy E, Edgewood, WA 98372
Listing provided by NWMLS as Distributed by MLS Grid
Beautiful 3 Bed, 1 Bath Manufactured Home in Auburn, this is an all-ages community. This home features Large covered front deck & extra 1 storage shed. Private gated community offers a fully fenced outdoor pool, clubhouse, playground, billiard table, gym & basketball court. Only a few minutes from shopping centers and restaurants.
1/35
$120,000
3 beds1 bath980 sq ft4,000 sq ft (lot)
210 37th St SE #28, Auburn, WA 98002
Listing provided by NWMLS as Distributed by MLS Grid
2021 NW Modern Home Featuring 2,150 SF of an Open Air Conditioned A/C Floor Plan Layout, 4 BR / 2.5 Bath with an Upstairs Laundry Room. Primary Suite w/ Soaking Tub, All Glass Shower & Heated Tile Floors. Walk-in Closets Throughout. The Open Kitchen Design includes a Quartz Waterfall Island with Eating Space, Spacious Walk In Pantry & Extra Storage. The Covered Outdoor Entertainment Area provides ample space for those BBQ nights, Beautiful Firepit Area & Plenty of Room to Stretch. The Yard Includes a 200SF Shed for your Gardening Needs. Over Sized 557 SF Garage & Long Private Driveway Provides Plenty of Parking for RV's, Boats & Trailers w/ Easy Access to 167,
1/40
$748,375
4 beds2.5 baths2,150 sq ft0.30 acre (lot)
107 2nd Ave S, Algona, WA 98001
Listing provided by NWMLS as Distributed by MLS Grid
Welcome To This Updated Home Nested In Auburn Manor. A Gated Community w/ 3 Bedrooms & 2 Bathrooms, Nicely Situated On The Lot Feeling Very Spacious Around The Home. Comes w/ 2 Parking Spaces Nearby & A Storage Building. Updated Items Are The Bathrooms, Countertops, Cabinets, Stained Wood Paneling & More. Pet Friendly Yard Area. Large Community Area Includes A Club House w/ Kitchen & Bathroom, Gym Room, TV Area. Outside Includes A Pool, Basketball Court & 2 Playgrounds. Conveniently Located In Auburn, Near Large Shopping Centers, Restaurants, Grocery Stores & Bus Routes.
1/37
$139,900
3 beds2 baths1,503 sq ft
210 37th St SE #84, Auburn, WA 98002
Listing provided by NWMLS as Distributed by MLS Grid
Fantastic Opportunity to build your Mountain/Valley View home on this shy . 5 acre commuter friendly parcel! Perched up on the top edge of West Hill Auburn, this moderately treed lot sits among well kept new & older homes on large lots. It's positioned along the East side of a King County maintained and paved road. Close to highways I-5, 18 & 167 and to Sounder train station. Sewer & gas are not available. Power & water are in the street. Seller has not done any feasibility work nor has any reports on the property. Just a hop, skip & jump to Five Mile Lake, Trout Lake, shopping, medical services & schools. After clearing property, Enjoy year-round Valley
1/34
$95,000
— beds— baths0.47 acre (lot)
370 XX 55th Ave S, Auburn, WA 98001
Listing provided by NWMLS as Distributed by MLS Grid
Well maintained upgraded mobile home in prime location. Spacious 3BR 1.75 Bath home with upgraded kitchen, baths, and flooring. Large primary BR and private back yard compliment vaulted ceilings, skylights, and quality custom made porch. This home is close to shopping, schools, parks, freeway, and dining. Don't miss out, check it out today.
1/22
$180,000
3 beds2 baths1,584 sq ft
4248 A St SE #133, Auburn, WA 98002
Listing provided by NWMLS as Distributed by MLS Grid
Attention Investors looking for two parcels of land to develop in King County! Conveniently located and a total 14,400 SF, these vacant lots are waiting for you to bring your plans for your new home! Lightly treed, topography is level and sloped. Zoned R4 and power as well as water in street. Rural West Hill Auburn location yet close to shopping, restaurants, recreation and schools. Also conveniently located near Auburn Station, easy access to Hwy 18, I5 and 167 as well as minutes to Seatac Airport; perfect for commuting. Buyer to verify all information with appropriate agencies.
1/7
$105,000
— beds— baths0.33 acre (lot)
368 XX 55th Ave S, Auburn, WA 98001
Listing provided by NWMLS as Distributed by MLS Grid
Come see this Gem, that offers everything you're looking for! Freshly painted, remodeled, and updated! Enjoy a kitchen with new cabinets countertops and charcoal Stainless Steel appliances! Generous sized rooms, and a master suite that will meet all your needs! All ages Auburn Manor Mobile Home Park enjoys a sense of community and offers incredible amenities. Indoor pool, BBQs, fitness center, playground, clubhouse, billiard table, sports court; special events kitchen is available for members to rent for gatherings. This is the home you've been waiting for!!
1/34
$160,000
3 beds2 baths1,300 sq ft
210 37th St SE #144, Auburn, WA 98002
Listing provided by NWMLS as Distributed by MLS Grid
PERFECT property to build your Dream home! Incredible 2 tax parcels! Dream home or investment property. Easement on north side of portion to the back. Survey has been completed for easement and recorded with County. Water, electricity is at street. Septic is needed. Ready for you to come make this your home or build others for an investment. Quiet setting, lightly treed. lots number 1-19 PTN 20-22. Private and beautiful. Walking distance to 5 Mile Lake. Broker must be present when viewing property. Brick home is NOT part of the property, separate owner- do not bother, Land only.
1/14
$475,000
— beds— baths1.27 acres (lot)
363 XX Military Rd S, Auburn, WA 98001
Listing provided by NWMLS as Distributed by MLS Grid
Based on information submitted to the MLS GRID as of Fri May 03 2024. All data is obtained from various sources and may not have been verified by broker or MLS GRID. Supplied Open House Information is subject to change without notice. All information should be independently reviewed and verified for accuracy. Properties may or may not be listed by the office/agent presenting the information. Some IDX listings have been excluded from this website.
School data is provided by GreatSchools, a nonprofit organization. Redfin recommends buyers and renters use GreatSchools information and ratings as a first step, and conduct their own investigation to determine their desired schools or school districts, including by contacting and visiting the schools themselves.Redfin does not endorse or guarantee this information. School service boundaries are intended to be used as a reference only; they may change and are not guaranteed to be accurate. To verify school enrollment eligibility, contact the school district directly.
Pacific, Washington boasts a well-structured transportation system that caters to the needs of its residents. The city experiences moderate levels of traffic, making driving a car a convenient option for most. Public transportation is available, providing an alternative for those who prefer not to drive. Additionally, Pacific is conveniently located near several major highways and freeways, further enhancing its connectivity.
What types of properties are available in Pacific?
Pacific, Washington offers a range of single-family home types, including ranch-style homes, split-level homes, and contemporary homes. These homes can be found throughout the city, with ranch-style homes typically built in the 1960s and 1970s, split-level homes built in the 1980s and 1990s, and contemporary homes built in the 2000s and beyond. To explore different property types for sale in Pacific, Washington, use the 'Home type' filter located above the active listings. Customize your search by selecting options like single-family homes, condos, townhomes, and more.
What is life like in Pacific?
Living in Pacific, Washington offers a serene and picturesque environment surrounded by lush greenery and breathtaking natural landscapes. The region experiences a mild and pleasant climate, with warm summers and cool winters. The area provides a range of job opportunities across various industries, ensuring a diverse and thriving economy. Residents can engage in a multitude of recreational activities, such as hiking, biking, and exploring the numerous parks and trails. Additionally, the community fosters a vibrant social scene with ample opportunities for entertainment, dining, and cultural experiences.
What are the schools and amenities like in Pacific?
Pacific, Washington offers a variety of public amenities for its residents. Dining options are available with the presence of local restaurants. Green spaces can be enjoyed with the presence of parks in the area. Daily needs can be met with grocery stores available within the city limits. Additional amenities include a public library and a post office, providing essential services to the local community.
In the past month, 6 homes have been sold in Pacific. In addition to houses in Pacific, there were also 0 condos, 1 townhouse, and 1 multi-family unit for sale in Pacific last month. Find your dream home in Pacific using the tools above. Use filters to narrow your search by price, square feet, beds, and baths to find homes that fit your criteria. Our top-rated real estate agents in Pacific are local experts and are ready to answer your questions about properties, neighborhoods, schools, and the newest listings for sale in Pacific. Our Pacific real estate stats and trends will give you more information about home buying and selling trends in Pacific. If you're looking to sell your home in the Pacific area, our listing agents can help you get the best price. Redfin is redefining real estate and the home buying process in Pacific with industry-leading technology, full-service agents, and lower fees that provide a better value for Redfin buyers and sellers.


 REDFIN IS COMMITTED TO AND ABIDES BY THE FAIR HOUSING ACT AND EQUAL OPPORTUNITY ACT. READ REDFIN'S FAIR HOUSING POLICY AND THE NEW YORK STATE FAIR HOUSING NOTICE.
 United States
 Canada