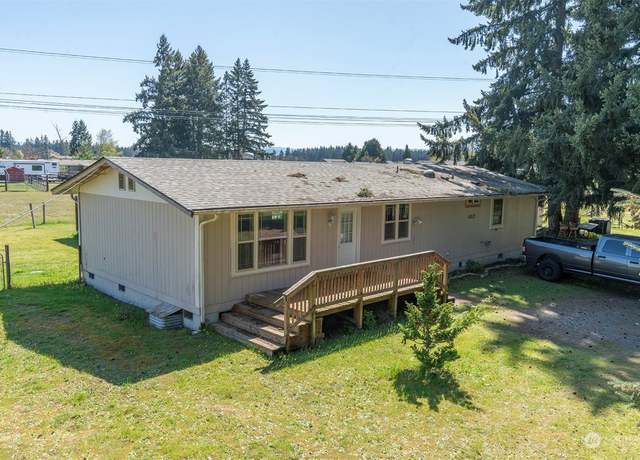
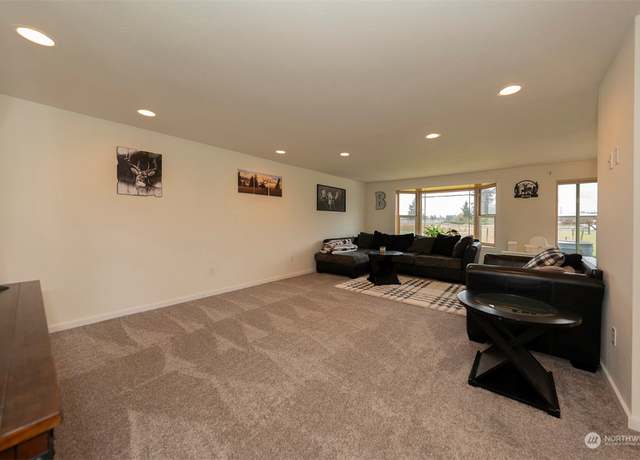
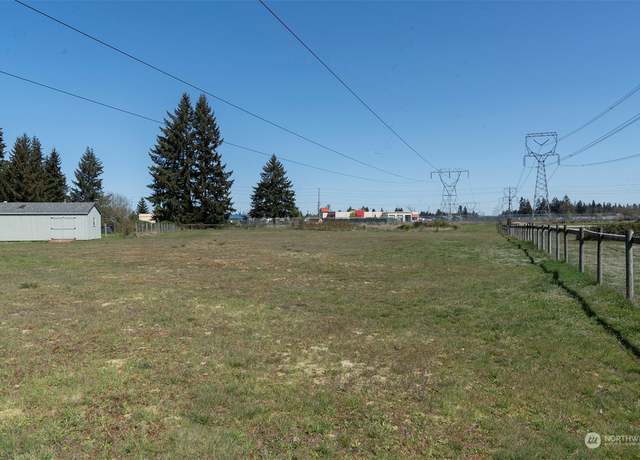
A well kept, 3 bed, 1¾ bath, 1,467 SqFt, Mt. Rainier view home on 2.62 acres - with all of Yelm’s amenities just around the corner! You’ll enjoy a roomy kitchen, open to the dining room and living room. All appliances included. The large primary bedroom has an attached ¾ bath and walk-in closet. Outside there’s a 2 car detached garage, storage shed, several nice big trees and plenty of open space to roam on this fully-fenced property with gated entry. No HOA. Modular home, not Manufactured home.
1/18
$500,000
3 beds2 baths1,467 sq ft2.62 acres (lot)
10820 Morris Rd SE, Yelm, WA 98597
Listing provided by NWMLS as Distributed by MLS Grid
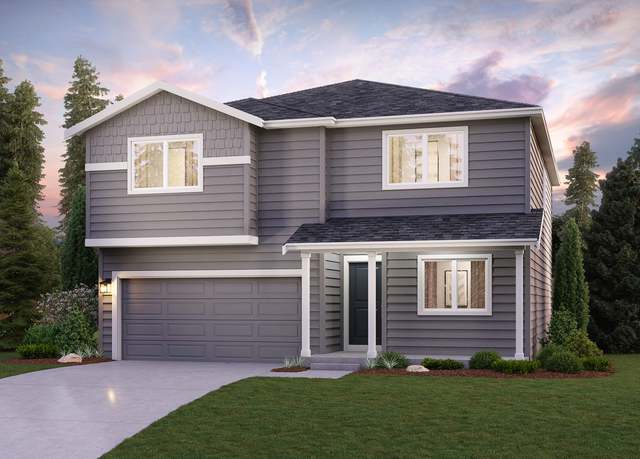
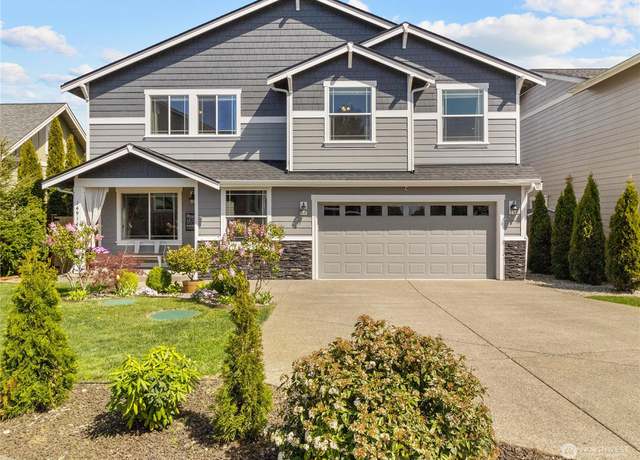
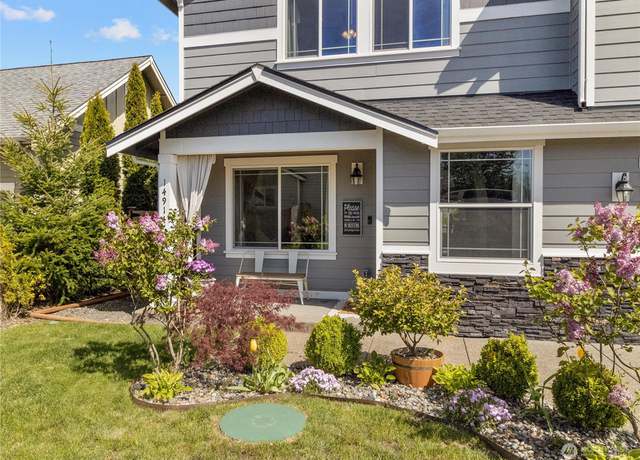
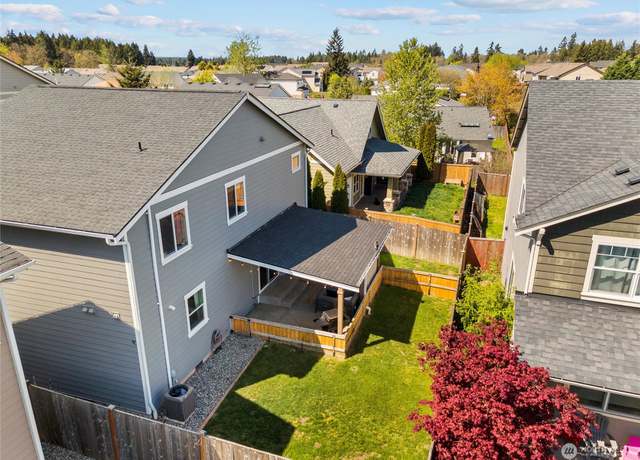
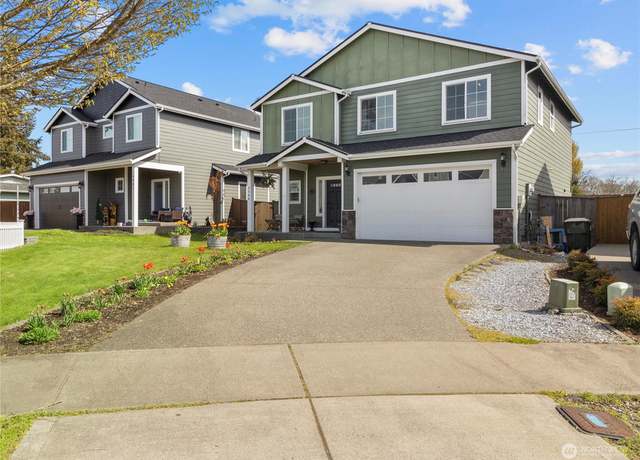
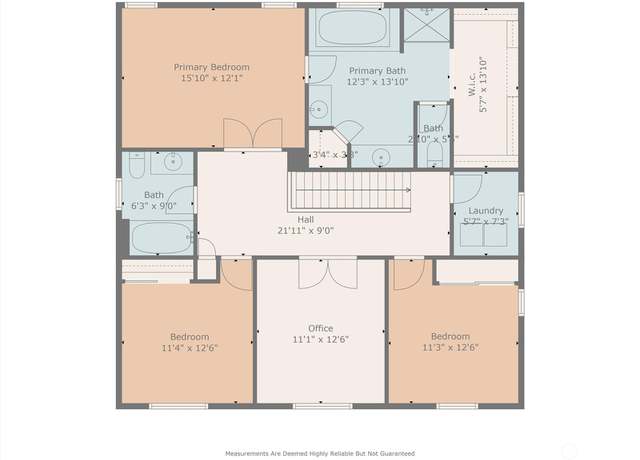
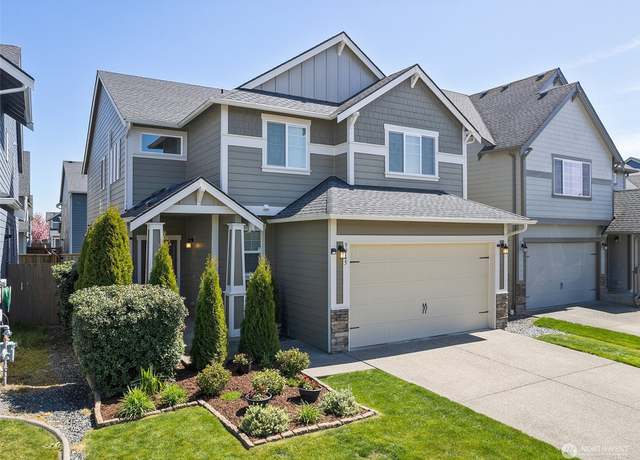
Welcome home!! The beautiful 4-bedroom 2.5 bath has everything you could want! Granite kitchen counters with an island and walk in pantry, primary suite w/ 5 piece bath & walk-in closet, bonus loft area upstairs, AND a fully fenced in backyard with covered patio perfect for entertaining. Easy commute to I-5 & JBLM, the neighborhood clubhouse has a gym for housing residents! Dont miss this house!
1/30
$475,000
4 beds2.5 baths1,866 sq ft4,666 sq ft (lot)
14914 91st Ave SE, Yelm, WA 98597
Listing provided by NWMLS as Distributed by MLS Grid
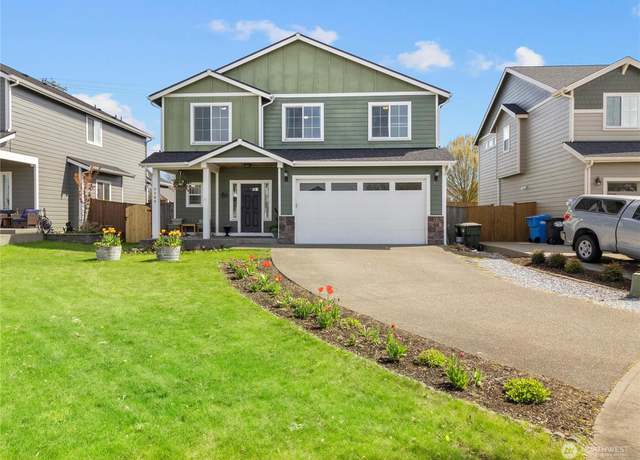
Gorgeous well-cared for home in the heart of Yelm! You are welcomed into the main entry by newer vinyl plank flooring, open concept living room with fireplace and office/den. Kitchen features updated cabinetry, stainless steel appliances, and granite countertops. Upper level has inviting primary suite with 5pc bath, tile floors, and walk in closet. Two additional bedrooms, an office, and utility room complete the upper level. Central AC great for those summer days, sprinkler system, covered back patio, and fenced backyard. Close to parks, schools, shopping, JBLM, and more! ASSUMABLE 5.625% VA Loan.
1/36
$499,500
3 beds2.5 baths2,206 sq ft5,601 sq ft (lot)
9948 Locust Ct SE, Yelm, WA 98597
Listing provided by NWMLS as Distributed by MLS Grid
Impeccably Cared For & Better Than New! Generously Designed w/ Nearly 2500 sq ft, 4 Bdrms, Main Lvl Den, & BIG Bonus Rm, too! A Soaring Ceiling Entry Leads to the Great Rm w/ Cozy Fireplace & Entertainer's Kitchen w/ SS Applcs, HUGE 8 Ft Slab Island, Abundant Cabinetry, & Dining Nook! Upstairs, the Primary w/ En Suite = 6 ft Tub, Dual Sinks, & WIC! The Connecting Bdrm is Ideal for a Nursery or 2nd Office! Enjoy Coffee or Dine Alfresco Under the Covered Patio in the Fenced Backyard! Comfort Found w/ a NEW Whole Home A/C, Tankless H2O, NEW Interior Paint, & 1 Yr Home Warranty! Home Inspect DONE! Close in Town w/ Community Parks & Paths! Award-Winning SD h
1/40
$540,000
4 beds2.5 baths2,492 sq ft4,000 sq ft (lot)
9965 Dain St SE, Yelm, WA 98597
Listing provided by NWMLS as Distributed by MLS Grid
Welcome to Yelm & this Amazing Community, Tahoma Terra! A 2018 Built Home at 2442 Sq. Ft. with 4+ Bedroom 2.5 Bath that offers ultimate flexibility with a Bonus Rm & an Office to utilize as the New Owner Sees Fit. Upon entering you can't help but notice the High entry ceilings & Open Concept Living Area that leads to a Large Kitchen that features a Beautiful Island, Quartz Countertops, Decorative Tile Backsplash with A Gas Range. Enjoy a Spacious Great Rm with a Gas Fireplace & Built in Cabinets. Upstairs you will find the Primary Bedroom with 5-piece Bath, Walk-in Closet, 3 additional bedrooms & A Large Bonus Room! No Need to Ever Get Hot & Bothered Duri
$540,000
4 beds2.5 baths2,442 sq ft4,000 sq ft (lot)
9969 Charles St, Yelm, WA 98597
Listing provided by NWMLS as Distributed by MLS Grid
This updated gem boasts 1140 sq. ft of living space, featuring 3 bedrooms and 1 bathroom. Situated on a spacious 10,622 sq. ft lot with plenty of space to garden in a peaceful cul-de-sac, this home offers the perfect blend of comfort and convenience. Step inside to discover the ultimate in comfort with air conditioning, ensuring a cool retreat during warm summer days and a pellet stove to cozy up to on cool winter nights. The newer roof provides peace of mind, while the updated kitchen is very spacious with tile counters, a stylish backsplash, stainless steel appliances and a pantry with stylish barn door. With its desirable location close to schools, shopping and restaurants, don't miss ou
$415,000
3 beds1 bath1,140 sq ft0.24 acre (lot)
1206 NW Crystal Ct, Yelm, WA 98597
Listing provided by NWMLS as Distributed by MLS Grid
Don't miss this 3 bedroom, 2.5 bath in the Single Tree Estates! Downstairs features a cozy layout with vaulted ceilings. Upstairs features the primary suite with master closet & two more bedrooms. New flooring & paint throughout. The community features a boat launch, club house, sports court, & private access to Clear Lake!
$399,950
3 beds2.5 baths1,325 sq ft9,579 sq ft (lot)
18306 SE Hames, Yelm, WA 98597
Listing provided by NWMLS as Distributed by MLS Grid
Amongst the majestic Douglas firs, your home is waiting for you! Propane fireplace provides ambiance to the flowing floor plan offering nearly 1600 sqft of Living space. Natural lighting flows through the bay window in Dining rm w/ pass-through to Kitchen for easy serving/entertaining. Three bdrms are all located on the upper level including Primary Suite completed w/ walk-in closet. The fenced back yard is ready for your four legged friends while you enjoy nature on the expansive deck. Forget pesky power outages: set up for back up generator. Unique, one of a kind setting in the gated Clearwood community offering swimming pool, three lakes w/ picnic areas, bbqs, & boat ramps. Close to
$399,900
3 beds2.5 baths1,572 sq ft7,821 sq ft (lot)
18235 SE Rampart Dr, Yelm, WA 98597
Listing provided by NWMLS as Distributed by MLS Grid
Welcome home to this picturesque 5+ acre ranch nestled in the Cascade foothills. This property showcases all the natural beauty of the PNW. It is tucked away on a dead-end private road and backs up to acres of WA Dept. of Natural Resources land. This mini-farm is perfect for equestrians, with a 24x36 six-stall barn, 100x60 two-stall horse pen, greenhouse, 24x36 shop with RV parking, 2-car garage, and newly installed solar array. The three-bedroom home features tons of natural light, an open floor plan, and has been lovingly cared for. It is surrounded by a “food forest” with several fruit trees and more. It’s the perfect refuge to retire to after a long day on the farm. Lo
$625,000
3 beds2 baths1,624 sq ft5.09 acres (lot)
14340 Hidden Oak Ln SE, Yelm, WA 98597
Listing provided by NWMLS as Distributed by MLS Grid
Escape to Northern Yelm to this double lot haven, embraced by nature’s beauty & mere steps from the Nisqually River. This spacious retreat sits on over half an acre, boasting a sizable kitchen & a sunlit bonus room with a cozy wood-burning pellet stove. Beyond the fenced front yard & double driveways lies a landscaped paradise with mature shrubs & trees, perfect for gardening. In the backyard, discover a detached garage, a charming half barn, & an inviting fire pit for magical evenings under the stars. Enjoy the perks of the Nisqually Pines community, offering a pool, private river access, basketball courts, & scenic trails, all while being close to O
$400,000
2 beds2 baths1,056 sq ft0.29 acre (lot)
17143 Snowbell Ct SE, Yelm, WA 98597
Listing provided by NWMLS as Distributed by MLS Grid
New Construction home in Oakridge Community. This 1,679 Sq Ft home has 3 bedrooms, bonus room/den/office with 2.5 baths, and 2 car garage. Open kitchen concept with slab quartz counter tops, full height tile backsplash, stainless steel whirlpool appliances, upgraded cabinetry and painted onsite millwork. Laminates flooring throughout entry, kitchen, and dining. Large primary suite with 5 piece master bathroom with walk in closet. Two additional bedrooms with large walk in closets! Short commute to Yelm, JBLM and I-5. EST July 2024 Still time to pick out colors!
$529,999
3 beds2.5 baths1,679 sq ft4,786 sq ft (lot)
16301 Greenbrier St SE, Yelm, WA 98597
Listing provided by NWMLS as Distributed by MLS Grid
Amazing home in the desirable gated community of Clearwood. Home has 2 beds, 2 baths and 1008 SF on a 7,882 SF lot. Newer roof, kitchen with Quartz counters, SS appliances & glass tile back splash, deck, laminate in great room, kitchen and hall, carpet in bedroom and primary, Community offers lakes, beaches, trails and pool. This home is a charm come and see it before it's gone.
$350,000
2 beds2 baths1,008 sq ft7,882 sq ft (lot)
22424 Bluewater Dr SE, Yelm, WA 98597
Listing provided by NWMLS as Distributed by MLS Grid
The Warren on Homesite #73 located on a beautiful corner lot! This spacious 2,448 sq/ft, 4bd, 2.25 bath home + main floor den. Featuring expansive LVP floors in main living areas, beautiful cabinetry, quartz slab kitchen counter tops & huge island w/ plenty of room for extra seating, cooking, entertaining & additional dining space. Mudroom & powder room off garage entry. Covered back patio makes this plan great for year round outdoor living! Primary suite w/ large WIC + linen closet. Upstairs laundry & bonus room! Heat pump for comfortable temps all year! Nearby schools, restaurants & JBLM. Customer registration policy: Site Reg #4784: Buyer Broker must accompa
$559,990
4 beds2.5 baths2,448 sq ft4,500 sq ft (lot)
15186 Iverson (Lot 73) Loop SE #73, Yelm, WA 98597
Listing provided by NWMLS as Distributed by MLS Grid
Beautiful 2 Story 4 Bedroom 2.5 Bath on a huge corner fenced lot has so much to offer. Flowing floor plan, chefs kitchen with Granite counter tops, Gas Stove, lots of cabinets, office or den on 1st floor, family room upstairs, French doors leading into the master suite, 3 car Garage. All this and so much more. A short walk to golf course or walking distance to bus stop. Note: some pics are from our previous listing 2022.
$545,000
4 beds2.5 baths2,573 sq ft6,889 sq ft (lot)
15176 SE Durant Dr, Yelm, WA 98597
Listing provided by NWMLS as Distributed by MLS Grid
Clearwood Split-Level Dream Home! Step into warmth and comfort in this inviting 3-bed, 2-bath haven, spanning 1,532 sq ft. The heart of the home is its open kitchen, now enhanced with newer stainless steel appliances—a culinary oasis inviting laughter and shared meals. Two spacious living rooms offer cozy corners for relaxation or lively gatherings. Nestled in Clearwood's coveted community, this home isn't just a place—it's where memories are made. Seize the chance to embrace a life filled with warmth, love, and cherished moments in this beautiful space. Every detail, from the gleaming floors to the tranquil bedrooms, whispers of home. Don't miss out on this slice of Clearwood p
$420,000
3 beds2 baths1,532 sq ft7,204 sq ft (lot)
21724 E Terra Ln SE, Yelm, WA 98597
Listing provided by NWMLS as Distributed by MLS Grid
Nestled in serene Tahoma Terra; this elegant residence is designed with modern living in mind. This home radiates warmth and welcoming vibes, making it the perfect haven for both relaxation and entertainment. Inside, discover a beautifully appointed interior that boasts an open-plan layout. The kitchen comes equipped with all appliances and ample storage, making meal preparation a breeze. The bedrooms are designed for comfort and not to be overlooked, the bathrooms feature contemporary fixtures, adding a touch of elegance to daily routines. The location of this property could not be more ideal. An abundance of community parks, a swift 30 minutes to JBLM, and local shops and entertainment ba
$442,500
3 beds2.5 baths1,437 sq ft3,105 sq ft (lot)
14433 Lockwood Ln SE, Yelm, WA 98597
Listing provided by NWMLS as Distributed by MLS Grid
This recently updated home on a large lot offers privacy in a convenient location. With fresh paint as well as new Pergo flooring it is move in ready. You will love the covered front porch, bay window, vaulted ceilings, large family room, spacious eat in kitchen, and good sized bedrooms. The home has a newer roof, a back deck, back yard access to garage, and a shed for your extra storage needs. The large driveway offers room for your RV.
$410,000
3 beds1.5 baths1,232 sq ft0.37 acre (lot)
8546 Sweet Clover Dr SE, Yelm, WA 98597
Listing provided by NWMLS as Distributed by MLS Grid
Welcome Home! This adorable home in Yelm is the perfect house ready for you to move in! 3 Bed / 2.5 Bath, Great room concept living! Cozy Gas Fireplace and Easy Care Wood Laminate Floors! Kitchen with HUGE Island, tile Granite, Espresso Cabinetry & All Appliances including Wifi Capable Fridge! Upper Level Hosts Bedrooms, laundry room and a space for an office or reading area! Master Suite, Dual Entry Doors, 5 Pc Bath complete with two Closets! Fully Fenced Backyard with Covered Patio! Stop by and take a look!
$465,000
3 beds2.5 baths1,873 sq ft3,615 sq ft (lot)
10010 Cochrane Ave SE, Yelm, WA 98579
Listing provided by NWMLS as Distributed by MLS Grid
Welcome to your beautiful retreat on the lake in the Clearwood Community! Not a single detail was overlooked in this custom built home. Just shy of 1700 sqft, 3bd/2bath, Office, 1/3 acre, & upgrades galore! Beautiful heated floors are continuous throughout the home, custom kitchen cabinets, Kitchenaid appliances, sliding french doors open up to the covered back patio & private yard. Primary suite has a jetted tub, w/ in closet. 2 addt spacious bedrooms, addt bath, & laundry rm. Oversized garage w/ epoxy floors, generator that powers the entire house, A/C, & , leaf guard gutters, & so much more! Step out to the lake right from your property, & enjoy the communit
$495,000
3 beds2 baths1,690 sq ft0.30 acre (lot)
18506 Woodside Dr SE, Yelm, WA 98597
Listing provided by NWMLS as Distributed by MLS Grid
Longing for the wide open spaces? Spring-time fresh and move-in ready for you and your crew, your furry friends, your toys, your trucks and tools. There's room for everyone and all your dreams. Situated on . 7 acre of flat, fenced usable land the possibilities are unlimited. There are plenty of sunny spaces for gardening, too. Inside the floor plan offers the same flexibility with spaces that can fit casual or formal lifestyles. Downstairs living spaces can morph from formal living/dining to office and game room. The upstairs open balcony landing feels special. Primary suite has big eastern facing windows that will wake you with the morning sun and let in the soft breeze. Air conditioning f
$650,000
4 beds2.5 baths2,465 sq ft0.71 acre (lot)
17227 123rd Ct SE, Yelm, WA 98597
Listing provided by NWMLS as Distributed by MLS Grid
Discover unparalleled outdoor enjoyment at this Yelm retreat! The primary bedroom suite graces the main level, seamlessly flowing to an expansive deck with a hot tub-your private escape. Upstairs, four large bedrooms provide space for rest and rejuvenation. The heart of the home is a chef's delight, featuring a double oven and elegant quartz countertops. Step outside to a world of entertainment: a gazebo for gatherings, outdoor fire place, horse shoe pits, a tolf and frisbee course for friendly competition, along with children's play area and Lake Lawrence access for water enthusiasts. New roof in 2022! This property is more than a home—it's a lifestyle enclave, ready to enchant with
$739,000
5 beds2.5 baths2,752 sq ft2.20 acres (lot)
16835 162nd Ln SE, Yelm, WA 98597
Listing provided by NWMLS as Distributed by MLS Grid
Marvelous move-in ready multi-level! Freshly painted interior w/ brand new laminate flooring & carpet. Family rm w/ vaulted ceilings welcomes you inside, peeking into Kitchen (all appliances stay!) w/ large pantry, separated from Dining by island counter w/ eating bar. Soak your troubles away in deep corner tub in private bthrm w/ walk-in shower & dual sinks, attached to Primary Suite finished w/ walk-in closet. Slider opens from lower level Living rm (with tile wrapped gas fireplace) onto patio. Ahh. . sit back and relax, enjoying the outdoors in spacious fully fenced back yard. Stroll the sidewalks around the neighborhood, enjoying community parks w/ playground. Blocks from Co
$475,000
4 beds2.5 baths2,231 sq ft6,000 sq ft (lot)
10469 Yelm Terra St SE, Yelm, WA 98597
Listing provided by NWMLS as Distributed by MLS Grid
Adorable starter or scale down home in prestigious gated community that's fun; 3 lakes stocked w/ fish, 5 beaches, Olympic size swimming pool, 14 mi of walking trails, multiple sport courts, 5 play grounds w/ bbqs & cabanas. Home features a huge updated chef's kitchen w/ slate floors, spacious family/bonus room w/ wood stove & skylight beyond french doors. Bedroom on each floor & full bath on main floor w/ stacking washer/dryer. All appliances included. Huge deck in front and another one in the back offer great spaces for relaxing or entertaining. Large lot terraced in the back results in extra privacy. Fire pit. Partially fenced for pets. 10x12 storage shed. Parking space
$340,000
2 beds1 bath1,220 sq ft0.23 acre (lot)
18002 Clear Lake Blvd SE, Yelm, WA 98597
Listing provided by NWMLS as Distributed by MLS Grid
Mt. View Meadows is located near amenities, schools, parks, recreation & JBLM! 2,386 sq. ft of living space, The Bennett on Lot #9, which features 3 bed-2 1/4bath w/ spacious den or perhaps formal dining on main. Tons of storage throughout! Included in this beautiful home are crisp white cabinets, slab quartz kitchen counter tops & island. Kitchen is open concept to living area. Huge bonus space/loft, convenient laundry on 2nd floor, & generous WIC in primary bed/bath suite. Additional features include heat-pump for cooling & heating. Customer registration policy: Site Reg #4784: Buyer Broker must accompany & personally register buyer at first visit. Ask about o
$524,990
3 beds2.5 baths2,386 sq ft4,731 sq ft (lot)
15159 Iverson (Lot 9) Loop SE #9, Yelm, WA 98597
Listing provided by NWMLS as Distributed by MLS Grid
Clearwood, a community located just southeast of Yelm, offers an array of amenities including lakes, playgrounds, and developed beaches. Nestled within this serene neighborhood is a delightful 3-bedroom, 2.5-bathroom home. With its open concept layout and vaulted ceilings, this residence encompasses a spacious living room, kitchen, and a balcony. The main floor features a primary bedroom for convenience. Downstairs, you'll find 2 additional bedrooms, a large built-in craft/office area, and a family room. Ample storage space, an oversized garage, and the inclusion of a heat pump, this home is designed for comfort and functionality. Plus, enjoy easy access to the East Gate of JBLM and local s
$475,000
3 beds2.5 baths2,340 sq ft0.24 acre (lot)
18634 Woodside Dr SE, Yelm, WA 98597
Listing provided by NWMLS as Distributed by MLS Grid
Discover the timeless charm of this well-maintained Craftsman-style home. Featuring 2,713 sf of living space, 4 br, 2.5 ba and a 3-car finished garage, this home boasts an open floor plan that's perfect for entertaining. The Great Room is spacious and inviting, while the kitchen features granite countertops, stainless steel appliances, and a walk-in pantry. Upstairs, you'll find a large bonus room/loft, 3 br and a generous master with built-in closet organizers. You can enjoy warm summer nights under the covered patio or gather around the open-air fire pit in the beautifully developed backyard paradise. It's a great alternative to new construction's blank canvas. The home is near shops, res
$580,000
4 beds2.5 baths2,713 sq ft5,949 sq ft (lot)
10004 Tyleah Ct SE, Yelm, WA 98597
Listing provided by NWMLS as Distributed by MLS Grid
Lovely Country living 10 min. from downtown Yelm in highly desired Lake Lawrence area. Wonderful wooded lot backs to a greenbelt, on dead-end cul-de-sac. Beautiful Brand New manuf. home from the factory, never lived in--Energy Star Windows, Stainless Steel Appliances, White Shaker Cabinets w/ Island Breakfast Bar. Private Primary Bedroom Suite fits King Size bed; Walk-in Shower, Walk-in closet. 2nd, 3rd bedrms + full bath. Separate Laundry Room. Carport w/ storage, long driveway fits 3 cars. Lake Lawrence MHPark on 20+ acres often called "the nicest park around". No age restrictions, Space rent currently $600 incl. Septic & garbage. High Speed Internet avail. 2 pets under 20
$169,500
3 beds2 baths990 sq ft
17114 153rd Ave SE #28, Yelm, WA 98597
Listing provided by NWMLS as Distributed by MLS Grid
This beautiful home sits on a large, private lot in a great neighborhood with NO HOA. Almost everything has been updated with all new flooring on the main, an open concept kitchen with new appliances that opens to dining & living room w/ gas fireplace. Dining steps out to patio & large fully fenced yard. Main floor bonus room could be 4th bedroom/office/den. Upstairs is a large primary bedroom with 5-piece bath, huge soaker tub, 2 vanities, separate shower & large walk-in closet plus 2 more spacious bedrooms & laundry room. Large 3-car garage & tons of parking for your RV or boat. NEW furnace, Heat pump/AC! Buckhorn Estates is minutes to trails, Downtown Yelm
$470,000
3 beds2.5 baths1,797 sq ft5,793 sq ft (lot)
14937 89th Ave SE, Yelm, WA 98597
Listing provided by NWMLS as Distributed by MLS Grid
Welcome to Mountain View Meadows. This stunning 2-story home boasts 2,155 sq. ft of living space w/ 3 spacious bedrooms, 2.25 bathrooms, & a loft space upstairs. The open concept layout is ideal for entertaining guests, w/ electric fireplace adding warmth & ambiance to the living room. The modern kitchen has state-of-the-art appliances, quartz countertop, maple cabinets & hidden pantry. Additional amenities include upstairs utility room, 2-car garage w/ electric car charger & fenced backyard ideal for outdoor gatherings. Less than two years old, this property truly has it all. Don't miss out on the opportunity to make this house your forever home!
$529,950
3 beds2.5 baths2,155 sq ft4,856 sq ft (lot)
15029 Iverson Loop SE, Yelm, WA 98597
Listing provided by NWMLS as Distributed by MLS Grid
Explore this turn-key 2-story, 3 bed/2.5 bath home + bonus room in the Yelm Terra Community! Upon entering, you're greeted w/ vaulted ceilings & a spacious, cheerful dining & great room. The well-appointed kitchen comes with SS appliances, an eat-in nook, a large center island & ample storage space. The spacious lower level flows seamlessly between the family, dining, & living rooms boasting a gas tiled fireplace to unwind after your day. The main level primary bedroom offers serenity with its private 5-piece ensuite bath w/ a walk-in closet & deeper soaking tub. Upstairs, discover 2 sizable bedrooms & a versatile and double-doored bonus room. Located at
$499,999
3 beds2.5 baths2,166 sq ft6,000 sq ft (lot)
15880 104th Ave SE, Yelm, WA 98597
Listing provided by NWMLS as Distributed by MLS Grid
Welcome home this 3bed 2bath home w/ loft in Tahoma Meadows. Walk into an open concept plan w/ massive kitchen w/ huge Island, lots of cabinet & cupboard space, walk-in pantry, spacious living rm, & nice dining area. Head upstairs to a loft area for additional entertainment space with laundry upstairs. Every bedrm is spacious & has its own large walk in closets & ceiling fans. Primary bedrm is expansive & has 5 piece primary bathrm & huge walk in closet. Mud rm, Home has fiber optic installed media converter. Brand new roof w/ 50 year warranty. Fully fenced back yard w/ patio. All located 25mins to JBLM & Lacey, Olympia areas close to parks w/ farmer
$489,500
3 beds2 baths1,934 sq ft4,000 sq ft (lot)
14921 Terra View St SE, Yelm, WA 98597
Listing provided by NWMLS as Distributed by MLS Grid
Buy down your interest rate with seller incentives of 19K. Must use preferred lender! Welcome to The Camden plan by Soundbuilt Homes at Tahoma Terra! On the main level this home features two bedrooms, a full bathroom and lavish owner’s suite with spa-inspired bathroom privately situated at the back of the home. The great room, dining room and kitchen share a convenient and contemporary open floorplan. Upstairs bonus room, full bath and 4th bedroom add more shared living space and can be ideal for multigenerational households. This thoughtfully planned out Soundbuilt community is surrounded by beautiful woods, close to many shops, golfing, & restaurants in downtown Yelm and only a
$612,450
3 beds3 baths2,470 sq ft5,984 sq ft (lot)
14272 98th Way SE #387, Yelm, WA 98597
Listing provided by NWMLS as Distributed by MLS Grid
Clearwood community offers exclusive retreat like living & you get to live here year-round! This charming 3 bed/2 bath rambler has an updated kitchen w/ granite countertops, bar seating & a cozy pellet stove. The open concept design is spacious & the primary bedroom w/ ensuite is located away from the secondary bedrooms. Enjoy the outdoors? Check out the football sized playfield that is maintained by the HOA and is just steps beyond your backyard trees; plus the community offers 14 miles of trails, 6 beaches, 3 lakes stocked with fish, a pool, basketball & tennis courts, boat launches & much more. There's plenty of room to store all your extra gear in the LARGE
$392,500
3 beds2 baths1,235 sq ft7,905 sq ft (lot)
22321 Bluewater Dr SE, Yelm, WA 98597
Listing provided by NWMLS as Distributed by MLS Grid
Stunning & Better than new, Soundbuilt Home, “The Dogwood!” Welcome home to one of Yelm’s most desired communities, Tahoma Terra. With over 28k in tasteful upgrades and a heat pump to boot! Inviting entry, oversized quartz countertops, Italian subway tile backsplash, stainless gourmet appliances & pantry. LVP flooring throughout, matte black hardware and so much more! Spacious bedrooms & owners suite & bath w/ dual walk-in closets. Beautiful and easy to maintain yard with majestic Views of Mt Rainier! This community boasts a prime central location to access the amenities of Yelm! Best value on the market today! Must see to truly appreciate!
$415,000
2 beds2 baths988 sq ft3,080 sq ft (lot)
14383 Lockwood Ln SE, Yelm, WA 98597
Listing provided by NWMLS as Distributed by MLS Grid
This expansive, residence offers Main floor living, dining & kitchen to include 3 spacious Bedrooms, and 2 Bonus rooms. The home boasts 2 Full & 2 Half Baths, each meticulously designed to provide a spa-like experience, embodying resort-style living. The gourmet Kitchen is a chef's dream, featuring a double oven & high-end custom touches that make entertaining a breeze. Venture upstairs to a Bonus room equipped with a fridge, wet bar, ice machine & D/W perfect for gatherings. Storage is abundant throughout the home. An oversized 3-car Garage provides ample space for vehicles & hobbies. On nearly 6 Acres, enjoy covered front and back patios, and a cozy Fire Pit.
$1,200,000
3 beds3 baths3,847 sq ft5.72 acres (lot)
18322 125th Ln SE, Yelm, WA 98597
Listing provided by NWMLS as Distributed by MLS Grid
Hobby farm is ready for your animals. Milking station, covered kennels and storage shed. 3 separate fenced areas for animals (they had goats) and a larger pasture for cows or horses. Detached 4 car shop with about 1000 sq ft loft for storage or finish it as a living space. Also, an indoor living space for humans. 3 bed, 2 bath rambler with large, bonus room! Vaulted ceilings make the home feel light and bright.
$649,950
3 beds2 baths2,098 sq ft5.56 acres (lot)
12310 SE Morris Rd, Yelm, WA 98597
Listing provided by NWMLS as Distributed by MLS Grid
Motivated Seller. Large two story home in Lake Lawrence area. Open concept kitchen to living room. All interior appliances stay including washer and dryer. Hardwood floors, wood fireplace in living room. Huge covered porch for BBQ and entertaining. Home has formal living room and large rec room. All bedrooms are upstairs. Fenced back yard for pets. Private lake access includes dock usage and park with pickleball/tennis/basketball courts, playground, gazebos and BBQ's, beach front for swimming and you are able to wakeboard, ski and fish. The community events include 4th of July party, Easter Egg Hunt, Holiday dinner, discounted lodge rental. seller to give buyer $5k in concessions.
$565,000
4 beds2.5 baths2,288 sq ft0.34 acre (lot)
15637 Topaz Dr SE, Yelm, WA 98597
Listing provided by NWMLS as Distributed by MLS Grid
Based on information submitted to the MLS GRID as of Fri Apr 26 2024. All data is obtained from various sources and may not have been verified by broker or MLS GRID. Supplied Open House Information is subject to change without notice. All information should be independently reviewed and verified for accuracy. Properties may or may not be listed by the office/agent presenting the information. Some IDX listings have been excluded from this website.
This area's enrollment policy is not based solely on geography. Please check the school district website for more information.
Elementary schools
Middle schools
High schools
GreatSchools Summary Rating
8/10
Mill Pond Intermediate School
Public, PreK-5
5/10
Yelm Prairie Elementary School
Public, PreK-5
3/10
Fort Stevens Elementary School
Public, PreK-5
School data is provided by GreatSchools, a nonprofit organization. Redfin recommends buyers and renters use GreatSchools information and ratings as a first step, and conduct their own investigation to determine their desired schools or school districts, including by contacting and visiting the schools themselves.Redfin does not endorse or guarantee this information. School service boundaries are intended to be used as a reference only; they may change and are not guaranteed to be accurate. To verify school enrollment eligibility, contact the school district directly.
Homes for sale in Yelm have a median listing price of $500K. Some of these homes are Hot Homes, meaning they're likely to sell quickly.
How often does Redfin update their new listings?
Most of our new listings in Yelm are updated every 5 minutes so you can see new homes as soon as they come on the market. Learn more
What is transportation like in Yelm?
Yelm, Washington, offers a variety of transportation options, with a focus on driving. The city experiences moderate traffic levels, making car travel relatively smooth and efficient. While Yelm does not have its own public transportation system, it is conveniently located near several major highways and freeways, providing easy access to surrounding areas. Therefore, residents can rely on their cars for daily commuting and long-distance travel. Learn more on our Yelm city guide.
What types of properties are available in Yelm?
Yelm, Washington offers a variety of single-family home types, including ranch-style homes, split-level homes, and contemporary homes, among others. These homes can be found throughout the city, with some located in established neighborhoods and others in newer developments. Most properties in Yelm feature two to four bedrooms and were built within the past 20 years. To explore different property types for sale in Yelm, Washington, use the 'Home type' filter located above the active listings. Customize your search by selecting options like single-family homes, condos, townhomes, and more.
What is life like in Yelm?
Living in Yelm, Washington offers a serene and picturesque environment with scenic landscapes that include lush greenery, rolling hills, and breathtaking mountain views. The region experiences a variety of weather conditions, from mild summers to cool winters, providing a diverse climate for outdoor enthusiasts. The area provides a range of job opportunities across various industries, ensuring a dynamic and thriving economy. Residents can engage in a multitude of recreational activities, such as hiking, biking, and exploring the numerous parks and trails that surround the area. Additionally, the town hosts a vibrant community with a plethora of cultural events and local gatherings to participate in.
What are the schools and amenities like in Yelm?
Yelm, Washington offers a variety of public amenities for its residents to enjoy. The city boasts a number of restaurants, offering a wide range of cuisines to cater to diverse taste buds. For those who love the outdoors, there are several parks within the city limits. Grocery shopping is convenient with multiple grocery stores available for your daily needs. Additionally, Yelm is home to other amenities such as schools, libraries, and fitness centers, making it a well-rounded place to live.
In the past month, 26 homes have been sold in Yelm. In addition to houses in Yelm, there were also 0 condos, 1 townhouse, and 1 multi-family unit for sale in Yelm last month. Find your dream home in Yelm using the tools above. Use filters to narrow your search by price, square feet, beds, and baths to find homes that fit your criteria. Our top-rated real estate agents in Yelm are local experts and are ready to answer your questions about properties, neighborhoods, schools, and the newest listings for sale in Yelm. Our Yelm real estate stats and trends will give you more information about home buying and selling trends in Yelm. If you're looking to sell your home in the Yelm area, our listing agents can help you get the best price. Redfin is redefining real estate and the home buying process in Yelm with industry-leading technology, full-service agents, and lower fees that provide a better value for Redfin buyers and sellers.


 REDFIN IS COMMITTED TO AND ABIDES BY THE FAIR HOUSING ACT AND EQUAL OPPORTUNITY ACT. READ REDFIN'S FAIR HOUSING POLICY AND THE NEW YORK STATE FAIR HOUSING NOTICE.
 United States
 Canada