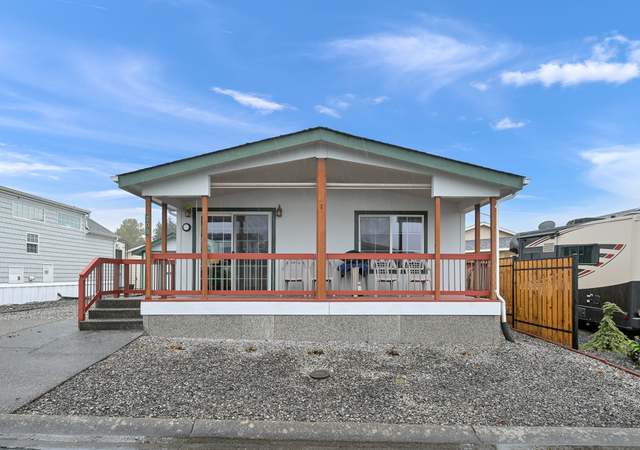
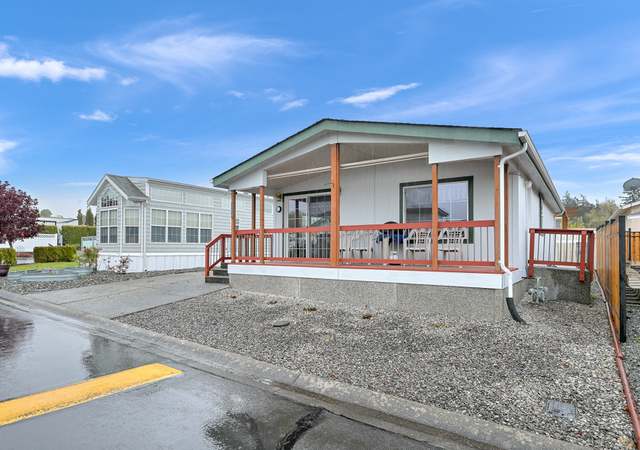
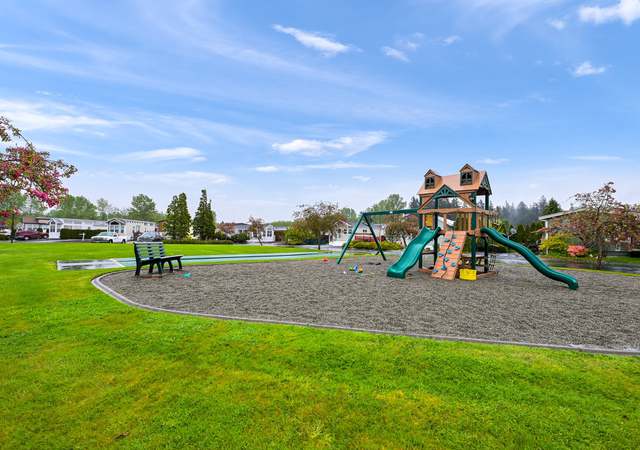
Escape to the idyllic Latitude 49 resort area! Nestled on a 180-day lot, this charming fully updated home offers the ultimate vacation retreat. Enjoy easy living with a low-maintenance yard, shed, and ample parking. Step onto the porch for a leisurely afternoon before heading to the clubhouse for a swim or tennis. Close to discover water slides, a corner market, and Birch Bay's beautiful beaches. Fully furnished and newly updated, this gem awaits your arrival. Don't miss out on this must-see opportunity!
1/49
$350,000
2 beds2 baths874 sq ft
4751 Birch Bay Lynden Rd #209, Blaine, WA 98230
Listing provided by NWMLS as Distributed by MLS Grid
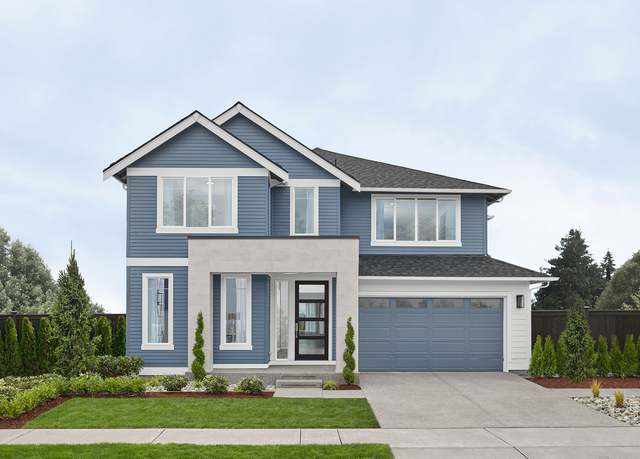
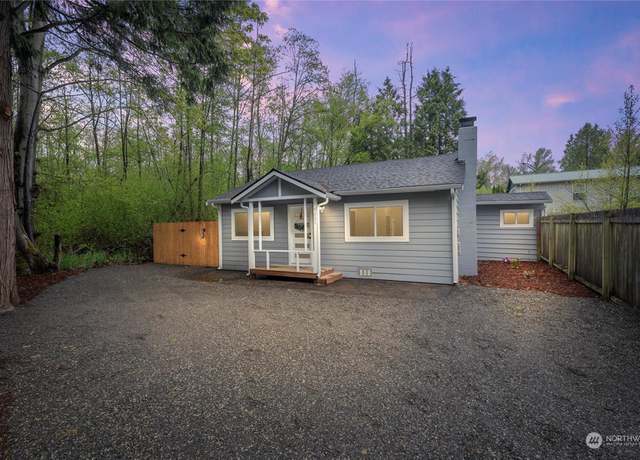
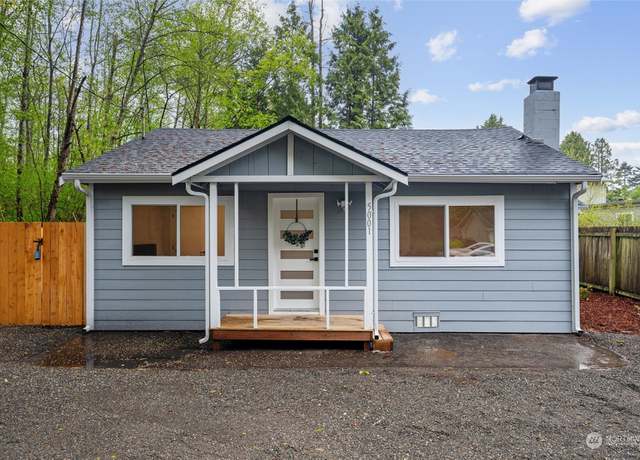
Welcome to this beautifully upgraded home in the heart of Birch Bay ! Too many upgrades to list ! Right around the corner from the beach. Home has been recently updated with whole new kitchen (including cabinets, slab counter, and SS appliances), flooring, fresh paint, and an expansive deck, perfect for outdoor living. 2 bedrooms / 1 bath. Less than a mile to the town of Birch Bay. Plenty of exterior space to park an RV for your vacationing friends and family who will definitely want to visit ! Welcome to your Birch Bay Beach Getaway!
1/27
$399,999
2 beds1 bath772 sq ft4,356 sq ft (lot)
5001 Cedar St, Blaine, WA 98230
Listing provided by NWMLS as Distributed by MLS Grid
Darling Birch Bay condo, this two bedroom two bath home sits right on a greenbelt with fantastic outdoor space in front of the unit and a private back yard. The updated interior features new flooring, carpet appliances, paint and more. Outside the deck has been upgraded to trex and its near the community pool. This well run great condo complex has is quiet and also has private beach access for you to enjoy all the waterfront activities.
$349,000
2 beds1.5 baths962 sq ft
7650 Birch Bay Dr Unit M7, Blaine, WA 98230
Listing provided by NWMLS as Distributed by MLS Grid
Discover your own coastal haven in this enchanting retreat, a mere stroll from sandy shores and endless sunsets. This delightful 3-bed, 2.5-bath home boasts vaulted ceilings, an open floor plan with a spacious kitchen perfect for culinary adventures, while the views create the perfect backdrop for gatherings. Unwind on the private patio watching sunsets and feeling the sea breeze blowing through on warm, beautiful summers. Located in the Birch Bay neighborhood, with dining, walking trails, shops, and a 15-minute drive from the Canadian border and 20 minutes to Bellingham. Live permanently or share the glory as a short-term rental.
$549,900
3 beds2.5 baths1,742 sq ft3,049 sq ft (lot)
4824 Willow Dr, Blaine, WA 98230
Listing provided by NWMLS as Distributed by MLS Grid
Unique Opportunity to enjoy Coastal living in a dream location with partial ocean views and a 5 min walk to the beach! This 2 bedroom, 1 bath home is located on a quiet Cul-de-sac and on a spacious lot backing on to a green space. Vaulted ceilings and large sun filled windows make the interior bright and inviting. Extra Large Patio with plenty of room for outdoor dining, sunny days and relaxing evenings. Separate spacious laundry room with sink and plenty of storage. Brand new roof, gutters, down spouts and skylights installed in March 2024.
$498,000
2 beds1 bath960 sq ft7,405 sq ft (lot)
5086 Fern St, Birch Bay, WA 98230
Listing provided by NWMLS as Distributed by MLS Grid
Discover unparalleled coastal living! This uniquely situated home enjoys 100' of exceptional low-bank waterfront and panoramic views, including majestic Mount Baker, Birch Bay, and the San Juan Islands. Within the gated Birch Bay Village, walk next door to a quiet park/playground and marina. An active clubhouse, pool, and private golf course are just a bike ride down the lane. The ground floor sports 2 garages, 2 bedrooms, hobby room, and an open-plan lounge/dining/gourmet kitchen. Upstairs boasts a master suite, 4th bedroom, and private rooftop deck. The solarium and spacious outdoor areas are perfect for entertaining or enjoying the serene surroundings. With a few stairs leading to the be
$1,628,000
5 beds3 baths3,187 sq ft9,729 sq ft (lot)
5585 Haida Way, Blaine, WA 98230
Listing provided by NWMLS as Distributed by MLS Grid
Experience epic fun at Grand Bay condos beach! Vibrant seaside-style resort life w/ in golf cart zone life with Birch Bay restaurants, Beach Cat Brewery, library, parks. Full time or second home. 2nd floor condo w/ elevator outside entry w/ south-facing balcony & partial water view. Fully turnkey. Stylish finishes, radiant floor heat in baths. 1,023 SF, 2 BR, 2 full BA. Built 2010. On site amenities- community hot tub, storage for kayaks, paddleboards & bikes. Association owns grass field by mouth of Terrell Creek & beach rights, firepits in front. 2 pets OK. Dues inc. maintenance, insurance, garbage. Beach "berm" in front w/ 1.5 mile of level surface. Small boat
$545,000
2 beds2 baths1,023 sq ft
7714 Birch Bay Dr #212, Birch Bay, WA 98230
Listing provided by NWMLS as Distributed by MLS Grid
Step into your contemporary craftsman surrounded by 5 acres of natural beauty! As you enter, the sleek concrete floors, open living/dining space, fireplace, & exposed beams create touch of elegance. Stunning kitchen w/ unlimited storage. Primary on main w/ walk-in closet, ensuite bath & private. Main floor office/gym opens to yard. Upstairs has flex space + 2 beds/full bath & HUGE bonus room. Outside on the covered patio, soak in the tranquility of deer/eagle sightings & your own stream!. Enjoy the firepit or indulge in the spa like sauna for ultimate relaxation. Located just minutes from the Canadian border & less than 2 hours from Seattle, this residence offe
$1,449,000
3 beds2.5 baths3,026 sq ft5.01 acres (lot)
6040 Birch Point Rd, Blaine, WA 98230
Listing provided by NWMLS as Distributed by MLS Grid
Charming 1 bed 1 bath manufactured home with stunning ocean views and a walk easement leading down to the beach. No HOA fees make this property an ideal investment for Airbnb-style rentals or a fixer-upper project. The potential for summer rentals is endless, making this a lucrative opportunity for any buyer looking to capitalize on coastal living. Don't miss out on this hidden gem with unlimited potential - a great investment opportunity awaits!
$360,000
1 bed1 bath922 sq ft4,578 sq ft (lot)
5135 Seaview Dr, Blaine, WA 98230
Listing provided by NWMLS as Distributed by MLS Grid
THE EPITOME OF COASTAL BEACHFRONT LUXURY! This highly detailed contemporary waterfront custom home with an inspiring design, immerses you in a world of breathtaking ocean views of the San Juan & Gulf islands. Tucked away at the end of a quiet lane & only steps from your privately owned beach, this home is truly extraordinary. Hear the sounds & smells of the ocean with open walls of folding glass from a massive great room, a penthouse primary suite, plus 3 additional bedrooms with ensuite baths. Other features include, 2,500 sqft of decks & patios flooded with sun & a detached 3 car garage. A stone’s throw from Semiahmoo resort & two world class golf
$2,995,000
4 beds4.5 baths3,858 sq ft2.30 acres (lot)
8823 Oertel Dr, Blaine, WA 98230
Listing provided by NWMLS as Distributed by MLS Grid
BIRCH BAY VILLAGE - A year round gated community located near the shallow beaches of Birch Bay along the Strait of Georgia. The development includes a sheltered Maria with access to the San Juan Islands and the Puget Sound coast line. A community golf course, swimming pool, club house, tennis court, waterfront parks and much more. The house has a fenced back yard for privacy, a firepit and large patio for weekend barbecues. Large living room area with a wood fireplace, kitchen with area dinning room, 3 bedrooms and 1 and a half baths. New gas furnace recently installed, cement plank siding and vinyl windows.
$510,000
3 beds1.5 baths1,344 sq ft0.23 acre (lot)
8058 Kispiox Rd, Birch Bay, WA 98230
Listing provided by NWMLS as Distributed by MLS Grid
Step into the future of stylish living w/ this chic, updated home designed for today’s buyers. The layout features a main-level bedroom. Embrace the luxury plank vinyl floors and custom window treatments that perfectly complement your urban aesthetic. Enjoy sunset views from the 2nd story balcony and access to Birch Bay waterfront trails and restaurants, a gated community that speaks to your active lifestyle. Kick back on the covered front porch, shoot some hoops or host gatherings on the back patio. Enjoy the drop zone mudroom off the garage, and swoon over the modernized bthrms and kitchen with a masculine edge and detail. Seize the opportunity to own this uniquely stylish home that
$615,000
3 beds2 baths1,616 sq ft6,098 sq ft (lot)
4754 N Golf Course Dr, Blaine, WA 98230
Listing provided by NWMLS as Distributed by MLS Grid
Ground level Condo, Great VRBO! Garden level (Salt Spring) unit at Jacob's Landing. West facing, 1 bedroom, 1 bath - only moments from the beach, and is surrounded by the beautifully landscaped grounds of Jacob's Landing. Features include new laminate wood flooring, all furnishings and appliances stay. Enjoy all the amenities Jacob's Landing has to offer: Indoor heated pool, hot tub, tennis court, great beach access, and much more. Area features hard sand tide flats, fantastic beach, great crabbing & clamming! 1 hour to Mt Baker ski slopes and hiking trails!
$340,000
1 bed1 bath630 sq ft
7806 Birch Bay Dr #303, Birch Bay, WA 98230
Listing provided by NWMLS as Distributed by MLS Grid
Experience breathtaking sunset vistas over Birch Bay from the exquisite Terrell Creek Landing condominiums! Securely nestled within a well-appointed building, this top-floor unit boasts convenient elevator access directly from the lobby. Step inside to discover an inviting open layout, highlighted by a gourmet kitchen adorned with granite countertops, a gas range, and stainless steel fridge. The kitchen effortlessly flows into a breakfast bar and a separate dining area, perfect for entertaining guests. Unwind in the cozy living room, complete with a gas fireplace, before stepping out onto the covered deck to savor the panoramic view. With two bedrooms and two full bathrooms, this residence
$429,000
2 beds2 baths1,065 sq ft
4823 Alderson Rd #306, Blaine, WA 98230
Listing provided by NWMLS as Distributed by MLS Grid
RARE DOUBLE LOT adjacent to each other, This home packs so much into 394 sq feet and comes mostly furnished. With walking distance to the cabana and outdoor pool. Walk onto the the large deck with large sitting area. The living room and kitchen are well equipped to make watching tv relaxing and fixing your favorite meal. White fridge and beautiful hood. 2 Large garden shed. Propane furnace, electric fireplace. You do not want to miss out on this fantastic home, located in a back corner with some privacy. Fridge is about 1 yr old.
$149,900
1 bed1 bath391 sq ft1,404 sq ft (lot)
4980 Morgan Dr Unit 16-17, Blaine, WA 98230
Listing provided by NWMLS as Distributed by MLS Grid
ENJOY ISLAND LIVING WITHOUT THE FERRY! Experience spectacular sun filled southerly views of the San Juan and Gulf Islands, Strait of Georgia, and the Olympic Mountains. An iconic mid-century modern architectural statement situated on a beachfront 3/4 acre, and on a quiet non through lane. A classic original one level, but tastefully updated inside and out including a large deck and patio for dining alfresco. An extremely private and quiet location for memorable campfires and walks on the beach, while you watch whales, seals, eagles, and boats of all sizes pass by. Only minutes from Semiahmoo Resort which offers excellent dining, world class golf, and a large marina with slips available to p
$1,250,000
3 beds2 baths1,580 sq ft0.75 acre (lot)
5537 Maple Way, Blaine, WA 98230
Listing provided by NWMLS as Distributed by MLS Grid
Remarkable Latitude 49 is the premier Birch Bay gated, all ages community. 365 days/year, beach-chic turnkey home can become a full-time or vacation residence. #266 is centrally located near the clubhouse & pool. Superbly maintained & stylish manu home is 565 SF, has 2 BR & 1 full BA built in 1998. Lots of windows & fully furnished w/ a spacious & sunny deck. A solid outbuilding behind the home has also been used for overnights. Latitude 49 has outdoor pool (new reno!), clubhouse, exercise room, athletic courts, & more. Near all the fun of Birch Bay beaches, less than five minutes away - sandy beaches, swimming, low tides, paddleboarding, clamming, crabbi
$300,000
2 beds1 bath565 sq ft3,240 sq ft (lot)
4751 Birch Bay Lynden Rd #266, Birch Bay, WA 98230
Listing provided by NWMLS as Distributed by MLS Grid
Well cared-for home in Birch Bay Village, 24/7 security with golf course, pool, pickleball, tennis courts and a private marina, see BBV website. Energy efficiency provided by new ductless HP, new instant hot water heater, hot water tank, & new windows throughout. Living room features a cozy wood-burning fireplace & dining room includes built-ins, nice family room adjacent to kitchen is equipped w/ free-standing propane fireplace. Both the primary bedrm & second bedrm come complete with ensuite bthrms. Step outside to a spacious covered front deck, freshly painted exterior & new gutters! Metal roof on home, shed, golf cart garage. Sunny, corner lot, located on a quiet
$385,000
2 beds2 baths1,416 sq ft7,405 sq ft (lot)
5768 Salish Rd, Blaine, WA 98230
Listing provided by NWMLS as Distributed by MLS Grid
Welcome to your very own Birch Bay getaway! Live here year roundhouse, use it as your own personal vacation home or as a vacation rental. The opportunities are endless. This incredible open concept home has beach rights, lots of natural light, views of the bay and features 2 bedrooms, 1 bath, a great sun room and a detached heated garage ready to finish your own way. It is currently plumbed with a half bath and new windows throughout. The paved driveway has ample parking and a RV waste hook up, convenient for your out of town guests.
$480,000
2 beds1.5 baths924 sq ft4,792 sq ft (lot)
7458 Sunset Dr, Blaine, WA 98230
Listing provided by NWMLS as Distributed by MLS Grid
Experience country living at its finest in this 1700 plus square foot home nestled on just over 11 acres! Step into a warm modern updated living space with the finest finishes featuring 3 beds, 2 full baths, new kitchen, wood burning fireplace, new roof, a/c heat pump, waterproof LVP flooring, and much more. The large paved driveway has lots of parking including an RV parking area w/ 50 amp power and water/sewer hook up. Plenty of room to build your shop. Acreage contains a conservation easement. Enjoy the outside from a concrete patio with a fully fenced space. Your dream home awaits!
$649,000
3 beds2 baths1,710 sq ft11.01 acres (lot)
7859 Kickerville Rd, Blaine, WA 98230
Listing provided by NWMLS as Distributed by MLS Grid
Affordable saltwater view condo with a just-completed 2023 remodel. New kitchen, bathrooms, and interior remodeling. Enjoy ocean views from primary, living room, and kitchen. Access to gated beach, including paddle board/kayak storage. Steps to in-ground pool, and close parking. Ample attic storage. HOA $325/month includes: water, sewer, garbage, flood insurance, snow removal & exterior maintenance. Rental potential of $1975/month or more (3 month minimum rental). With ocean views, modern upgrades, and unbeatable location, this condo offers a seaside lifestyle, or great investment potential. This condo checks all the boxes.
$359,000
2 beds1.5 baths840 sq ft
7650 Birch Bay Dr Unit S2, Blaine, WA 98230
Listing provided by NWMLS as Distributed by MLS Grid
Sought after 55+ retirement park in Birch Bay with extremely affordable monthly expenses. In addition, when you buy this home you will be assessed a one time $500 HOA membership fee that will make you 1/18th owner of the park. This newly remodeled 1994 mfg. home boasts 1593 sq. ft. featuring 3 bedrooms, 1.75 baths, all new stainless appliances, granite countertops, vaulted ceilings, skylights, walk-in closet and more. It is all-electric with forced air furnace for heat and a mini-split for heating and cooling. This home is in pristine condition with a beautifully landscaped exterior. Located at the end of a cul-de-sac, you will find a quiet, peaceful setting with ample parking for visitors
$449,000
3 beds2 baths1,593 sq ft9,450 sq ft (lot)
8370 Harborview Rd #18, Blaine, WA 98230
Listing provided by NWMLS as Distributed by MLS Grid
Beautiful like-new home, built in 2019 w/ many upgrades. The open great room concept welcomes you in with vaulted ceilings, cozy gas fireplace & hard surface floors thru the entry, great room, kitchen & dining area. The light, bright & very open kitchen design has self-closing slide out drawers, a full size pantry cabinet, island sink and all upgraded LG appliances stay! (yes, even the Washer/Dryer stay). The main floor Primary bedroom's MASSIVE walk-in closet & storage cubby are HUGE, and the walk-in tile shower is impressive. Upper floor has (2) additional bedrooms, a full bath plus a bonus room! All this in an affordable gated community for privacy & securit
$789,700
3 beds2.5 baths2,144 sq ft4,955 sq ft (lot)
9054 Sea Mist Ln, Blaine, WA 98230
Listing provided by NWMLS as Distributed by MLS Grid
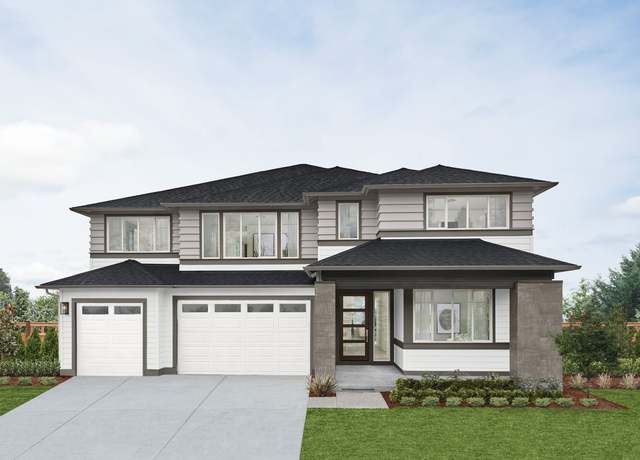
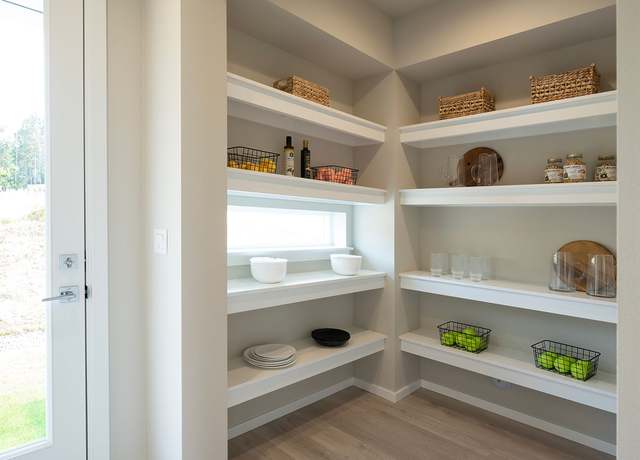
The Baylor Model Home is released to sell at Horizon at Semiahmoo! Main floor has guest suite with adjacent bath, a gourmet kitchen w/ refrigerator, large island and walk-in-pantry. Great room has a gas fireplace and a large bank of South-facing windows. Dining area has huge slider that opens onto a covered patio. Upstairs is the lavish primary suite that boasts a private covered deck, ensuite with dual vanities and a walk-in closet. 3 secondary bedrooms, a generous bonus room, full bath, and laundry room with cabinets, and washer and dryer complete the level. 2-bay garage with room for storage! Registration policy: Buyer Broker must accompany and personally register buyer at first visit.
$799,990
5 beds3 baths2,678 sq ft8,403 sq ft (lot)
5434 Lasiandra Dr #59, Blaine, WA 98230
Listing provided by NWMLS as Distributed by MLS Grid
Fabulous ocean views from this medium bank beachfront 3416 sf home in one of Birch Bay's most coveted neighborhoods. Main level has a living room, dining, primary bdrm, and deck highlighting ocean, mountain & sunsets. Impeccably built with hickory engineered hardwood flooring, large kitchen w/ beautiful cherry cabinets, granite island, custom pantry, tiled primary ensuite & large walk-in closet with built-ins. Outstanding details w/ vaulted ceilings, radiant in-floor heat & tons of storage. Spacious, finished, lower, daylight basement with outside entry, patio area, plus ocean view. Upper unfinished bonus room with lots of storage or possible 4th bedroom. Don't miss this c
$1,195,000
3 beds3 baths3,792 sq ft4,792 sq ft (lot)
6957 Birch Bay Dr, Blaine, WA 98230
Listing provided by NWMLS as Distributed by MLS Grid
Owner contract opportunity! Shy acre with a fixer single-wide MFH at the end of the road. Good Sized Shop with covered lean-to parking on each end. Close to Birch Bay, Blaine and California Creek. Lots of nice trees. Big down payment and a short term contract. This is a sweat equity opportunity, or owner will clean up before closing!
$199,900
2 beds2 baths924 sq ft0.89 acre (lot)
8579 East Rd, Blaine, WA 98230
Listing provided by NWMLS as Distributed by MLS Grid
Bay and Mountian View from your large deck where you can watch the sunrise and set in peace as you relax in your 3 bedroom 2.5 bathroom modern home with a wall of windows to let in lots of light and such a great view. This home has been used as an air B & B and has made a profit just from the summer months. This home would make a great vacation home, vacation rental, or permanent home! Across the street is public beach access so you can just walk to the beach and home. as you enter from the street level you will still have a view from your lower living room, with 2 rooms on the main with a bathroom & laundry, the upper floor has the new kitchen with all the appliances staying. mos
$860,000
3 beds2.5 baths1,982 sq ft4,792 sq ft (lot)
7444 Jackson Rd, Blaine, WA 98230
Listing provided by NWMLS as Distributed by MLS Grid
Birch Bay life all year! Superbly remodeled/landscaped, feels new manu home in Edgewater Resort - 576 SF, 2BR, 1 full BA. Park directly across street from beach w/ unforgettable sunsets. New electrical panel & system installed 2023. Grass field in front for recreation w/ no plans for development. Interior of home has been stylishly updated-windows, LVP floors, paint, cabinets, tiling, lighting, hot water tank, more. Large covered deck on side for year 'round outdoor living. Gas BBQs allowed. Lots of room on sides. Greenbelt in back & patio w/ new shed. No short term rentals. Stacking washer/dryer hookups in home. New TPO roof 2019. Sprinklers on timer, WIFI thermostat, security
$125,500
2 beds1 bath576 sq ft
7954 Birch Bay Dr #22, Birch Bay, WA 98230
Listing provided by NWMLS as Distributed by MLS Grid
Indulge in the epitome of luxury at this remarkable Semiahmoo Bay custom home, where breathtaking sound views greet you at every turn. From the expansive decks offering panoramic vistas, to the remarkable great room capturing the essence of sunset hues, each corner exudes opulence. The master suite boasts a cozy fireplace and lavishly tiled bath with a jetted soaking tub, ensuring moments of pure relaxation. Venture downstairs to discover a fully-equipped 2-bed apartment boasting captivating views. Outside, a tranquil jacuzzi awaits alongside private beach access, enhancing the experience. Secure your slice of Semiahmoo Bay paradise and embrace the allure of this income-producing estate, wh
$1,450,000
3 beds3.5 baths5,426 sq ft0.67 acre (lot)
5913 Normar Pl, Blaine, WA 98230
Listing provided by NWMLS as Distributed by MLS Grid
Unparalleled 180 degree vistas of the bay, islands, & mountains. Discover a charming & updated retreat plus private beach. Complete renovation was done inside and out over the past 12 years. Recent upgrades include new roofing, AC, fencing, decks, dual view enhancing sliding doors, thoughtful landscaping & enhanced drainage. Presently flourishing as a sought-after short-term rental, this property equally lends itself to year-round residency. Relish awe-inspiring sunsets & seamlessly host gatherings for friends and loved ones, thanks to ample parking and garage. Large lot size offers potential to substantially increase floor space. Enjoy all that Birch Bay has to offer
$899,000
2 beds2 baths1,440 sq ft0.26 acre (lot)
6887 Holeman Ave, Blaine, WA 98230
Listing provided by NWMLS as Distributed by MLS Grid
Custom built home with attention to detail everywhere you look. Southern exposure for passive heat and wonderful views. Trex decks with log accents. Hot tub, sauna and prewired diesel generator with 14 day supply of fuel. Full security system on all exterior doors with motion detection on both floors. Garage and shop are heated and fully insulated with 5/8" drywall. 40 amp outlet for car charger available. Pool table and TV's stay. Experience this one of a kind gated community offering a 9 hole executive style golf course, marina, pool, clubhouse, pickleball and tennis courts, saltwater parks and beaches, 2 man made lakes and quiet private roads.
$699,000
5 beds3 baths2,616 sq ft0.25 acre (lot)
5450 Salish Rd, Blaine, WA 98230
Listing provided by NWMLS as Distributed by MLS Grid
Let your imagination run wild as you picture yourself living in this Wonderful Birch Bay Waterfront Home. The home is a bit of a "Swiss Army Knife Home" with Multiple Living/Dining/Cooking/Bathing/Sleeping/Relaxing/Parking Spaces - this home will accommodate a variety of Buyers. Spacious 4 Bedroom, 3 Bath Home, 3 Living Spaces, 3 Kitchen Areas, Decks, Patios, Attached & Oversized 1 and 2-Car Garages & Beach Access. Well thought-out floor plan, Excellent use of space -Great Finishes. Nestled on the Southern edge of the warm sands of Birch Bay on Point Whitehorn, this location provides plenty of opportunity to enjoy Mother Nature's finest creations and ever-changing vie
$1,380,000
4 beds3 baths3,116 sq ft0.26 acre (lot)
6889 Holeman Ave, Birch Bay, WA 98230
Listing provided by NWMLS as Distributed by MLS Grid
Your cottage close to the Beach with 3 bedroom 2 bathroom home. beautiful woodwork thru out the home, vaulted ceilings, open floor plan. large kitchen with breakfast bar, large dinning area with short walk in pantry under the stairs. I bedroom on the main floor and full bathroom, 2 large rooms upstairs with access to your upper deck and access to the outside. Garage can be used as a bonus room or garage, garage has a fireplace and tile floor. Huge wrap around deck out front. 2 outbuildings, pond, room for a garden and fruit trees included. RV parking on the side of the house and lots of parking.
$599,000
3 beds2 baths1,686 sq ft8,758 sq ft (lot)
8415 Donald Way, Blaine, WA 98230
Listing provided by NWMLS as Distributed by MLS Grid
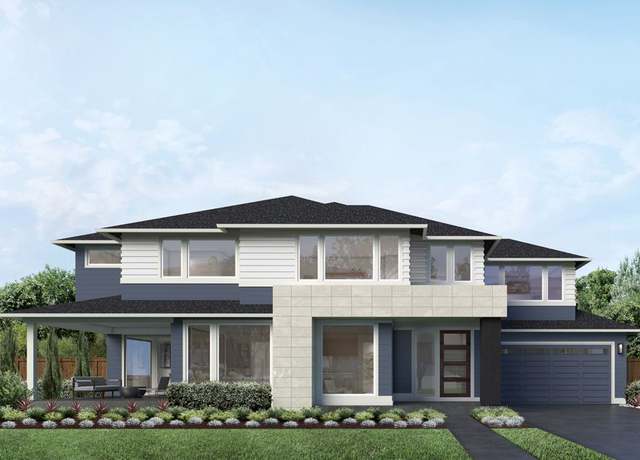
LAST CHANCE at a Century Communities home in Horizon at Semiahmoo! The Ellington's vaulted foyer has classic double-doored closet. The expansive great room and dining room has a huge slider to front covered deck and views! Primary suite on the main has slider to the front covered deck, a 5-piece ensuite, & roomy walk-in closet. Kitchen has walk-in pantry, large island, & door leading to a backyard covered patio. Laundry on main. Lower level: room with exterior entrance & full bath; 3-bay garage w/ space for workbench or storage. Upper floor: 2 bedrooms, full bath, & Bonus Room w/ covered balcony and views of Mt Baker and Salish Sea. Customer Registration Policy: Buyer B
$874,990
3 beds3.5 baths2,960 sq ft0.29 acre (lot)
5440 Lonicera Dr #35, Blaine, WA 98230
Listing provided by NWMLS as Distributed by MLS Grid
Discover this pristine well-maintained park model, in the popular beachfront community of Leisure Park. This will be the most reasonable vacation property you will find in Birch Bay, from location to amenities & low cost. The peaceful neighborhood features a clubhouse, tennis courts, a playground, and an outdoor pool. This park model comes fully furnished, Hida bed couch for guests, carpeted covered deck, and storage shed, facing east ensuring ample sunlight and spectacular sunrise views. Professional HOA w/ board members who live and love the community. Enjoy all that Birch Bay has to offer, beaches, clamming, crabbing, water slides, restaurants, or a walk on the berm located right a
$115,000
1 bed1 bath460 sq ft1,000 sq ft (lot)
7704 Birch Bay Dr Unit 49-4, Blaine, WA 98230
Listing provided by NWMLS as Distributed by MLS Grid
Based on information submitted to the MLS GRID as of Mon Apr 29 2024. All data is obtained from various sources and may not have been verified by broker or MLS GRID. Supplied Open House Information is subject to change without notice. All information should be independently reviewed and verified for accuracy. Properties may or may not be listed by the office/agent presenting the information. Some IDX listings have been excluded from this website.
School data is provided by GreatSchools, a nonprofit organization. Redfin recommends buyers and renters use GreatSchools information and ratings as a first step, and conduct their own investigation to determine their desired schools or school districts, including by contacting and visiting the schools themselves.Redfin does not endorse or guarantee this information. School service boundaries are intended to be used as a reference only; they may change and are not guaranteed to be accurate. To verify school enrollment eligibility, contact the school district directly.
Birch Bay, Washington, offers a tranquil and relaxed driving experience with generally low traffic levels. The region is well-connected with a network of local roads, making it convenient to navigate the area by car. While Birch Bay does not have its own public transportation system, there are nearby towns that do. Additionally, Birch Bay is in close proximity to Interstate 5, providing easy access to major cities and destinations. Learn more on our Birch Bay city guide.
What types of properties are available in Birch Bay?
Birch Bay, Washington offers a variety of single-family home types, including ranch-style homes, contemporary homes, and craftsman-style homes, among others. These homes can be found throughout the Birch Bay area, providing a range of options for potential buyers. Most properties in Birch Bay feature two to four bedrooms and were built within the past few decades. To explore different property types for sale in Birch Bay, Washington, use the 'Home type' filter located above the active listings. Customize your search by selecting options like single-family homes, condos, townhomes, and more.
What is life like in Birch Bay?
Birch Bay, Washington offers a serene and picturesque environment with its stunning landscape. The region experiences a mild climate, characterized by refreshing summers and mild winters. The area presents a range of job opportunities across various sectors, ensuring a diverse and thriving economy. Residents can engage in a multitude of recreational activities, such as exploring nature trails, enjoying water sports, and engaging in community events. Birch Bay is a vibrant community that fosters a sense of belonging and encourages residents to connect with one another through local gatherings and shared interests.
What are the schools and amenities like in Birch Bay?
Birch Bay, Washington offers a variety of public amenities for its residents. The town boasts a selection of restaurants, providing a range of culinary experiences. For outdoor enthusiasts, there is a well-maintained park, perfect for leisure and recreation. Daily necessities can be easily met with the presence of a local grocery store. Additionally, Birch Bay provides other essential amenities, ensuring a comfortable living environment for all its residents.
In the past month, 20 homes have been sold in Birch Bay. In addition to houses in Birch Bay, there were also 6 condos, 2 townhouses, and 1 multi-family unit for sale in Birch Bay last month. Find your dream home in Birch Bay using the tools above. Use filters to narrow your search by price, square feet, beds, and baths to find homes that fit your criteria. Our top-rated real estate agents in Birch Bay are local experts and are ready to answer your questions about properties, neighborhoods, schools, and the newest listings for sale in Birch Bay. Our Birch Bay real estate stats and trends will give you more information about home buying and selling trends in Birch Bay. If you're looking to sell your home in the Birch Bay area, our listing agents can help you get the best price. Redfin is redefining real estate and the home buying process in Birch Bay with industry-leading technology, full-service agents, and lower fees that provide a better value for Redfin buyers and sellers.


 REDFIN IS COMMITTED TO AND ABIDES BY THE FAIR HOUSING ACT AND EQUAL OPPORTUNITY ACT. READ REDFIN'S FAIR HOUSING POLICY AND THE NEW YORK STATE FAIR HOUSING NOTICE.
 United States
 Canada