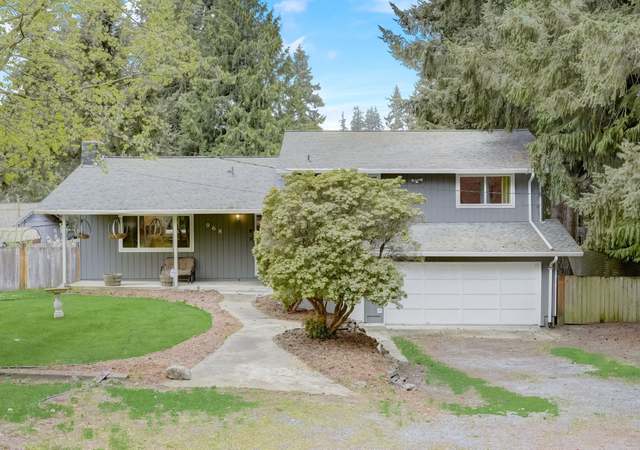
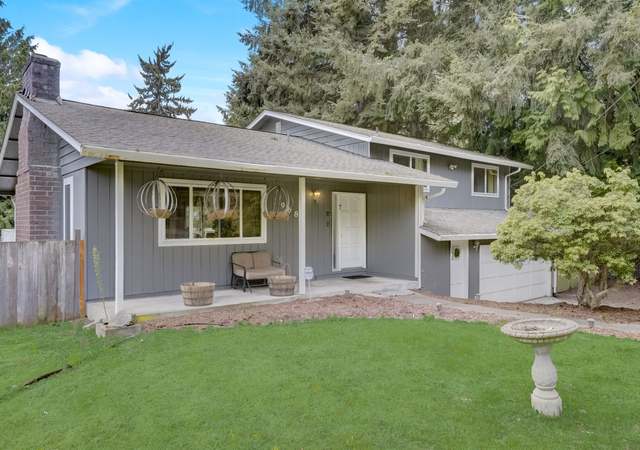
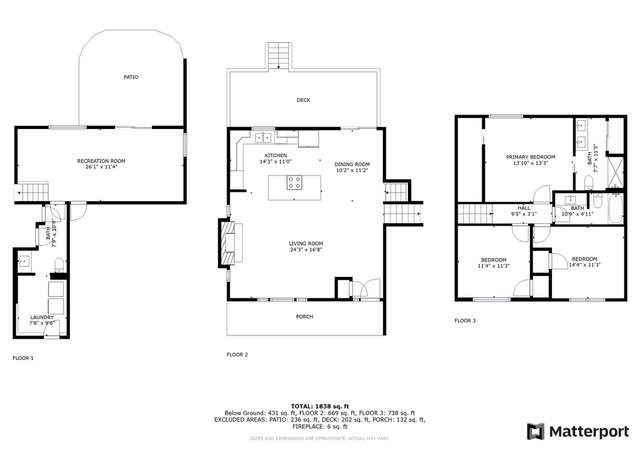
Welcome to this stunning tri-level home boasts 3 bedrooms and 2.5 bathrooms, offering ample space for comfort. Step into the inviting open-concept main floor living area, featuring a wood burning fireplace, beautifully remodeled kitchen with an island, counter seating, and stainless-steel appliances. Retreat to the luxurious primary bedroom complete with a full en-suite. Two additional bedrooms and a spacious rec room offers room to roam. Outside, the expansive back deck overlooks the large yard. Attached 2-car garage and plenty of parking available. Don't miss the opportunity to make this your forever home!
1/31
$549,950
3 beds2.5 baths1,806 sq ft0.33 acre (lot)
968 Brookdale Rd E, Tacoma, WA 98445
Listing provided by NWMLS as Distributed by MLS Grid
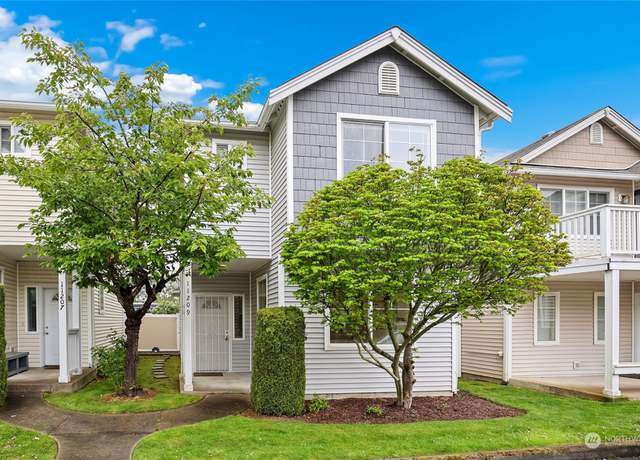
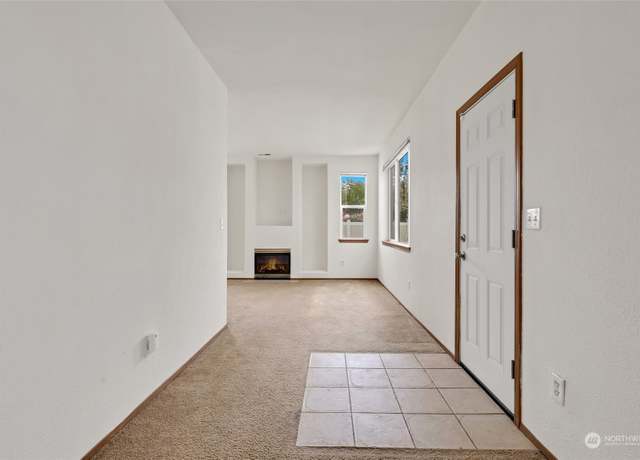
Welcome to this bright, move in ready townhome-style condo! Featuring gated access, a private 2 car garage, and a fenced backyard, this home is sure to please! Enter off of a charming front porch into the main floor with vaulted ceilings. You’ll find a spacious, open concept kitchen with dining room spilling into a cozy living room with gas fireplace. Upstairs, find 3 large bedrooms, including the primary suite with walk in closet! Home has been freshly painted and all appliances stay! HOA maintains the front yard! This tree-lined community has easy access and low HOA dues. Don’t miss out!
1/34
$420,000
3 beds2.5 baths1,490 sq ft3,045 sq ft (lot)
11209 3rd Avenue Ct E, Tacoma, WA 98445
Listing provided by NWMLS as Distributed by MLS Grid
Brand New EVERYTHING! Stunning 5 bedroom gem in the heart of Parkland renovated inside & out! This beautifully updated home w/ flowing floorplan will blow you away! Spacious light & bright main floor featuring primary bedroom & office w/ separate entry. Kitchen boasts gorgeous quartz countertops w/ eating bar, stainless steel appliances, & beautiful walnut hard wood thru-out. Large fully fenced . 28acre yard is ready for your imagination. Ample space for RV, additional parking, or oasis to be transformed into your private paradise! Nearby shopping, dining, bus lines & quick freeway access to 512/I-5. JBLM a short 10min drive & 3min walking distance to PLU;
1/30
$599,999
5 beds3 baths1,958 sq ft0.29 acre (lot)
313 119th St S, Tacoma, WA 98444
Listing provided by NWMLS as Distributed by MLS Grid
Welcome Home! This home is bigger than it looks . Lots of storage and room in this home. This charming 1,290 sq. ft. home is ready for you to move into. Your kitchen is up to date with granite counter tops. main bedroom upstairs. This home is conveniently located minutes from 512 & I-5, PLU, JBLM, shopping centers, schools and restaurants. Plenty of parking and carport with partially fenced back yard.
1/21
$379,000
2 beds2 baths1,290 sq ft7,500 sq ft (lot)
910 Lafayette St S, Parkland, WA 98444
Listing provided by NWMLS as Distributed by MLS Grid
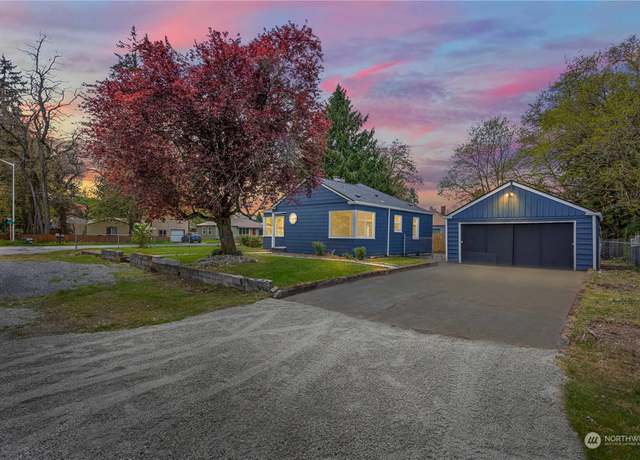
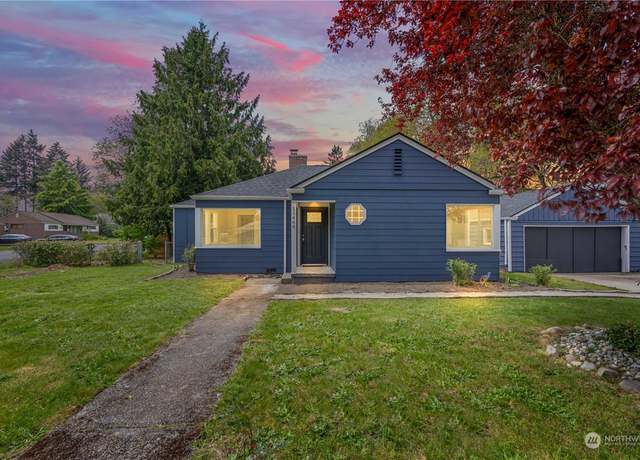
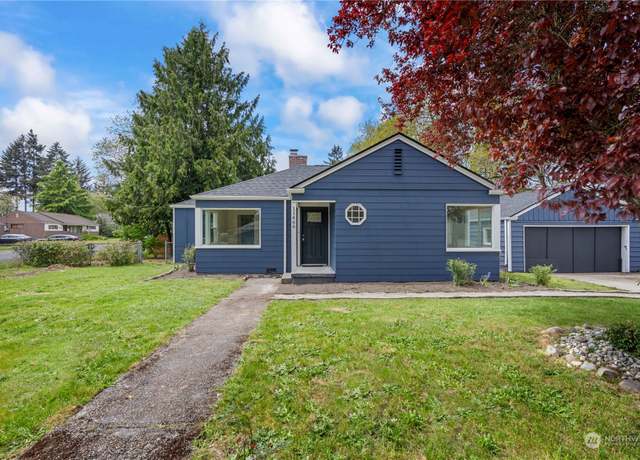
Welcome to timeless charm in this updated 3-bed, 1-bath Tacoma residence! Bask in natural light highlighting the classic features, including a cozy wood-burning fireplace. The kitchen boasts new appliances, quartz countertops, and flows seamlessly into the living space. Revel in updated flooring and a refreshed bath. Fresh paint graces both interior and exterior. A huge garage/shop offers ample storage or workspace. With a new 30-year roof on both buildings, durability is assured. Outside, a large fully fenced level lot on a quiet street invites outdoor enjoyment. Experience the perfect blend of classic elegance and modern convenience in this Tacoma treasure!
1/23
$410,000
3 beds1 bath968 sq ft8,785 sq ft (lot)
11466 8th Avenue Ct S, Tacoma, WA 98444
Listing provided by NWMLS as Distributed by MLS Grid
Adorable craftsman situated on . 3-acre lot with HUGE detached 3 car garage! This beautifully maintained home offers freshly painted interior, custom blinds, & newer carpet! Bright living/family room W/ FP. Eat-in kitchen W/ barstool seating & SS apps. including double oven that STAY. 2 bdrms, full bath & 1/2 bath on main. Upper-level primary W/ vaulted ceilings, private deck, WI closet, & bath. Attic offers storage OR potential to be converted into addtl. living space! Private yard W/ professional landscaping & relaxing patio W/ water feature & gazebo. Garden shed & playhouse! Gravel bonfire pit area. Awning on side of gar. & shop on back of gar
1/29
$549,500
4 beds2.5 baths2,762 sq ft0.33 acre (lot)
404 133rd St E, Tacoma, WA 98445
Listing provided by NWMLS as Distributed by MLS Grid
Nice 1-story remodeled home in Tacoma. Newer Hardie plank siding, new roof, big 480 sf two car garage, fully fenced and RV/boat parking. Other features include bright open floor plan, recessed lighting, new kitchen cabinets, new quartz counter tops, new stainless steel appliances, new LPV flooring, painted millwork & doors, new lighting & plumbing fixtures and new hot water tank. Close to freeways, Bases, schools, shopping, restaurants, parks and Pacific Lutheran University.
1/26
$389,950
2 beds1 bath736 sq ft5,000 sq ft (lot)
1302 117th St S, Tacoma, WA 98444
Listing provided by NWMLS as Distributed by MLS Grid
Welcome home to historic charm and modern comfort! Situated perfectly on a large corner lot, this remodeled home has the perfect blend of charm and sophistication, offering a lifestyle of comfort and convenience in every detail. Recent upgrades of newer windows, roof, large deck and more will offer peace of mind. The fully fenced private backyard and detached garage ensures room for your hobbies, gardening, outdoor living and extra parking. The previously updated kitchen, included appliances, and easy to maintain terraced yard makes this property perfect for a first time home buyer or anyone looking for a place to call home! An open concept kitchen and beautiful design touches makes easy en
1/29
$360,000
2 beds1 bath754 sq ft9,290 sq ft (lot)
722 104th St S, Tacoma, WA 98444
Listing provided by NWMLS as Distributed by MLS Grid
Step into the enchanting embrace of this charming farmhouse, nestled in the heart of Brookdale. Freshly painted and meticulously maintained, every corner exudes warmth and character, beckoning you to explore its timeless appeal. The original wood floors whisper stories of days gone by, while elegant arches add a touch of sophistication to the inviting interior. The main floor welcomes you with open arms, featuring a conveniently located primary bedroom and an additional bedroom for guests. Upstairs, two delightful rooms await, offering versatility and storage aplenty for your unique needs. A new furnace ensures comfort year-round, while the home's proximity to JBLM, freeways, and local amen
1/36
$425,000
3 beds1 bath1,310 sq ft8,276 sq ft (lot)
415 138th St E, Tacoma, WA 98445
Listing provided by NWMLS as Distributed by MLS Grid
Welcome to this charming 4-bedroom rambler in Tacoma! Featuring stainless steel appliances, granite countertops & custom tiling. A brand new ductless mini-split & furnace installed in 2023. The backyard offers a child's play structure, built-in trampoline, a fully fenced yard, and a large cabana. The garage has been converted into a fourth bedroom but can easily be converted back if wanted. Great storage throughout & RV parking with hookups! All appliances stay. Conveniently located near schools, parks, and shopping. Don't miss out on this fantastic home! Reviewing offers Monday 5/6/2024.
1/16
$425,000
4 beds2 baths1,409 sq ft7,802 sq ft (lot)
762 110th St S, Tacoma, WA 98444
Listing provided by NWMLS as Distributed by MLS Grid
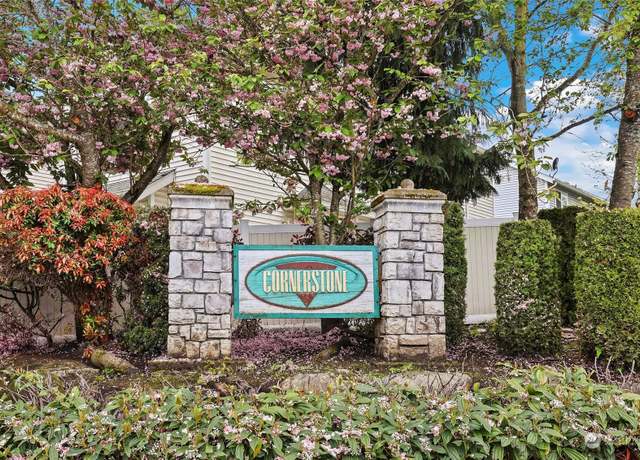
Discover the allure of this exquisite 4-bedroom residence nestled in the heart of Village Commons, a secure gated community. With its prime location near PLU, JBLM, and convenient freeway access, this home offers the ultimate commuter's paradise. Embrace the serenity of a fully fenced backyard that seamlessly blends into a picturesque Greenbelt, offering expansive views without the hassle of a lot of yard maintenance. Entertain effortlessly on the charming patio, ideal for summer gatherings and cookouts. Luxurious upgrades include laminate flooring throughout the lower level and primary bedroom. Plus, enjoy exclusive access to the community clubhouse and playground.
1/14
$449,900
4 beds2.5 baths1,472 sq ft1,939 sq ft (lot)
11525 7th Avenue Ct E, Tacoma, WA 98445
Listing provided by NWMLS as Distributed by MLS Grid
Welcome to Trails End at Brookdale an Ichijo USA community. The Tavira floor plan, Homesite 22, 2449 sqft, 3 bed, 2.5 bath home. Walk-in Pantry. Bonus room upstairs. Large Primary bedrm with tray ceiling and 5 piece bathroom. Walk-in closet. Covered patio. Personalize your home by choosing all your hard surfaces at the Design Studio. Ichijo buyer surveys continue to indicate Quality as the reason for choosing Ichijo, including: Tastefully designed contemporary exteriors, Piano Finish Cabinetry, Unique Interior Doors, and much more. Community will have its own Clubhouse with outdoor pool, parks and play areas. Visit Model at-1401 137th Dt E, Tacoma, WA 98445. If represented by a broker, brok
1/25
$612,990
3 beds2.5 baths2,449 sq ft5,531 sq ft (lot)
1528 137th St E #22, Tacoma, WA 98445
Listing provided by NWMLS as Distributed by MLS Grid
Welcome to Trails End at Brookdale an Ichijo USA community. The Verona floor plan, Homesite 16, 3 bed, 2.5 bath home, 2507 sqft, Large Primary Bedroom on the Main with tray ceiling and 5 piece bathroom. Walk-in closet. Open concept living. Walk-in Pantry. Utility Room on the Main, Den/office. Bonus room, full bath and 2 large bedrooms upstairs. Covered patio. Personalize your home and choose all your hard surfaces at the Design Studio. Tastefully designed contemporary exteriors, Piano Finish Cabinetry, Unique Interior Doors, and much more. Community will have its own Clubhouse with outdoor pool, parks and play areas. Visit Model at-1401 137th Dt E, Tacoma, WA 98445. If represented by a brok
1/30
$624,990
3 beds2.5 baths2,507 sq ft5,564 sq ft (lot)
1509 137th St E #16, Tacoma, WA 98445
Listing provided by NWMLS as Distributed by MLS Grid
Welcome to Trails End at Brookdale an Ichijo USA community. The Chamonix floor plan, Homesite 18, 5 bed, 2 3/4 bath home, 2823 sqft, including a Bedrm and 3/4 bath on main floor, Walk-in Pantry. Bonus room upstairs. Large Primary bedroom with tray ceiling and 5 piece bathrm, 2 walk-in closets. Covered patio. Personalize your home and choose all your hard surfaces at the Design Studio. Tastefully designed contemporary exteriors, Piano Finish Cabinetry, Unique Interior Doors, and much more. Community will have its own Clubhouse with outdoor pool, parks and play areas. Visit Model at-1401 137th Dt E, Tacoma, WA 98445. If represented by a broker, broker must accompany & register at 1st vi
1/28
$689,990
5 beds3 baths2,823 sq ft5,810 sq ft (lot)
1517 137th St E #18, Tacoma, WA 98445
Listing provided by NWMLS as Distributed by MLS Grid
Step into this charming house within walking distance of PLU! With a fully-fenced yard, perfect for gardening, unwinding in your hammock, or playing fetch with your pup. As the new owner, you get to enjoy the benefits of a new roof, fresh paint, an updated kitchen, and newer windows. Plus, a detached two-car garage with additional parking for an RV or boat. Explore the spacious crawl space, ideal for a wine cellar or future finished space. This fantastic home offers excellent walkability to amenities and transportation. No HOA!
1/20
$437,500
3 beds1 bath1,038 sq ft7,500 sq ft (lot)
621 129th St S, Tacoma, WA 98444
Listing provided by NWMLS as Distributed by MLS Grid
Step into this charming Tacoma rambler on large fully fenced corner lot, offering 3 spacious bedrooms, 2 bathrooms, & a detached garage perfect for your hobbies! As you enter, you'll be welcomed by a warm living space that effortlessly transitions into a dining area & kitchen, renovated in 2016 for easy entertaining. The primary suite features a full bathroom & a striking wood-burning fireplace. The additional bedrooms offer generous closet space & abundant natural light. A sizable laundry room leads to the backyard, where you can relax on the paved patio for more parking, outdoor dining & admire the newly planted fruit trees. New roof & flooring installed
1/27
$399,900
3 beds2 baths1,056 sq ft8,350 sq ft (lot)
10115 Ainsworth Ave S, Tacoma, WA 98444
Listing provided by NWMLS as Distributed by MLS Grid
Welcome to this charming, one-story home just a block away from Pacific Lutheran University! Perfectly situated for convenience, this delightful property offers 3 bedrooms, 1.5 baths, and brand new flooring throughout. Ideal as an investment rental, it features ample parking and is within walking distance to PLU, shops, and bus lines. Additionally, its proximity to the military JBLM base makes it an excellent choice for service members seeking a short commute. Enjoy peace of mind with a brand new 2024 hot water heater and furnace, ensuring comfort and efficiency for years to come. Don’t miss out on this excellent opportunity!
1/32
$419,999
3 beds1.5 baths1,118 sq ft7,500 sq ft (lot)
11915 C St S, Tacoma, WA 98444
Listing provided by NWMLS as Distributed by MLS Grid
What a great place to call home! A cozy turn-key 1 story home, recently updated with new roof, freshly painted, new kitchen, new appliance & more! Home is bright with a lot of natural light. Also features luxury vinyl plank floor and wood fireplace. An open kitchen with an abundance of cabinets, great place to prepare your favorite dishes! Home offers three spacious bedrooms and one full bath with an elegant tub. A spacious detached garage plus room for storage. Home is conveniently & centrally located nearby schools, parks, and shopping!
1/33
$435,000
3 beds1 bath1,092 sq ft0.23 acre (lot)
9701 Patterson St S, Tacoma, WA 98444
Listing provided by NWMLS as Distributed by MLS Grid
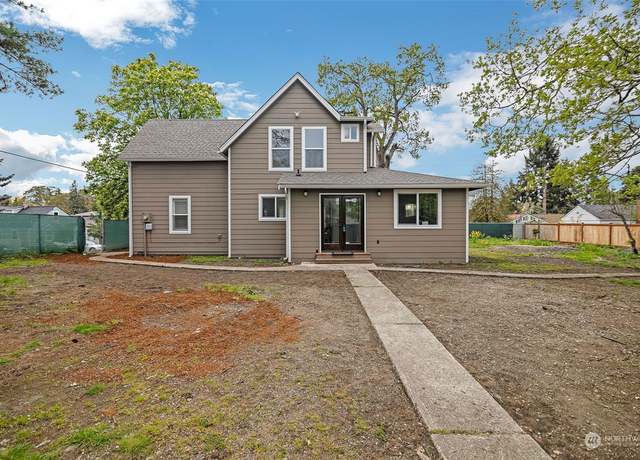
Discover the charm of this beautifully renovated house featuring 4 bedrooms and 2 bathrooms. Step inside to find a freshly painted exterior and interior, a new roof, and meticulously updated landscaping. The kitchen has been transformed with stunning quartz countertops, brand-new cabinets, and sleek stainless steel appliances. This home also boasts two living areas and a dining space with French doors that open onto a newly installed deck overlooking the peaceful backyard. Additional upgrades include a new laundry area with new washer/dryer and a cozy, heated office with direct backyard access—ideal for remote work. This property skillfully blends elegance with comfort, offering an en
1/39
$525,000
4 beds2 baths2,058 sq ft0.26 acre (lot)
710 141st St S, Tacoma, WA 98444
Listing provided by NWMLS as Distributed by MLS Grid
Introducing, The Spruce, by Pacific Lifestyle Homes. Stunning 1.5 story design with 3200+ sq. ft. 4 bedrooms & 2.5 baths. Impressive great room with soaring ceilings & tall windows create airy & open feel, plus optional fireplace with your choice of elegant surrounds. Primary on main, ensuite bath & walk-in closet. Chefs’ kitchen with island and nook, Butler Pantry, and formal dining room. Den/living room flex area on main, plus a 3-car garage! Hurry, while there is still time to personalize your brand-new home at our design studio. 1/3-acre shy homesites, Smart Home Tech, Heat pump with A/C. Just minutes to JBLM, rec center & park! Buyer’s Broker t
1/30
$794,900
4 beds2.5 baths3,213 sq ft0.29 acre (lot)
2029 142nd Street Ct S, Spanaway, WA 98387
Listing provided by NWMLS as Distributed by MLS Grid
Nestled within a secure gated community, this well-maintained 4-bedroom, 2.5 bath home is now available for the first time! Step into the cozy yard featuring a fireplace, ideal for gatherings and relaxation. Recently updated with brand-new flooring, this property offers modern comfort throughout. Enjoy the convenience of a walkable community, making everyday living a breeze. Experience the charm of this inviting residence – your ideal home awaits!
1/40
$447,000
4 beds2.5 baths1,472 sq ft2,169 sq ft (lot)
11414 6th Ave E, Tacoma, WA 98445
Listing provided by NWMLS as Distributed by MLS Grid
The minute you drive up to this home, it says Welcome! Meticulously maintained & loved through the years. Pride of ownership shows in every detail, inside and out. The home features 3 generous-sized bedrooms; the primary bedroom has a 3/4 bath & a walk-in closet. Family/living rm has a cozy Gas fireplace, & the adjoining dining rm makes a wonderful gathering space for daily living, fun & leisure. All appliances included; An oversized corner lot with a fully fenced backyard & a beautifully landscaped yard with a front sprinkler system & covered patio allows for year-round relaxation & enjoyment; the comfortable Gas furnace is two years old and ready f
1/33
$474,950
3 beds2 baths1,212 sq ft0.24 acre (lot)
14417 5th Ave E, Tacoma, WA 98445
Listing provided by NWMLS as Distributed by MLS Grid
Welcome to Trails End at Brookdale an Ichijo USA community. The Palermo floor plan, Homesite 17, 2397 sqft, 3 bed, 2.5 bath home, Den on Main. Walk-in Pantry. Bonus room upstairs. Large Primary bedrm with tray ceiling and 5 piece bathroom. Walk-in closet. Covered patio. Personalize your home with hard surface choices at the Design Studio. Ichijo buyer surveys continue to indicate Quality as the reason for choosing Ichijo, including: Tastefully designed contemporary exteriors, Piano Finish Cabinetry, Unique Interior Doors, and much more. Community will have its own Clubhouse with outdoor pool, parks and play areas. Visit Model at-1401 137th Dt E, Tacoma, WA 98445. If represented by a broker,
1/21
$614,990
3 beds2.5 baths2,397 sq ft5,563 sq ft (lot)
1513 137th St E #17, Tacoma, WA 98445
Listing provided by NWMLS as Distributed by MLS Grid
An absolute must-see! This townhome offers an inviting open-concept layout, boasting 3 bedrooms and 2 baths, making it move-in ready for you. Revel in the fresh appeal with the flooring, elegant marble countertops, and a sleek stainless-steel sink. Enhancements include fresh bedroom doors, kitchen and bathroom faucets, and stylish kitchen island. Enjoy the added convenience of the beautiful bathroom vanities and toilets. Plus, benefit from the spacious one-car garage and ample guest parking. Outside, discover community amenities such as a playground and basketball court. Perfectly situated for easy access to 512 and I5, as well as nearby shopping, bus lines, and JBLM.
1/26
$374,999
3 beds2 baths1,358 sq ft3,341 sq ft (lot)
1007 109th Street Ct E #93, Tacoma, WA 98445
Listing provided by NWMLS as Distributed by MLS Grid
Charming home located at 11711 12th Ave So in Tacoma, WA. This cozy home features 1 bathroom, 2 bedrooms, with a finished area of 965 sq. ft. The basement is 295 square feet with washer-dryer and can be finished into a family room or a bedroom. Situated on a spacious lot size of 22,500 sq. ft. , with a fully fenced in yard. This property offers plenty of outdoor space for relaxation and entertainment and within walking distance to coffee shops, restaurants, shopping and bus stop. Perfect home for an investment property. The University is within five blocks and ten minutes to the back entrance of Ft. Lewis McChord Air Force Base. This home offers room to build onto or add a second home. Grea
1/28
$450,000
2 beds1 bath1,215 sq ft0.52 acre (lot)
11711 12th Ave S, Tacoma, WA 98444
Listing provided by NWMLS as Distributed by MLS Grid
Affordable 2 bedroom 1 bathroom home in the 55+ Parkland Mobile Village! Nearby parks, grocery stores, dining, schools, PLU, bowling & petting zoo. Newer roof, newer staircase to the entry, new water heater, new fridge, & full washer/dryer. Spacious kitchen & living room with room for furniture & potentially a small dining or office area. Bedrooms have built in closet storage. Fully fenced backyard with room to lounge or make a garden. Large secured shed, great for storage. You won't need to spend much to get the keys, but if you don't have enough cash to buy it now- we can refer you to a lender who may be able to help you finance the rest. Park rent is $760/month. Th
1/33
$35,000
2 beds1 bath728 sq ft
507 131st St E #17, Tacoma, WA 98445
Listing provided by NWMLS as Distributed by MLS Grid
Opportunity knocks! Fixer house on . 344 acre lot. There are six 25ft lots which (per the county) can be combined for 3 building lots. Must raze structures to accomplish this or fix up the house and have one building lot. You choose! Don't miss out on this deal! Do not enter property without your broker.
1/28
$399,000
3 beds1 bath1,153 sq ft0.34 acre (lot)
856 112th St S, Tacoma, WA 98444
Listing provided by NWMLS as Distributed by MLS Grid
Welcome to the retreat as you arrive home! One acre always well maintained and updated along the way. Professional landscape w/ front & back yard water features, inground pool 14X30, 3-6 Ft Deep, hot tub, outside covered patio-kitchen. Sprinkler system front & backyard, raised garden beds, green house, big toy (swings), RV parking, oversized garage w/ pull dwn stand up storage. 50 yr roof, 2013 Installed. Live on the main floor, great room w/ vaulted ceilings, river rock fireplace built-in shelving, opens to bck-yrd, formal living & dinning rm. Primary bdrm suite, 5 piece remolded bath heated floors wlk-in closet on main floor. Upstairs 2bd rooms with built-in desks and sh
1/40
$1,249,999
4 beds3 baths3,750 sq ft1.00 acre (lot)
1607 126th Street Ct S, Tacoma, WA 98444
Listing provided by NWMLS as Distributed by MLS Grid
Unlock endless possibilities with this spacious 8-bed, 3-bath home, featuring a vast kitchen with ample storage and a massive island, perfect for gatherings. It boasts two large living areas, versatile for entertainment or relaxation, and generously sized bedrooms for comfort. A den offers a quiet work or hobby space, enhanced by air conditioning for year-round comfort. The property includes a large shop with an unfinished loft, offering creative space potential. This home is not just a living space but a canvas for your dreams, presenting a unique opportunity for customization and personal touches. A perfect blend of size, functionality, and potential.
1/25
$674,999
8 beds3 baths4,176 sq ft0.23 acre (lot)
610 111th St S, Tacoma, WA 98444
Listing provided by NWMLS as Distributed by MLS Grid
Well cared for Duplex with 2 bedroom, 1 bath units, separate attached garages, additional ample parking, washer/dryer hookups, wood burning fireplaces, skylights, newer evergy efficient windows and new garage doors on approxomataly 1/3 acre fully landscaped lot with private patios. Close to shopoing, I-5 and commuter park and ride and 512. Great street exposure with nice curb appeal. Long term tenants with excellent rent add-on potential. Schedule your showing today!
1/22
$565,000
4 beds2 baths1,680 sq ft0.29 acre (lot)
1807 116th St S, Tacoma, WA 98444
Listing provided by NWMLS as Distributed by MLS Grid
Great investment property. This property features 2 homes on a 7550 square foot lot. The remodeled main house has beautiful hardwood floors throughout and newer carpet. A spacious eat-in kitchen, a mudroom & 2 large main floor bedrooms, modern bathroom with tiled floor, designer paint and tiled tub surround with a the loft currently being used as a third bedroom. The primary bedroom also features a walk-in closet. The ADU is a modern 1 bedroom 1 bathroom unit with gleaming hardwoods throughout, newer carpet and tile. The kitchen is designed with newer black appliances and overlooks the fully-fenced yard. Separate outbuilding that can be used for studio, workout gym, or office. Located
1/24
$549,950
3 beds1.5 baths1,200 sq ft7,750 sq ft (lot)
9928 Yakima Ave S, Tacoma, WA 98444
Listing provided by NWMLS as Distributed by MLS Grid
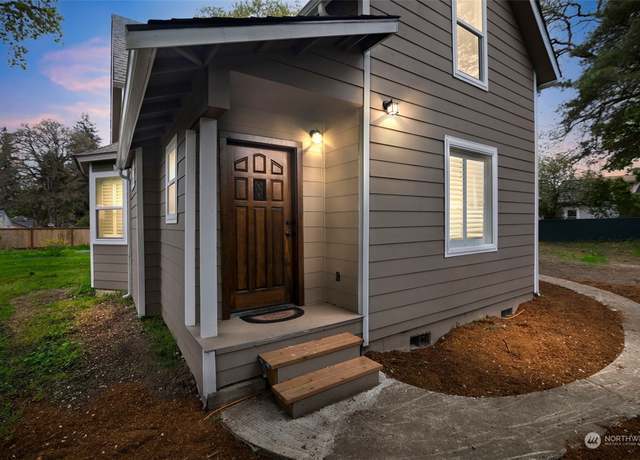
Introducing a masterpiece of craftsmanship & luxury, this home is meticulously designed for the discerning buyer who appreciates quality & attention to detail. No expense has been spared in creating a residence that exudes elegance & functionality. Spanning just under 1,100 sq. ft, this home boasts an open layout with high-end finishes throughout. 3 bedrooms & 1.5 bathrooms, every inch of this space is thoughtfully curated to provide comfort & style. New furnace, AC, tankless water, fireplace, siding, plumbing & electrical, & 50-year presidential comp roof + (way) more. Offers RV Parking, architecturally designed front & rear porch & perf
1/32
$475,000
3 beds1.5 baths1,060 sq ft6,220 sq ft (lot)
921 140th St S, Tacoma, WA 98444
Listing provided by NWMLS as Distributed by MLS Grid
On Purvis Pond you will find this GATED estate property with manicured grounds. Nearly 4 acres w/ a meandering creek that feeds out to Tule Lake. You can simply move into this home with updated & sun filled kitchen; gas cooking; stainless appliances and conversation sized island. All overlooking the POND and outdoor living areas. MAIN FLOOR primary suite w/ generous sized spa like bath w/ sauna-all overlooking your deck; grounds and the sounds of water. Upstairs--two more bedrooms; shared bath. 2ND DETACHED garage makes for perfect storage of all your toys, SPORTS COURT/PICKLE BALL court and even a quaint bridge to the acreage. OPEN SPACE designation allows for discounted taxes. Close
1/39
$1,470,000
3 beds2.5 baths3,226 sq ft3.91 acres (lot)
13703 Spanaway Loop S, Tacoma, WA 98444
Listing provided by NWMLS as Distributed by MLS Grid
Welcome to this charming all-brick home showcasing timeless design and modern updates. Step inside to discover brand new luxury vinyl plank (LVP) flooring throughout, enhancing both style and durability. Fresh interior paint brightens every room, while a newly tiled shower and bathroom floor add a touch of luxury to your daily routine. Park your RV conveniently with a dedicated plug and enjoy the security and privacy of a fully fenced yard surrounded by gorgeous, mature vegetation. With its inviting atmosphere and beautiful surroundings, this property is ready for your personal touches and to welcome you home. Don't miss out on this wonderful opportunity.
1/33
$426,999
2 beds1.5 baths1,266 sq ft0.28 acre (lot)
803 102nd St S, Tacoma, WA 98444
Listing provided by NWMLS as Distributed by MLS Grid
Rare Find! Custom built 2 story home sitting on 1 acre on private dead-end road. Covered front porch, with formal living and dining room. Gourmet kitchen with walk in pantry. Large family room with wood stove and brick surround. Large primary bedroom with primary bathroom. Built in vacuum installed in home. The large covered patio is great for entertaining. This home has a 3 car garage and additional parking for RV. No HOA!
1/23
$800,000
3 beds3 baths2,905 sq ft1.00 acre (lot)
1004 148th Street Ct E, Tacoma, WA 98445
Listing provided by NWMLS as Distributed by MLS Grid
Move-in ready! 3-bedrooms, 2.5-baths, 2-car garage with shelves for storage and fenced backyard for privacy. The open concept in the kitchen/ dining/ living. All appliances comes with the house, new microwave, new stove, new dishwasher, newer washer and dryer, and new carpet. Roomy upstairs landing space. Primary bedroom includes, double doors, vaulted ceiling, ceiling fan and a large walk-in closet. Bathroom includes a soaking tub and a shower. HOA covers the roof, exterior and front yard maintained. Easy access to freeways, schools, grocery stores, and other amenities.
1/21
$399,950
3 beds2.5 baths1,744 sq ft3,494 sq ft (lot)
10810 Park Ave S, Tacoma, WA 98444
Listing provided by NWMLS as Distributed by MLS Grid
Welcome to this delightful single-level condo nestled in the Village of the Greens! Step into a warm, inviting space with an open layout that ensures seamless movement. Forget about stairs – this home offers convenient accessibility with no steps to worry about. Park your vehicles in the attached two-car garage, leaving plenty of room for your hobbies and storage needs. The HOA takes care of front and back lawn maintenance, so you'll have more time to relax and enjoy the beautiful surroundings. You can fire up the BBQ on the charming backyard patio and create lasting memories with friends. Plus, grocery stores and other amenities are just a stone's throw away, so everything you need i
1/19
$415,000
2 beds2 baths1,452 sq ft
1526 E 135th St, Tacoma, WA 98445
Listing provided by NWMLS as Distributed by MLS Grid
Ask about our New Price Improvement as you Immerse in the charm of this 5BR, 1.75BA Fern Hill beauty, spanning 1450 sqft on a 7500 sqft lot. With vibrant interior/exterior paint, luxurious vinyl flooring, new carpet, a modern kitchen, New Furnace, New Water Heater and spa-like bathrooms, every inch spells elegance. Enhanced by chic blinds and stylish light fixtures, it's a testament to sophisticated living. Ideally located near Pacific Lutheran College, dining, shopping, and easy freeway access, this home blends convenience with upscale living. A reimagined sanctuary offering comfort and style, it's ready to welcome you to a life where luxury meets prime location. Your dream home awaits in
1/31
$479,000
5 beds2 baths1,450 sq ft7,500 sq ft (lot)
11515 Yakima Ave S, Tacoma, WA 98444
Listing provided by NWMLS as Distributed by MLS Grid
Based on information submitted to the MLS GRID as of Mon May 06 2024. All data is obtained from various sources and may not have been verified by broker or MLS GRID. Supplied Open House Information is subject to change without notice. All information should be independently reviewed and verified for accuracy. Properties may or may not be listed by the office/agent presenting the information. Some IDX listings have been excluded from this website.
Homes in this area are served by the Franklin Pierce School District.
This area's enrollment policy is not based solely on geography. Please check the school district website for more information.
Elementary schools
Middle schools
High schools
GreatSchools Summary Rating
7/10
James Sales Elementary School
Public, K-5
5/10
Christensen Elementary School
Public, PreK-5
4/10
Brookdale Elementary School
Public, PreK-5
3/10
Collins Elementary School
Public, PreK-5
2/10
Midland Elementary School
Public, K-5
Only showing 5 of
6 elementary schools.
School data is provided by GreatSchools, a nonprofit organization. Redfin recommends buyers and renters use GreatSchools information and ratings as a first step, and conduct their own investigation to determine their desired schools or school districts, including by contacting and visiting the schools themselves.Redfin does not endorse or guarantee this information. School service boundaries are intended to be used as a reference only; they may change and are not guaranteed to be accurate. To verify school enrollment eligibility, contact the school district directly.
Transportation in Parkland, Washington, offers a blend of options for residents. The area is serviced by Pierce Transit, providing public transportation to those without a car or those who prefer not to drive. Traffic levels can vary, but generally, driving in Parkland is manageable with moderate congestion during peak hours. For those needing to travel further, Interstate 5 is conveniently located near Parkland, offering easy access to other areas.
What types of properties are available in Parkland?
Parkland, Washington offers a variety of single-family home types, including ranch-style homes, split-level homes, and contemporary homes. These homes can be found throughout the Parkland area, with many located in established neighborhoods and newer developments. Most properties in Parkland feature three to four bedrooms and were built within the past 20 years. To explore different property types for sale in Parkland, Washington, use the 'Home type' filter located above the active listings. Customize your search by selecting options like single-family homes, condos, townhomes, and more.
What is life like in Parkland?
Parkland, Washington offers a serene and picturesque environment with its lush greenery and stunning views. The region experiences a moderate climate, with mild summers and cool winters. The area provides a range of job opportunities across various industries, ensuring a diverse and thriving economy. Residents can engage in a plethora of recreational activities, such as hiking, biking, and exploring the numerous parks and trails. The community also hosts a variety of events and activities, providing ample opportunities for social engagement and personal growth.
What are the schools and amenities like in Parkland?
Parkland, Washington offers a variety of public amenities to cater to the needs and interests of its residents. Dining options are plentiful, with a diverse array of restaurants available. For those who enjoy outdoor leisure, numerous parks provide ample space for relaxation and recreation. Essential shopping needs can be met at a variety of grocery stores located within the region. Additionally, more amenities such as libraries, fitness centers, and schools contribute to the comprehensive services available in Parkland, Washington.
In the past month, 19 homes have been sold in Parkland. In addition to houses in Parkland, there were also 3 condos, 2 townhouses, and 1 multi-family unit for sale in Parkland last month. Parkland is a minimally walkable city in Pierce County with a Walk Score of 36. Parkland is home to approximately 35,058 people and 6,872 jobs. Find your dream home in Parkland using the tools above. Use filters to narrow your search by price, square feet, beds, and baths to find homes that fit your criteria. Our top-rated real estate agents in Parkland are local experts and are ready to answer your questions about properties, neighborhoods, schools, and the newest listings for sale in Parkland. Our Parkland real estate stats and trends will give you more information about home buying and selling trends in Parkland. If you're looking to sell your home in the Parkland area, our listing agents can help you get the best price. Redfin is redefining real estate and the home buying process in Parkland with industry-leading technology, full-service agents, and lower fees that provide a better value for Redfin buyers and sellers.


 REDFIN IS COMMITTED TO AND ABIDES BY THE FAIR HOUSING ACT AND EQUAL OPPORTUNITY ACT. READ REDFIN'S FAIR HOUSING POLICY AND THE NEW YORK STATE FAIR HOUSING NOTICE.
 United States
 Canada