LOVE WHERE YOU LIVE! HGTV-style remodel makes it easy to fall in love w/ these modern finishes in a turn-key charmer. 4 beds, 2 baths, spacious living room w/ vaulted ceilings. New updates from end of 2022 include: windows, brand new kitchen, quartz counters, SS range + microwave + refrigerator + dishwasher, Luxury Vinyl Tile floors (waterproof), bathrooms, doors, trim, hardware, sliders, light fixtures, electrical, fresh paint inside, exterior deck railing & freshly landscape. Covered carport parking, driveway parking & extra enclosed storage space off carport. A Must See!
1/40
$575,000
4 beds2 baths1,752 sq ft6,360 sq ft (lot)
22 Lake Louise Dr, Bellingham, WA 98229
Listing provided by NWMLS as Distributed by MLS Grid
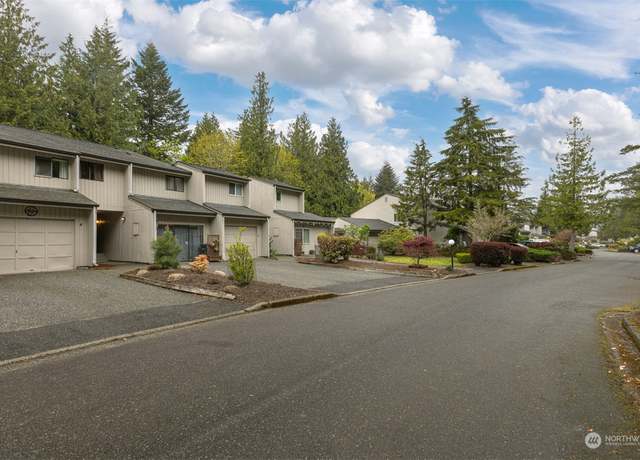
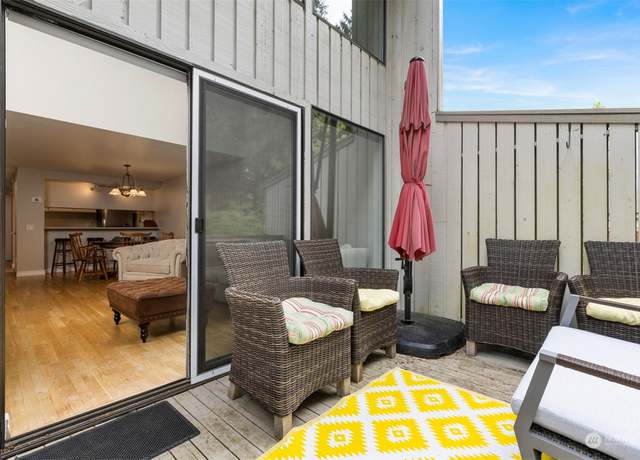
This single-story condo features a wall of windows facing the backyard offering a partial Lake Whatcom view. Vaulted ceilings throughout with clerestory windows create a very open & bright feeling throughout. Updated LVP flooring throughout the main living areas. Enjoy the comfort of a gas freestanding fireplace, the privacy of the front porch & the convenience of the 1-car garage. Third bedroom was converted into living space - it could be walled off again if additional sleeping space is desired. Located in a very walkable part of Sudden Valley where you can easily access swimming pools, tennis courts, lakefront beaches, a community center, restaurants, WTA bus route 512 &
1/40
$385,000
2 beds2 baths1,368 sq ft
22 Marigold Dr #19, Bellingham, WA 98229
Listing provided by NWMLS as Distributed by MLS Grid
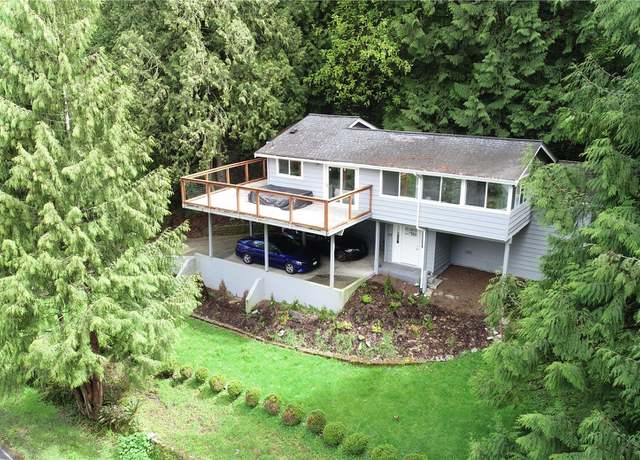
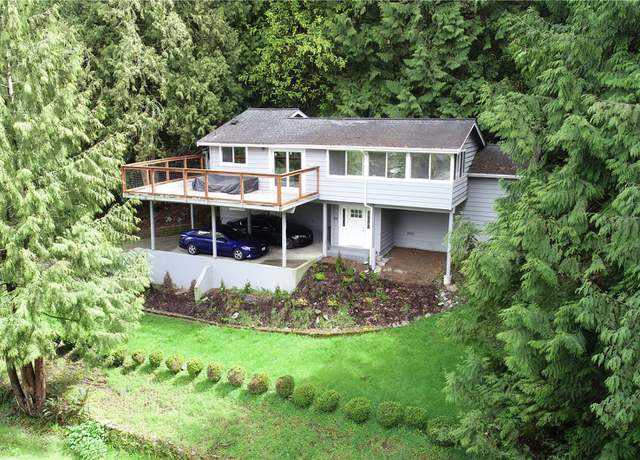
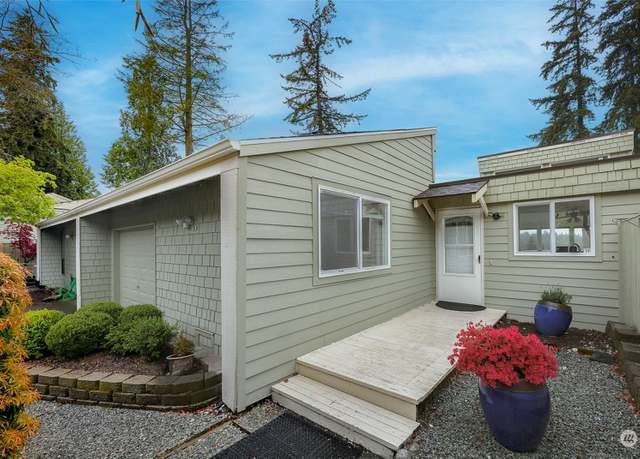
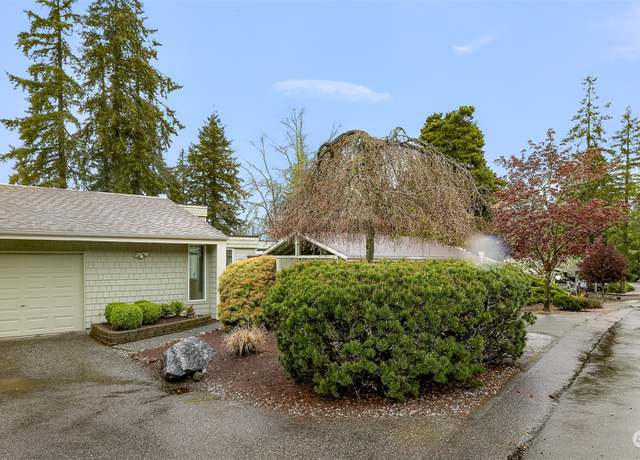
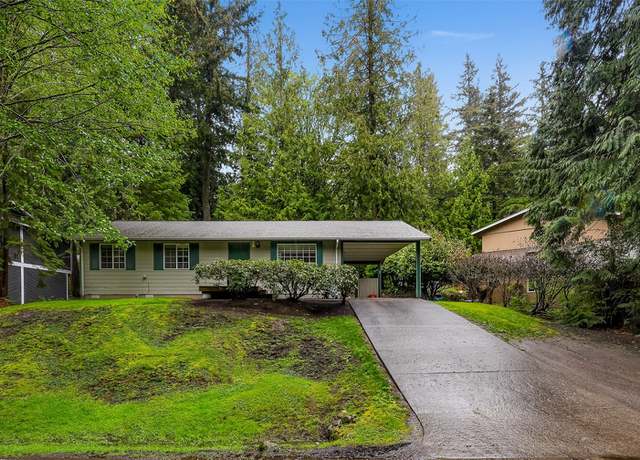
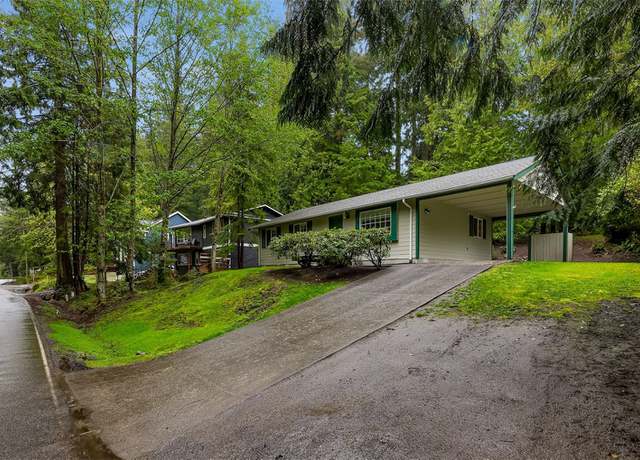
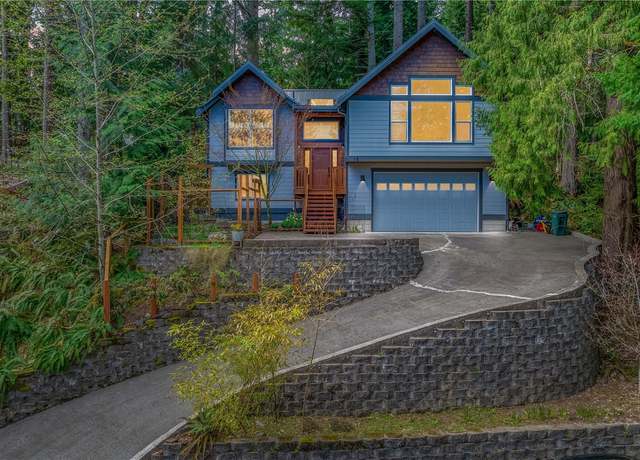
This lovingly cared for home in a quiet Sudden Valley setting offers comfortable single-level living. Great opportunity for first-time home Buyers, downsizing or investment! Plenty of natural light inside via windows and skylights, and outside, the natural setting is serene and full of wildlife - deer are regular visitors. Open kitchen and dining area with laundry room, cozy living room and three bedrooms. 3/4 bath en-suite to the spacious primary bedroom. Attached carport. Tons of upgrades including a whole-house generator, two ductless mini-split heat pumps, composite decking plus newer dishwasher, washer/dryer, water heater and roof! Community amenities include two pools, beaches, golf c
1/37
$435,000
3 beds2 baths1,040 sq ft8,361 sq ft (lot)
3 Stable Ln, Bellingham, WA 98229
Listing provided by NWMLS as Distributed by MLS Grid
Affordable condo living on serene Lake Louise! Picturesque living rom with huge windows from the hardwoods to the vaulted ceilings. Enjoy the view from every floor, bright natural light shines through the entire unit! This 1,238sqft condo with a fabulous loft featuring walk-thru closet to full bath. 2nd bedroom on upper floor with large closet. Kitchen has eating bar & dining area open to spacious living room. The deck welcomes you to a beautiful setting through featuring a peekaboo view of lake and trail. 1 car garage & amenities nearby!
1/37
$325,000
2 beds1.5 baths1,248 sq ft
1 Lake Louise Dr #4, Bellingham, WA 98229
Listing provided by NWMLS as Distributed by MLS Grid
NW contemporary construction w/ extensive use of hardwood & slate. Exceptionally maintained home features an open great room w/ vaulted ceilings, skylights & large windows that fill the home w/ natural light. Spacious primary suite on main level w/ spa-like bath including separate tiled shower, jetted tub, & dual vanity. Heated floors in bathrooms. Deer resistant garden w/ lots of sunlight. No neighbors on either side. Extra large lot, owners combined house w/ southern lot + neighboring community green space lot on North side of property. Area amenities: golf course, marina, beaches, YMCA, pool, sport courts, trails, library, 24/7 security & more. You won't want to mi
1/40
$649,000
3 beds2.5 baths1,838 sq ft0.28 acre (lot)
18 Cascade Ln, Bellingham, WA 98229
Listing provided by NWMLS as Distributed by MLS Grid
Tucked into Sudden Valley's premier Gate 2, this 2250 sq ft 4 bedroom home offers partial lake views from much of the home, including the kitchen. With a flat front yard, new roof, & fresh exterior paint, it exudes curb appeal. The main floor is highlighted by a sunken living room & a floor to ceiling fireplace oozing a groovy, chill vibe. Inside, discover newer flooring & appliances, along w/ a tankless HWT. Then step outside onto your massive deck to soak in the scenery. The finished basement boasts potential for an apartment, MIL suite, or office. Enjoy all Sudden Valley amenities & proximity to Lake Whatcom. Sudden Valley amenities include a stunning 18-hole golf
$679,000
4 beds2.5 baths2,250 sq ft7,824 sq ft (lot)
21 Marigold Dr, Bellingham, WA 98229
Listing provided by NWMLS as Distributed by MLS Grid
Outdoor enthusiasts rejoice! Nestled w/ in Gate 3 & surrounded by trees, this 4 bed 2.5 bath home welcomes you w/ its spacious open concept. Picturesque windows and skylights allow the home to be drenched w/ natural light. 3 beds on the main including primary w/ ensuite. Designed w/ entertainment in mind. Kitchen, living & dining room flow seamlessly to your wrap around deck, overlooking your low maintenance yard & Little Strawberry Park. Downstairs (remodeled 2024) provides a multi-generational living option w/ a second primary suite, living area and separate entrance. New roof (2019) provides peace of mind. Amenities include trails, parks, private beaches, 18 hole golf c
$535,000
4 beds3 baths2,150 sq ft7,294 sq ft (lot)
22 Little Strawberry Ln, Bellingham, WA 98229
Listing provided by NWMLS as Distributed by MLS Grid
Welcome to the premier Lake Whatcom condo you've been waiting for! With lake views from every room this single-level, 2 bedroom condo is steps to your dreams. Walking distance to the quiet & calm AM PM beach with kayak storage, marina with boat storage, golf course & all amenities offered in Sudden Valley including the pool, fitness center & clubhouse. Recently completely remodeled with new floors, countertops, cabinets, paint and top-of-the-line appliances. High-end trim package & doors. New bay window recently installed to take in the stunning lake views. Primary bedroom with private deck also with lake views! Building has been freshly resided & roof installe
$535,500
2 beds1.5 baths1,006 sq ft
1 Morning Beach Dr #21, Bellingham, WA 98229
Listing provided by NWMLS as Distributed by MLS Grid
Instant equity, offered $20K under March 2024 appraisal. Space for everyone and everything! Light & Bright, this better than new 4BR, 2.5BA home has a great open concept floor plan w/ huge bonus room over the garage. Enjoy private natural views from the partially covered Trex deck w/ oversized slider access. Upstairs features spacious primary suite, 3 add'l bedrooms, 2nd bath & den/office space. More features include gas fireplace, mini split heat pump providing AC for the main living area & large kitchen w/ quartz counters, soft close drawers and eating bar. Enjoy Sudden Valley amenities: 18-hole golf course, marina, two outdoor swimming pools, fitness center, off-leash d
$750,000
4 beds2.5 baths2,895 sq ft6,478 sq ft (lot)
38 Harbor View Dr, Bellingham, WA 98229
Listing provided by NWMLS as Distributed by MLS Grid
Brand new home located on a double lot, with massive garage! This home has 9 foot ceilings throughout the main level, and a large deck on the rear of the home. There is also a landscaped firepit area behind the home! Features include: Open kitchen with stainless appliances, white cabinet package, & oversized island for casual dining & entertainment. Luxury vinyl plank flooring with gas fireplace as the centerpiece in the great room. Primary suite with 5 piece ensuite bath & large walk-in closet. Family room, full bath, additional laundry, & 4th bedroom down (or private suite - w/ exterior entrance potential). Large garage w/ storage room (or potentially a wine cella
$850,000
4 beds3 baths2,572 sq ft0.30 acre (lot)
12 Green Hill Rd, Bellingham, WA 98229
Listing provided by NWMLS as Distributed by MLS Grid
This charming condo, perfectly located in the heart of Sudden Valley, is ready to become your ideal full-time or part-time vacation lifestyle home! Let the natural light and fresh air in through your beautiful French doors that open right into your primary bedroom suite, or enjoy the sights and sounds of the outdoors from your freshly painted deck. Experience all that Sudden Valley has to offer including ample built-in amenities such as a professional 18-hole golf course, community garden, a stunning marina and more! Surrounded by serene natural beauty and endless activities for all ages, this home is excellent for anyone who wants to adventure, host, or just kick back and relax.
$349,900
2 beds2 baths1,120 sq ft
1 Lake Louise Dr #35, Bellingham, WA 98229
Listing provided by NWMLS as Distributed by MLS Grid
Great opportunity in Sudden Valley! Surrounded by trees on a quiet street, this 1700+ square foot home has endless possibilities. Kitchen, living room and dining room flow together with an open concept layout. Light and bright with lots of windows and direct access to your spacious wrap around deck. 2 bedrooms on the main floor and a fully finished basement with 2 bedrooms, a den and a separate entrance. Could be used as a MIL suite or a short term/long term rental. Enjoy the Sudden Valley community including boat launch, golf course, community pool, tennis courts, parks, endless trails, boat launch and beach access on Lake Whatcom!
$575,000
4 beds1.5 baths1,748 sq ft0.33 acre (lot)
4 Overlake Ct, Bellingham, WA 98229
Listing provided by NWMLS as Distributed by MLS Grid
Nestled along the scenic fairways of the golf course, this spacious 3700+ sq ft custom-built one owner home is now available for the first time. This generous 3-bedroom home hosts 2 ensuites, with additional living space and office upstairs. Enjoy the architectural marvels like vaulted ceilings and large windows that flood the home with natural light, serene views and wildlife. With its thoughtfully designed layout, this home provides the perfect canvas for your personal touches. Enjoy comfort and style in the vibrant community offering amenities - private beaches, seasonal pool, parks, gym, marina, & the 18-hole championship golf course.
$1,080,000
3 beds3.5 baths3,767 sq ft0.29 acre (lot)
17 Par Ln, Bellingham, WA 98229
Listing provided by NWMLS as Distributed by MLS Grid
Welcome to your new condo! Nestled within the picturesque surroundings of Sudden Valley Bellingham, this home boasts high ceilings, vaulted windows, and a sleek modern update. The layout features an open living space with heated floors, a brand-new kitchen, and a secluded loft bedroom upstairs with its own ensuite bath. Only a short walk to a plethora of amenities including the pool, restaurants, tennis court, trails, golf course, marina, library, and Lake Louise! But wait, there's more! This condo offers an enticing opportunity as a lucrative Airbnb, bringing in $130 per night with no rental cap. Whether you choose to make it your primary residence, a getaway, or a savvy investment propert
$369,000
1 bed1.5 baths800 sq ft
4 Marigold Dr #9, Bellingham, WA 98229
Listing provided by NWMLS as Distributed by MLS Grid
Over 550 feet of pristine waterfront on the shores of Lake Whatcom with a private cove, sandy beach, and new dock. Gated entry and a long lit private drive leads to a secluded, epic, 4,000+ square foot waterfront home completely wrapped in metal. The open concept design on the main level offers a great room with a unique barrel vault ceiling, walls of glass & two primary bedrooms with ensuite baths & walk in closets. The lower level features another two large bedrooms, bath, & a spacious game/rec room with wet bar. Enjoy outside living on two massive covered decks with spectacular views of the lake & surrounding foothills. Enjoy a large detached 3 car garage with bath
$2,950,000
4 beds3.5 baths4,086 sq ft1.55 acres (lot)
2500 Lake Whatcom Blvd, Bellingham, WA 98229
Listing provided by NWMLS as Distributed by MLS Grid
Live the Lake Whatcom waterfront dream in this exquisite and expansive home! Large windows allow natural light to filter in, providing views of the lake from all main living areas. The living spaces are cozy and inviting, with a fireplace featured on each level. The kitchen is modern and functional, equipped for both casual meals and entertaining. There's plenty of wine storage as well as a wet bar. The bedrooms are comfortable retreats, with the primary featuring a luxurious en-suite bathroom. The deck spans the length of the home with an incredible lake view; the lower level offers walk-out access to the water. Updates throughout and with a full kitchen on the lower level, it could be par
$1,500,000
3 beds2.5 baths2,890 sq ft5,550 sq ft (lot)
12 Spinnaker Ln, Bellingham, WA 98229
Listing provided by NWMLS as Distributed by MLS Grid
Looking for a highly recreational property walking distance to amenities including the golf course, fitness center, outdoor summer pools, lake beaches & more? Then this is it! Spacious 3BR, 2BA condo has been recently updated with all new luxury vinyl plank flooring throughout + new paint, trim & lighting. Light & bright updated kitchen has newer stainless steel appliances, quartz tile counters, new hardware & eating bar. Sitting above Lake Louise, you will love the private back deck facing the trees. With a surprising amount of storage, take advantage of the double closets in the primary bedroom, under the stairs storage off the entry and of course the coveted singl
$379,900
3 beds2 baths1,294 sq ft
1 Lake Louise Dr #17, Bellingham, WA 98229
Listing provided by NWMLS as Distributed by MLS Grid
Brand new highly upgraded home under construction adjacent to one of Sudden Valley's largest waterfront parks - Morning & Afternoon Beach. Enter the massive living / great room & enjoy 12 foot ceiling, luxury plank flooring, gas fireplace, and a large covered deck at the rear of the home overlooking Morning Beach Park. The platted trail down to the lakeside park is adjacent to this home. Kitchen offers high-end stainless appliances (gas cooktop), walk-in pantry, and 8' island with quartz countertop. Downstairs features Primary suite w/ large ensuite walk-in closet & amazing full bath with large tiled shower, 2 guest bedrooms, den / family room, & a massive recreation
$1,095,000
3 beds2.5 baths3,077 sq ft6,706 sq ft (lot)
12 Sunflower Cir, Bellingham, WA 98229
Listing provided by NWMLS as Distributed by MLS Grid
Rare opportunity to enjoy life in one of the most desirable areas of Lake Whatcom! Situated on 125 ft of waterfront in sought-after Strawberry Point, this property offers all-day sun, stunning views & incredible privacy. Luxurious main-level primary suite w/ a fireplace & cedar sauna. Seamless integration of indoor/outdoor spaces & amenities including a covered heated patio, in-ground hot tub, & built-in gas fire pit & BBQ—the ideal place to relax & entertain. Wine fridge & new Bertazzoni appliances in the kitchen. Detached ADU (an add'l 636 sq ft) offers versatile living options. Recently restored dock is protected by a natural jetty. Nothing
$2,690,000
4 beds3 baths3,240 sq ft0.40 acre (lot)
49 Strawberry Point Rd, Bellingham, WA 98229
Listing provided by NWMLS as Distributed by MLS Grid
Affordable 12 minutes from Bellingham. Private and cozy 3 bedroom, 1 bath. Fantastic starter or short term rental. This charmer has a completely remodeled kitchen with granite countertops, new cabinets and new flooring in the living room and kitchen. New appliances, new insulation new water heater, new blinds in two rooms. Exterior painting and new insulation. Large finished extra rec room, Needs some TLC . Decking, maintenance free railings and new vinyl windows. On a quiet cul-de-sac. Includes all Sudden Valley amenities; 18 hole golf course, gym membership, swimming pool, tennis courts, walking trails, boat launch and 24/hour security. One year Americas Preferred Home Warranty include
$435,000
3 beds1 bath1,384 sq ft6,645 sq ft (lot)
17 Meadow Ct, Bellingham, WA 98229
Listing provided by NWMLS as Distributed by MLS Grid
Welcome to 5 Green Hill Rd! This beautiful completely remodeled home offers 3-bd, 2.75 bath & an office space too! Enoy the open concept living space on the main floor with high end finishes, quartz countertops & stainless-steel appliances! Double doors open up to the wraparound deck where you can unwind & enjoy the relaxing water feature! This large double lot offers a sunny flat backyard, with tons of space for gardening & backs up to private SV land. The flat driveway provides tons of private parking, plus an upper lot too! Enjoy the Sudden Valley Community private beaches on Lake Whatcom, tennis court, community pool, parks, boat launch, golf course along with ju
$630,000
3 beds3 baths1,800 sq ft6,127 sq ft (lot)
5 Green Hill Rd, Bellingham, WA 98229
Listing provided by NWMLS as Distributed by MLS Grid
Unwind in this private forest sanctuary surrounded by towering cedars w/ a waterfall & creek as your backyard view! This home features 3 bedrooms plus a main floor office with french doors, 2.5 bathrooms, two living rooms, two two-car garage with workspace, and ultimate privacy. The upstairs has the primary suite with two closets and an en suite full bathroom, additional bathroom and two bedrooms and separate living/family room with many windows bringing in natural light and views of the surrounding greenery. Step out onto the back patio and be serenaded by the flowing waterfall and creek in plain view, with no other homes visible you truly feel transported to your own evergreen oasis
$700,000
3 beds2.5 baths1,800 sq ft7,736 sq ft (lot)
209 Harbor View Dr, Bellingham, WA 98229
Listing provided by NWMLS as Distributed by MLS Grid
Experience casual elegance in this modern designed home with green-belt at the rear & filtered views of Lake Whatcom and the Stewart Mountains from the front. First level has a large 2-car garage; half bathroom; and large laundry room. The 2nd level has a wonderful open design with Living Room, Kitchen (with island) & Dining Room. Rear patio area off of the Dining Room. The Kitchen has white cabinet package with light quartz countertops & stainless steel appliances. Elegant stone 'floor to ceiling' gas fireplace is a wonderful centerpiece in the Living Room. The office and another half bathroom completes the 2nd floor. Upstairs has the Primary Bedroom with onsuite bathroom
$639,900
3 beds3 baths2,174 sq ft3,000 sq ft (lot)
28 Hillside Pl, Bellingham, WA 98229
Listing provided by NWMLS as Distributed by MLS Grid
Nestled on a hill, this gem offers more than a home—it's an experience. Panoramic views of Lake Whatcom greet you daily. Inside, a spacious great room w/ vaulted ceiling & a fireplace invites you to unwind. Gourmet kitchen, adorned w/ SS appliances & granite counters, beckons culinary adventures. Dine on the view deck w/ morning coffees & sunset dinners. Primary suite boasts a cozy fireplace & luxurious garden tub for ultimate relaxation. Downstairs, envision a versatile space—a potential MIL suite. Enjoy the hot tub or explore gardens. Creatives will adore the separate studio & outdoor enthusiasts revel in nearby Galbraith Mountain trails & L
$1,147,000
4 beds3.5 baths3,054 sq ft0.27 acre (lot)
4951 Coronado Ln, Bellingham, WA 98229
Listing provided by NWMLS as Distributed by MLS Grid
Come build your new home in beautiful Sudden Valley! This flat, double lot is perfect for your new home. Included with this property is the survey and Builder plans which include a single story home and 3 car garage. Sudden Valley is known for its close proximity to Lake Whatcom which makes it a great place to live full time or a great vacation destination. Amenities included a 18 hole championship golf course, marina, pools, gym, trails, beaches and more! Visit suddenvalley.com for information on amenities, building requirements and HOA review.
$125,000
— beds— baths0.30 acre (lot)
202 Harborview, Bellingham, WA 98229
Listing provided by NWMLS as Distributed by MLS Grid
Beautiful lot located near Gate 9 in the Sudden Valley community. Property is right next to Polo Park playground and mailboxes. There is a seasonal creek on the east side of the property. Wetland mitigation will need to be done. Property is sloped to the side. Wetland delineation and site survey in supplements. The U. L. I. D. Assessment (sewer) is paid in full. Enjoy all the amenities of sudden Valley!! Buyer advised to exercise due diligence during any feasability period.
$40,000
— beds— baths6,013 sq ft (lot)
8 Huckleberry Ct, Bellingham, WA 98229
Listing provided by NWMLS as Distributed by MLS Grid
Sloping residential vacant lot located in the Gate-2 neighborhood of Sudden Valley near Lake Whatcom, Morning & Afternoon Beaches, swimming pools and golf course. The property is 'road to road' with the best access from the top - making the property conducive for a home design with main level living, and a daylight basement below. Some filtered view potential in this neighborhood - two brand new homes cleared out a lot of trees down on the street below. Public services include: water, sewer, natural gas, cable and electricity. Nice homes in this waterfront neighborhood.
$75,000
— beds— baths6,000 sq ft (lot)
11 Sunflower Cir, Bellingham, WA 98229
Listing provided by NWMLS as Distributed by MLS Grid
Priced to sell! Great lot in Gate 13, ULID has been paid on lot 55. A lovely and private lot to build your next home, this could be the one!. All Sudden valley amenities include golf course, marina, hiking trails, swimming pool, tennis courts, beaches, boat launch and 24/7 security.
$14,900
— beds— baths6,640 sq ft (lot)
148 Polo Park Dr Unit A, Bellingham, WA 98229
Listing provided by NWMLS as Distributed by MLS Grid
Here we have a rare opportunity to own the ONLY vacant lot on Lake Whatcom. Boasting over 10,000 sq/ft of flat, sunny land with 100’ of lakefront, this is not one to miss! With city water & sewer already on site, you can begin enjoying your tranquil getaway on day one! This property has numerous sheds on site including one with power for convenient storing equipment or recreational gear. The large dock with covered boat lift makes summer lake days a blast! Moreover, the property's proximity to town offers the best of both worlds - the tranquility of lakeside living coupled with the convenience of urban amenities nearby. This blend of natural beauty and accessibility makes it an
$1,800,000
— beds— baths0.27 acre (lot)
2652 Lake Whatcom Blvd, Bellingham, WA 98229
Listing provided by NWMLS as Distributed by MLS Grid
Embrace affordable living in Sudden Valley with this prime lot on Black Bear Court. Enjoy access to exceptional amenities including pools, sports courts, marina, and a community center, all while being a stone's throw from Bellingham, I-5, and beyond. A perfect blend of convenience, community, and natural beauty awaits you.
$24,900
— beds— baths6,872 sq ft (lot)
14 Black Bear Ct Unit A, Bellingham, WA 98229
Listing provided by NWMLS as Distributed by MLS Grid
Welcome to your dream lakeview living opportunity on Lake Whatcom! This half-acre lot offers breathtaking views & is nestled on a peaceful, non-thru street in the highly desirable Strawberry Shore neighborhood. Imagine building your custom home on a lot that already comes with a foundation in place, significantly streamlining your construction process and bringing you one step closer to waking up to water vistas every day. As a part of this community, you'll enjoy access to your shared shoreline, private picnic area and complete with a new private dock and your own boat slip. Picture yourself spending summers swimming in the clear lake waters or embarking on boating adventures.
$625,000
— beds— baths0.53 acre (lot)
2678 Strawberry Shore Dr, Bellingham, WA 98229
Listing provided by NWMLS as Distributed by MLS Grid
Extremely unique opportunity to develop your dream, vacation, or investment home on this ~1 Acre property in Sudden Valley! Comprised of six parcels, 1 Southern Ct ensures privacy and flexibility with lake views at the apex of the lot and nearby waterfalls. With access to all amenities of the Valley - marina, dog park, walking trails, parks, 18-hole championship golf course, it has everything you need. Geotech report available and survey complete.
$99,000
— beds— baths0.96 acre (lot)
1 Southern Ct, Bellingham, WA 98229
Listing provided by NWMLS as Distributed by MLS Grid
Opportunity knocks at 34 Green Hill Rd! This lot in Gate 3 of Sudden Valley is the canvas you've been waiting for, walking distance to Maple Leaf Park. Imagine the ease of a flat driveway leading to your future home, surrounded by the natural beauty of a lush greenbelt to the right. The upward slope in the building area is gentle, so you could also work with a normal 2-story home plan (going up). Whether you're envisioning a tranquil retreat or a dynamic outdoor oasis, this lot sets the stage for your aspirations to take root and thrive. Don't let this chance slip away – seize the moment and make your dreams a reality with Seller Financing.
$45,000
— beds— baths5,940 sq ft (lot)
34 Green Hill Rd, Bellingham, WA 98229
Listing provided by NWMLS as Distributed by MLS Grid
Seize a golden opportunity to build your dream home on this double lot in the beautiful Sudden Valley community. This property is the perfect footprint for your dream home on almost half an acre! Enjoy the amenities this neighborhood includes with access to the stunning golf course, health club, pool, tennis courts, and 5 private beaches on Lake Whatcom. Tranquil and park like setting that is minutes from downtown Bellingham, local shops and restaurants, Galbraith Mountain and Lookout Mountain. Previously approved building plans attached, and so many more home plan options to create your own dream home layout!
$125,000
— beds— baths0.46 acre (lot)
10 Harbor View Dr, Bellingham, WA 98229
Listing provided by NWMLS as Distributed by MLS Grid
Prime Lake Whatcom view lot located in Sudden Valley Gate 1. Opportunity awaits as 4 Sanwick is for sale to offer a double lot. This turn key offering comes with building plans. Sudden Valley offers an array of desirable attributes, including breathtaking natural beauty, a close-knit community, and a range of amenities. Enjoy access to pristine Lake Whatcom with 5 private beaches, hiking trails, 18 hole golf course, and a marina with 2 boat launches. Embrace the tranquility of lakeside living while being just minutes away from Downtown Bellingham. Owner financing options available. Ask agents for more info!
$129,000
— beds— baths7,631 sq ft (lot)
6 Sanwick Point Ct, Bellingham, WA 98229
Listing provided by NWMLS as Distributed by MLS Grid
This property embodies the essence of the Pacific Northwest, situated 60 feet away from the road with the land gently sloping down to a green belt. From the access lot, it appears that the construction of a home on this site could offer a delightful lake view from the second floor (confirmation of viability depends on the buyer's verification of their home plans' heights). The fortunate purchaser of this lot will have the opportunity to construct a charming home with a view, the potential for an impressive daylight basement, and additional space for entertainment. The community offers amenities such as boat launch access, community beach access to Lake Whatcom, numerous playgrounds, parks,
$50,000
— beds— baths6,000 sq ft (lot)
23 A N Summit, Bellingham, WA 98229
Listing provided by NWMLS as Distributed by MLS Grid
Drive down Lake Louise Rd and take the first left into Sudden Valley! Come discover a hidden undeveloped lot in Gate 13, backing up to the 350-acre Stimpson Family Nature Reserve. Lot has potential access via SVCA-owned Lot K2 (buyer to verify).
$25,000
— beds— baths5,855 sq ft (lot)
4 Western Ln, Bellingham, WA 98229
Listing provided by NWMLS as Distributed by MLS Grid
Seller financing makes this property perfect for your dream home. Take the reins of your future and create a haven that reflects your style and vision. Located in the golf course and lakeside community of Sudden Valley, this property is up-sloping and would be great for a 2 story home with garage. Situated on a culdesac with public services available (water; sewer; electricity; cable; and phone) and ULID paid in full. Once cleared and developed, this property should have a nice territorial view over the neighborhood. Don't miss out on this opportunity to build your dream home or investment property!
$48,000
— beds— baths6,512 sq ft (lot)
11 Black Bear Ct Unit B, Bellingham, WA 98229
Listing provided by NWMLS as Distributed by MLS Grid
Gorgeous, very large, double lot in a desirable Sudden Valley community. With its own Trails, Marina, Boat launch, Dog parks, Am/Pm private beaches, Golf Course, Tennis courts, Private pool, Playgrounds and much more for your luxurious Life. Tons of Privacy. Park like setting with greenbelt in the back and on the left side. Very Quite street. Lot Has complete Survey, Soil test, Storm Water plan. Previously have been approved for a large House. Engineered Plans are available if the Buyer wants. Or Bring along your own imagination with an Architect.
$125,000
— beds— baths0.32 acre (lot)
291 Sudden Valley Dr, Bellingham, WA 98229
Listing provided by NWMLS as Distributed by MLS Grid
Based on information submitted to the MLS GRID as of Sun Apr 28 2024. All data is obtained from various sources and may not have been verified by broker or MLS GRID. Supplied Open House Information is subject to change without notice. All information should be independently reviewed and verified for accuracy. Properties may or may not be listed by the office/agent presenting the information. Some IDX listings have been excluded from this website.
School data is provided by GreatSchools, a nonprofit organization. Redfin recommends buyers and renters use GreatSchools information and ratings as a first step, and conduct their own investigation to determine their desired schools or school districts, including by contacting and visiting the schools themselves.Redfin does not endorse or guarantee this information. School service boundaries are intended to be used as a reference only; they may change and are not guaranteed to be accurate. To verify school enrollment eligibility, contact the school district directly.
Sudden Valley, Washington offers a serene and less congested driving experience, with traffic levels typically low, making it a peaceful place for car owners. However, it's essential to note that the region does not have a public transportation system. For those who frequently travel, Sudden Valley is conveniently located near Interstate 5, providing easy access to nearby cities and towns. Therefore, despite the lack of public transport, the presence of nearby highways makes commuting relatively straightforward for residents of Sudden Valley, Washington.
What types of properties are available in Sudden Valley?
Sudden Valley, Washington offers a variety of single-family home types, including ranch-style homes, split-level homes, and contemporary homes, among others. These homes can be found throughout the Sudden Valley community, nestled amidst the lush greenery and serene surroundings. Most properties in Sudden Valley feature 2-4 bedrooms and were built in various years. To explore different property types for sale in Sudden Valley, Washington, use the 'Home type' filter located above the active listings. Customize your search by selecting options like single-family homes, condos, townhomes, and more.
What is life like in Sudden Valley?
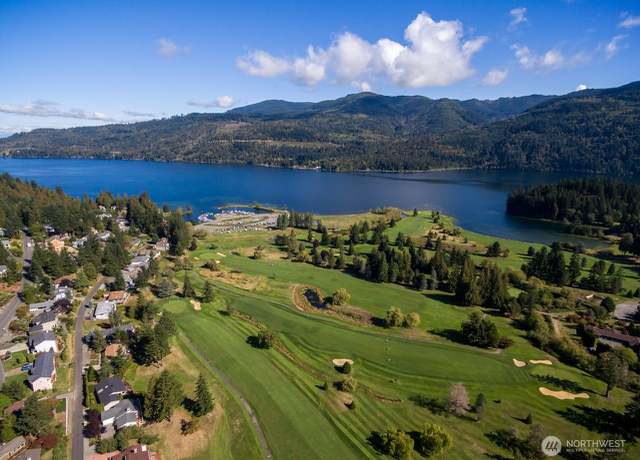
Sudden Valley, Washington offers a serene and picturesque living experience surrounded by natural beauty. The landscape is characterized by lush greenery, rolling hills, and breathtaking views of the nearby lakes and mountains. The weather in Sudden Valley is known for its mild summers and cool winters, providing a comfortable climate year-round. The town offers a range of job opportunities in various industries, ensuring residents have diverse options for employment. Residents can enjoy an array of recreational activities, such as hiking, fishing, and boating, making it an ideal place for outdoor enthusiasts.
What are the schools and amenities like in Sudden Valley?
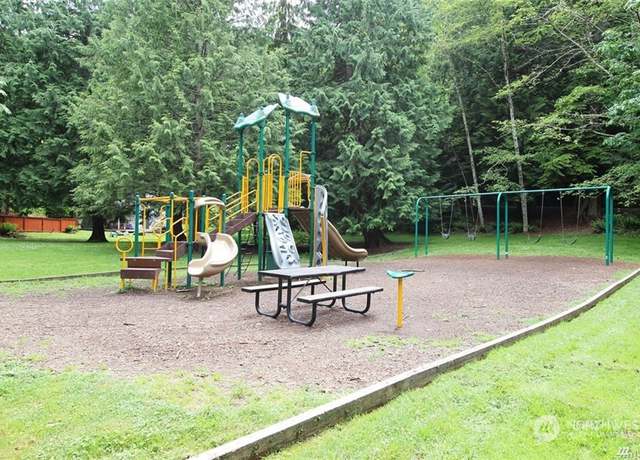
Sudden Valley, Washington offers a variety of public amenities for its residents. The area boasts a well-stocked grocery store for all your daily needs. For dining options, there is a restaurant within the region that caters to a variety of tastes. Outdoor enthusiasts will appreciate the expansive park available for recreational activities. Additionally, more amenities such as a fitness center, library, and golf course are also accessible within the region.
In the past month, 8 homes have been sold in Sudden Valley. In addition to houses in Sudden Valley, there was also 1 condo, 1 townhouse, and 0 multi-family units for sale in Sudden Valley last month. Find your dream home in Sudden Valley using the tools above. Use filters to narrow your search by price, square feet, beds, and baths to find homes that fit your criteria. Our top-rated real estate agents in Sudden Valley are local experts and are ready to answer your questions about properties, neighborhoods, schools, and the newest listings for sale in Sudden Valley. Our Sudden Valley real estate stats and trends will give you more information about home buying and selling trends in Sudden Valley. If you're looking to sell your home in the Sudden Valley area, our listing agents can help you get the best price. Redfin is redefining real estate and the home buying process in Sudden Valley with industry-leading technology, full-service agents, and lower fees that provide a better value for Redfin buyers and sellers.


 REDFIN IS COMMITTED TO AND ABIDES BY THE FAIR HOUSING ACT AND EQUAL OPPORTUNITY ACT. READ REDFIN'S FAIR HOUSING POLICY AND THE NEW YORK STATE FAIR HOUSING NOTICE.
 United States
 Canada