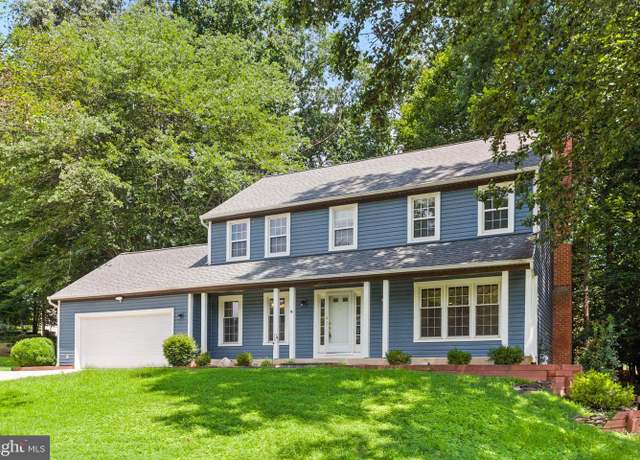
 2605 Bainbridge Ln, Silver Spring, MD 20906
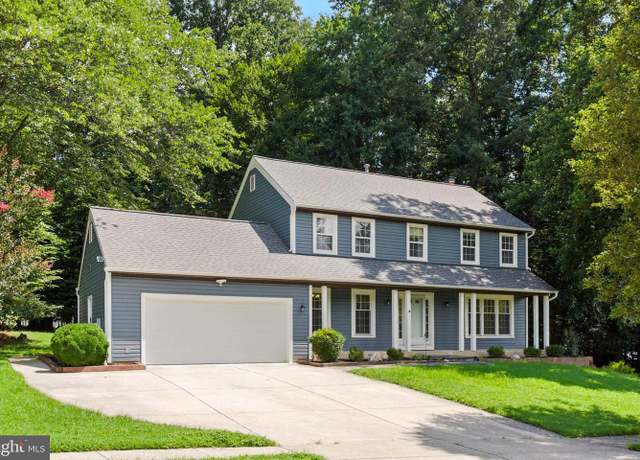 2605 Bainbridge Ln, Silver Spring, MD 20906
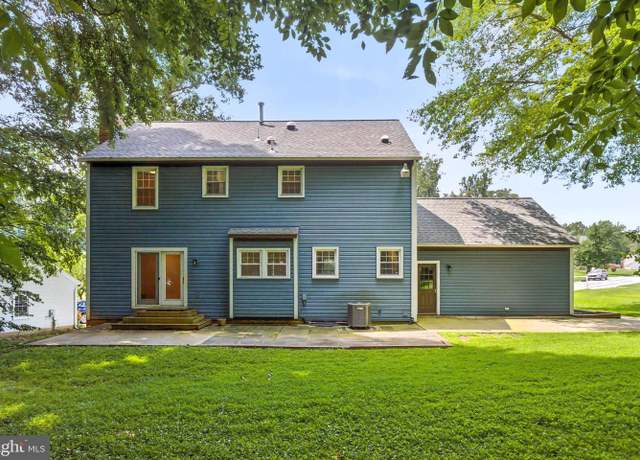 2605 Bainbridge Ln, Silver Spring, MD 20906
 12702 Hathaway Dr, Silver Spring, MD 20906
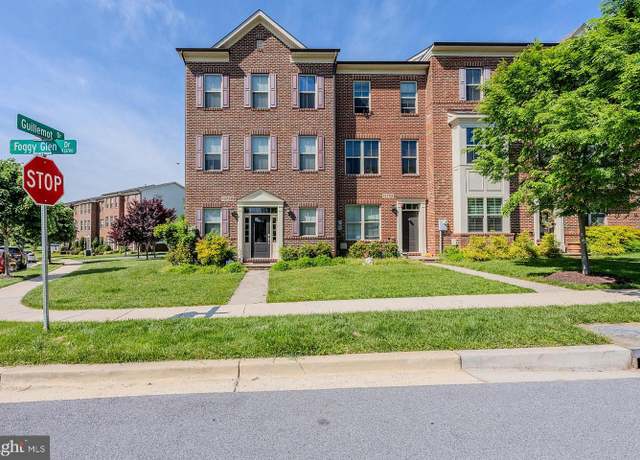 13750 Foggy Glen Dr, Silver Spring, MD 20906
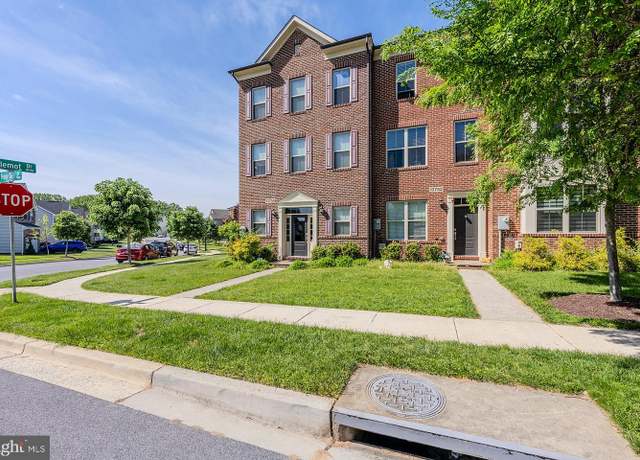 13750 Foggy Glen Dr, Silver Spring, MD 20906
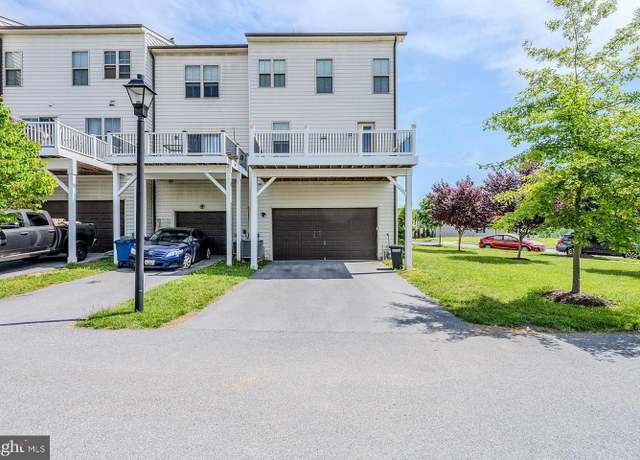 13750 Foggy Glen Dr, Silver Spring, MD 20906
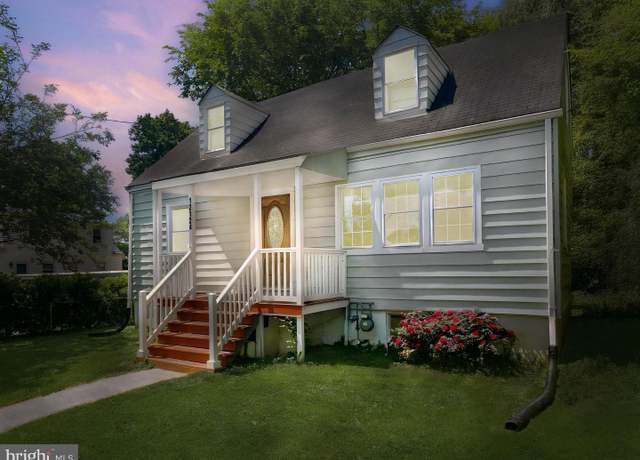 12124 Livingston St, Silver Spring, MD 20902
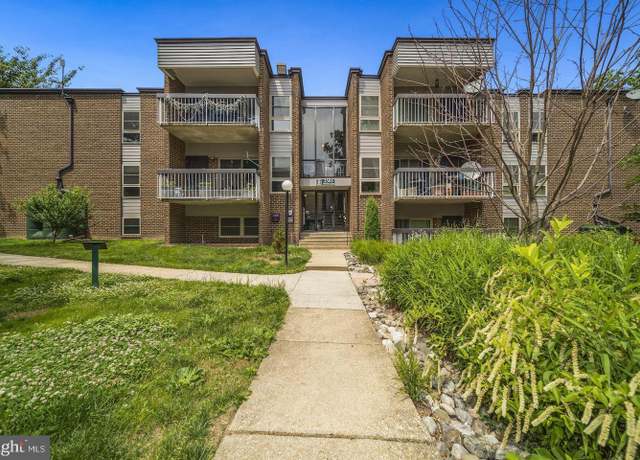 2305 Greenery Ln Unit T-3-3, Silver Spring, MD 20906
 13413 Autumn Ridge Ln, Silver Spring, MD 20906
 1105 Sweetbay Pl, Silver Spring, MD 20906
 2211 Greenery Ln Unit 103-6, Silver Spring, MD 20906
 13752 Night Sky Dr, Silver Spring, MD 20906
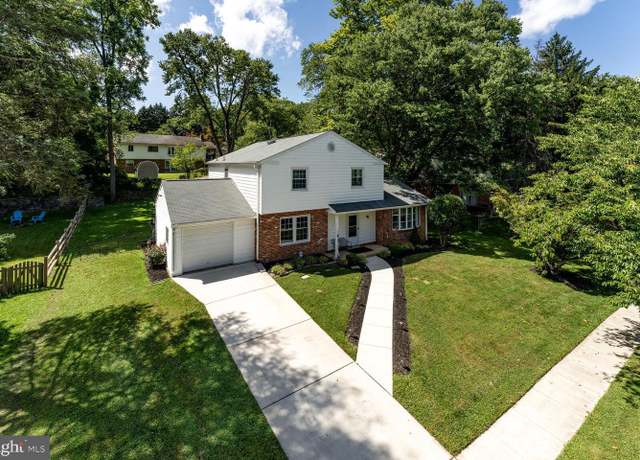 13102 Middlevale Ln, Silver Spring, MD 20906
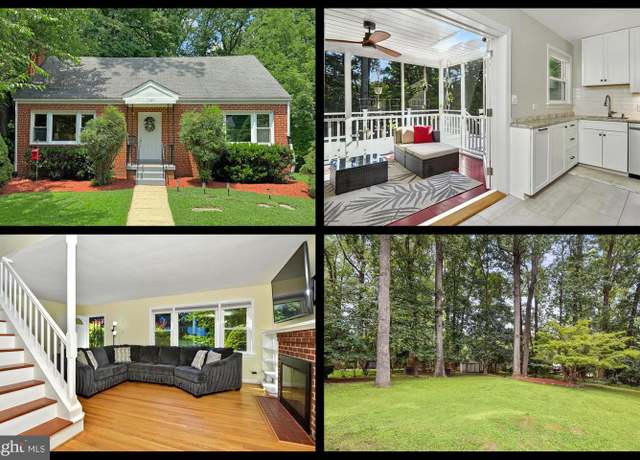 3109 Regina Dr, Silver Spring, MD 20906
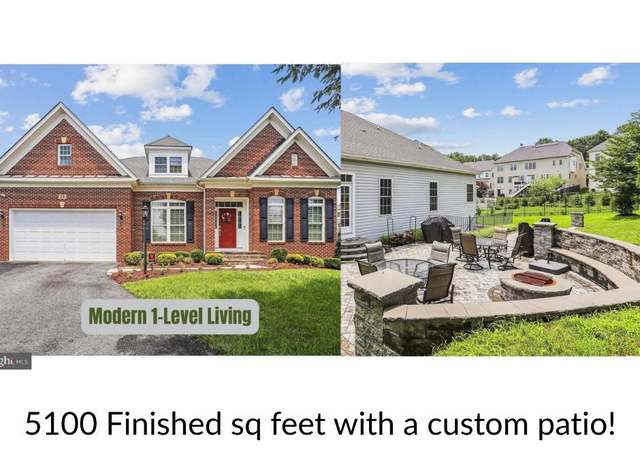 25 Moonlight Trail Ct, Silver Spring, MD 20906
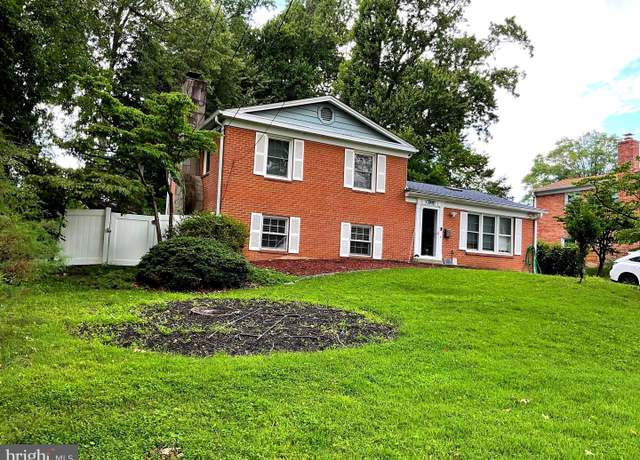 2615 Weller Rd, Silver Spring, MD 20906
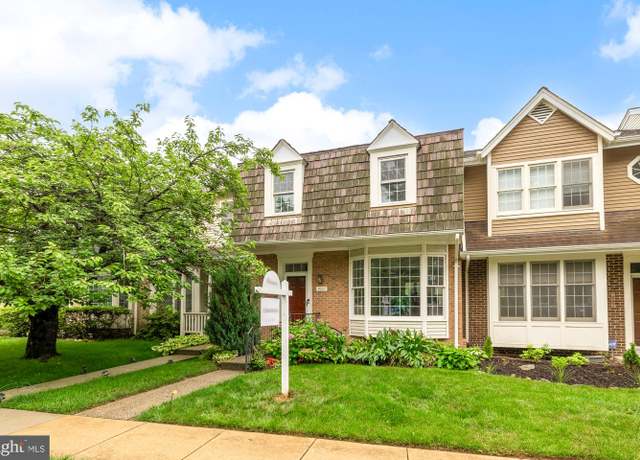 1937 Hickory Hill Ln, Silver Spring, MD 20906
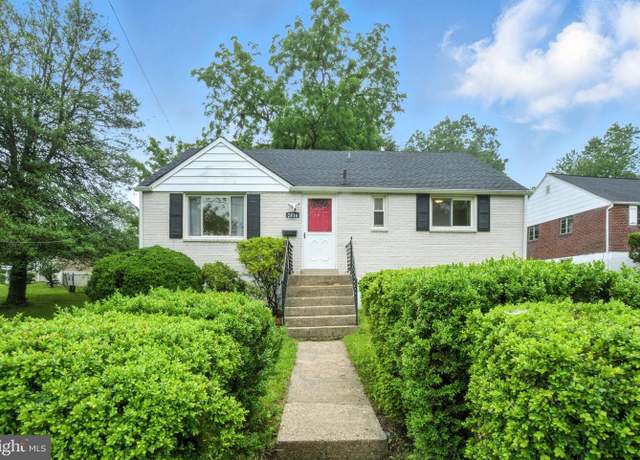 2816 Denley Pl, Silver Spring, MD 20906
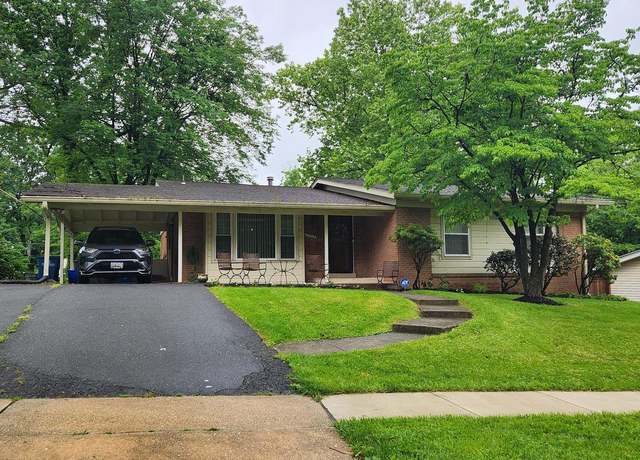 12912 Middlevale Ln, Silver Spring, MD 20906
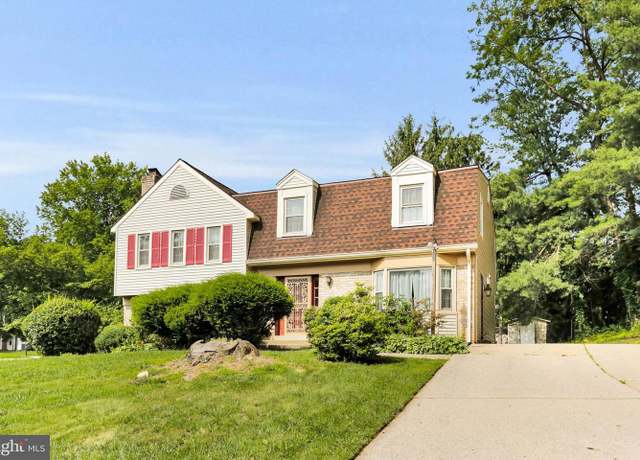 12608 Garden Gate Rd, Silver Spring, MD 20902
 2205 Greenery Ln Unit 104-9, Silver Spring, MD 20906
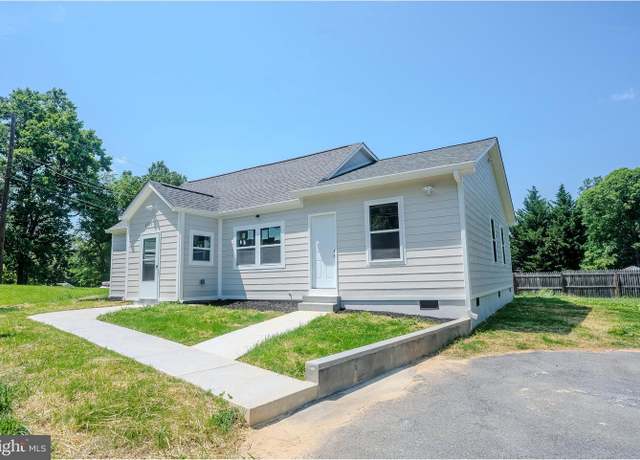 2201 Briggs Rd, Silver Spring, MD 20906
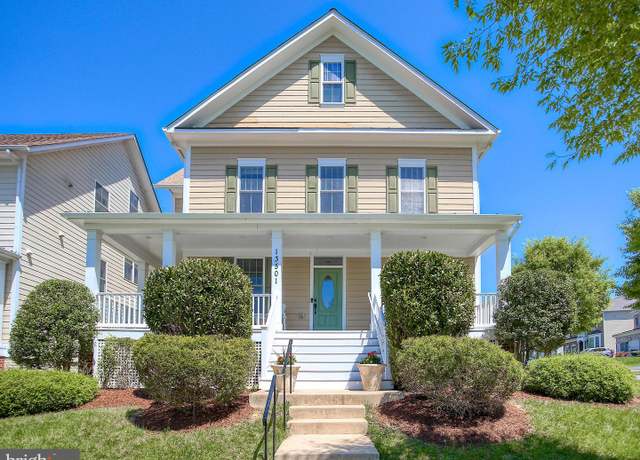 13501 Moonlight Trail Dr, Silver Spring, MD 20906
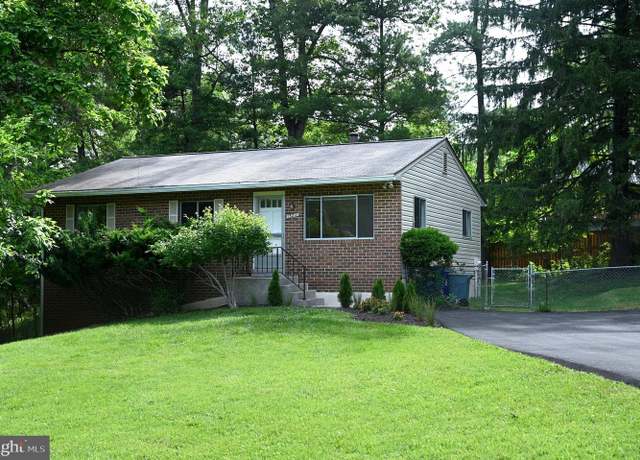 13211 Lutes Dr, Silver Spring, MD 20906
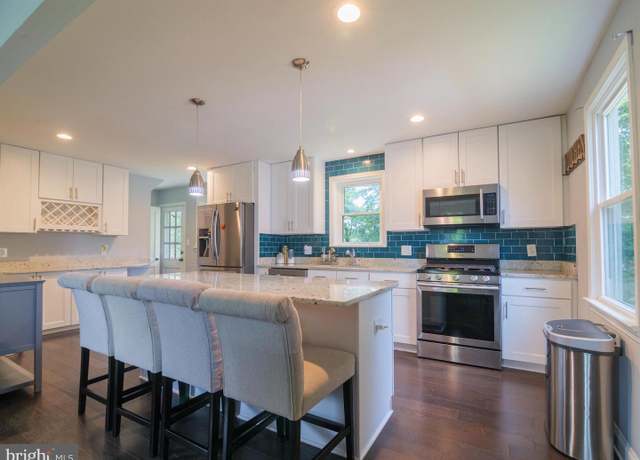 2509 Mason St, Silver Spring, MD 20902
 13304 Windy Meadow Ln, Silver Spring, MD 20906
 12212 Judson Rd, Silver Spring, MD 20902
 1547 Rabbit Hollow Pl, Silver Spring, MD 20906
 1539 Rabbit Hollow Pl, Silver Spring, MD 20906
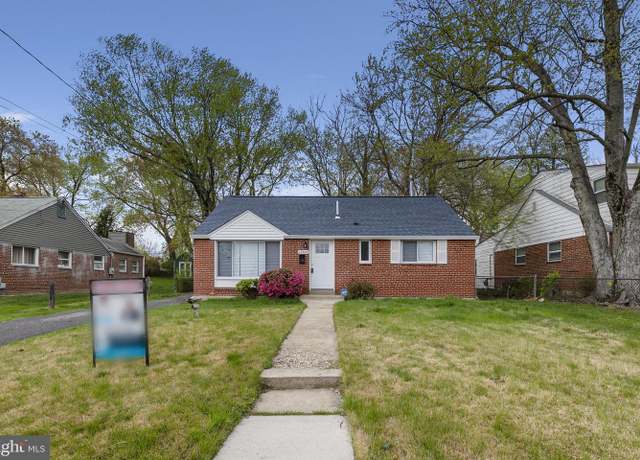 12509 Holdridge Rd, Silver Spring, MD 20906
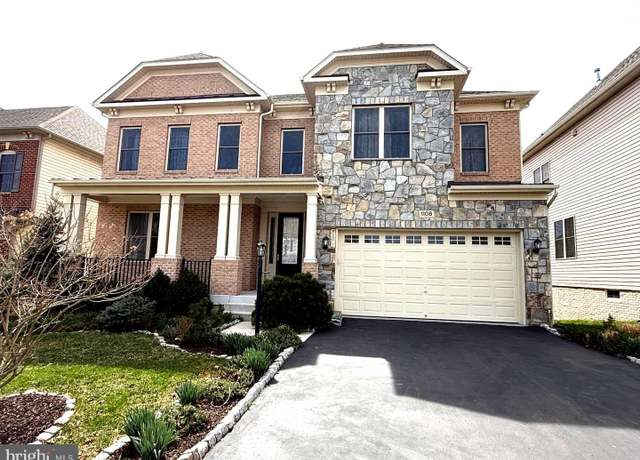 1108 Autumn Brook Ave, Silver Spring, MD 20906
- Median Sale Price
- # of Homes Sold
- Median Days on Market
Median Sale Price (All Home Types)
$570,000
-15.6% YoY | Jun 2025
- 1 year
- 3 year
- 5 year
About us
Find us
Subsidiaries
Copyright: © 2025 Redfin. All rights reserved.
Updated January 2023: By searching, you agree to the Terms of Use, and Privacy Policy.
Do not sell or share my personal information.
REDFIN and all REDFIN variants, TITLE FORWARD, WALK SCORE, and the R logos, are trademarks of Redfin Corporation, registered or pending in the USPTO.
California DRE #01521930
Redfin is licensed to do business in New York as Redfin Real Estate. NY Standard Operating Procedures
New Mexico Real Estate Licenses
TREC: Info About Brokerage Services, Consumer Protection Notice
Rocket Mortgage is an affiliated business of Redfin. All mortgage lending products and information are provided by Rocket Mortgage, LLC | NMLS #3030; www.NMLSConsumerAccess.org. Licensed in 50 states. This site is not authorized by the New York State Department of Financial Services for mortgage solicitation or loan applications activities related to properties located in the State of New York. For additional information on Rocket Mortgage or to receive lending services in the State of New York, please visit RocketMortgage.com.
Rocket Mortgage, LLC, Rocket Homes Real Estate LLC, Rocket Card, LLC, RockLoans Marketplace LLC (doing business as Rocket Loans), and Rocket Money, Inc., are separate operating subsidiaries of Rocket Limited Partnership. Redfin Corporation is an affiliated business of Rocket Limited Partnership. Each company is a separate legal entity operated and managed through its own management and governance structure. Rocket Limited Partnership is an indirect, wholly owned subsidiary of Rocket Companies, Inc. (NYSE: RKT).
If you are using a screen reader, or having trouble reading this website, please call Redfin Customer Support for help at 1-844-759-7732.
 REDFIN IS COMMITTED TO AND ABIDES BY THE FAIR HOUSING ACT AND EQUAL OPPORTUNITY ACT. READ REDFIN'S FAIR HOUSING POLICY AND THE NEW YORK STATE FAIR HOUSING NOTICE.
 United States
 Canada