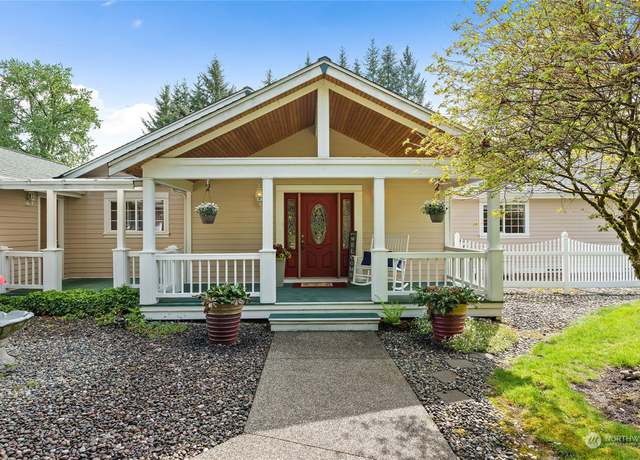
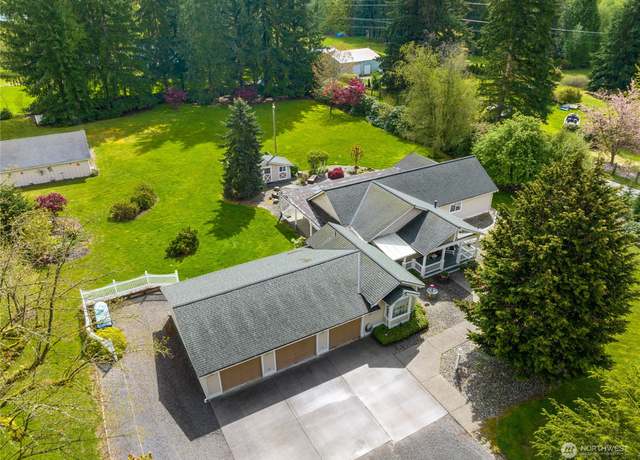
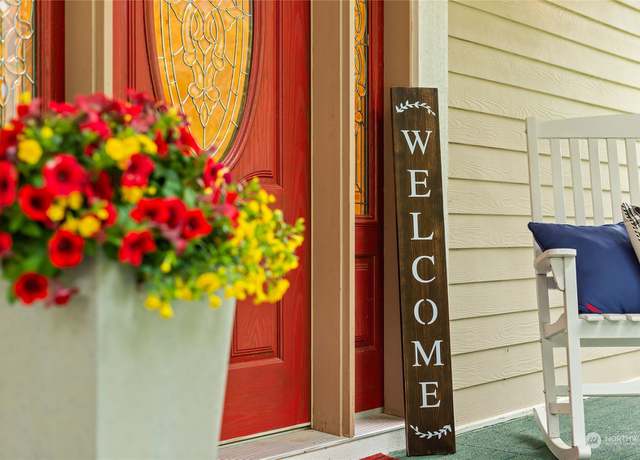
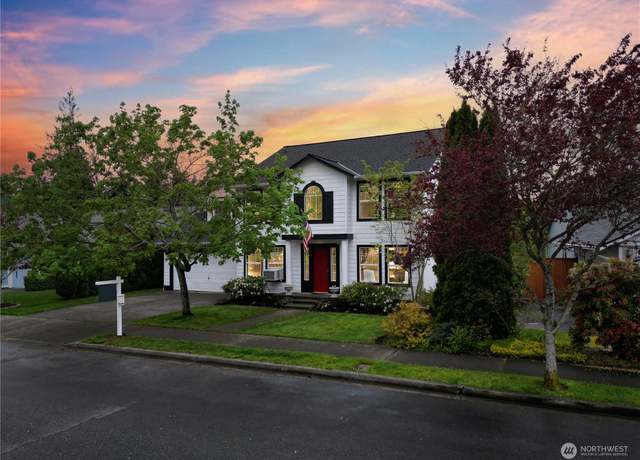
Immaculately maintaining home has been loved from the impeccable landscaping to beautifully remodeled kitchen & devoted annual maintenance. Entering you're welcomed by formal entry & vaulted ceilings which continue into living area, surrounded by windows giving the feeling of bright airiness. Recently refinished hardwood flrs throughout most of the home along with bright freshly remodeled kitchen. Featuring 2 primary BD. 1,200 SF 3 car garage. Covered patio offers tranquil place to relax. Separate 160 SF building for office, fitness room, artists studio, etc. Additional 1,200 SF separate building w/ single RV parking, room for yard equipment & insulated storage. All envelo
1/40
$950,000
3 beds3 baths4,632 sq ft2.97 acres (lot)
11522 228th St NE, Arlington, WA 98223
Listing provided by NWMLS as Distributed by MLS Grid
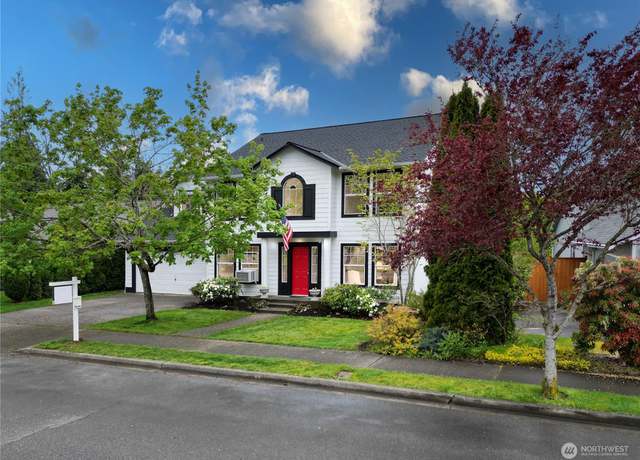
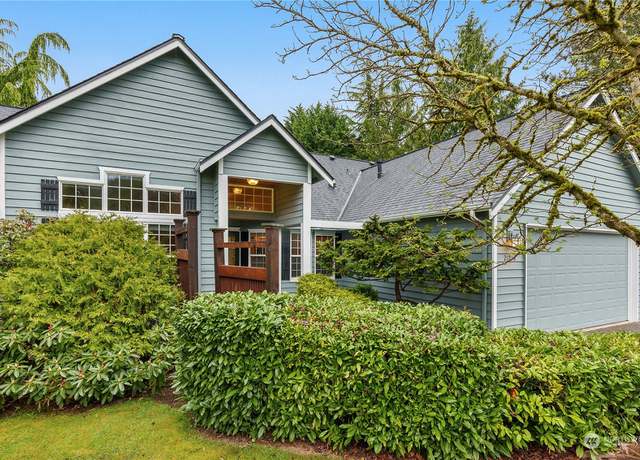
Charming home on a quiet cul-de-sac with large fully fenced backyard and 2-car garage. Formal living room, dining room and open concept kitchen with island and large breakfast area combined into the great room with fireplace. New roof, paint, carpet, flooring, trim and bath. Near 1-5, Hwy 9, Arlington airport, shopping, restaurants and more! Must see!
1/24
$740,000
5 beds2.5 baths2,352 sq ft7,405 sq ft (lot)
17720 Topper Ct, Arlington, WA 98223
Listing provided by NWMLS as Distributed by MLS Grid
Welcome home! This 3 Bed 1.75 Bath Rambler, situated on nearly 1 half acre flat lot, is nestled in the quiet cul-de-sac of Meadowbrook. Bright skylit Kitchen with Maple cabinetry, gas range, & new oven. Gas burning fireplace in Family Room. Spacious Living Room with soaring ceilings flooded with natural light. Primary Bedroom boasts dual shower head Bath. Gleaming hardwoods & custom tile work throughout. New Roof in 2022! Attached 2-car garage & additional driveway provide ample parking for RV's & toys. Fully fenced back yard with custom gate for your active pets. Professionally manicured landscaping & covered patio. Don't miss the 2 story shed for all your proj
1/40
$725,000
3 beds2 baths1,785 sq ft0.48 acre (lot)
21216 89th Ave NE, Arlington, WA 98223
Listing provided by NWMLS as Distributed by MLS Grid
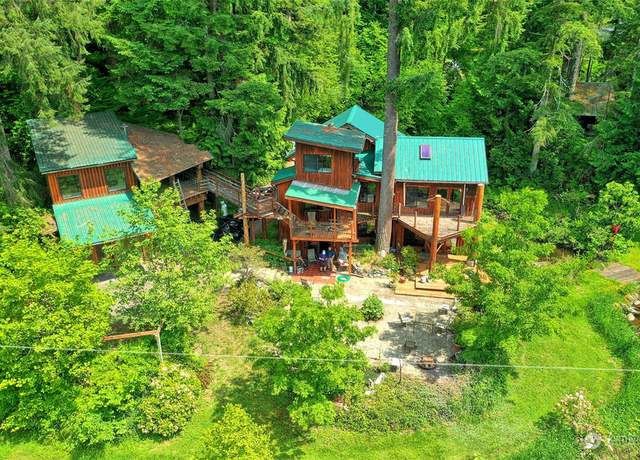
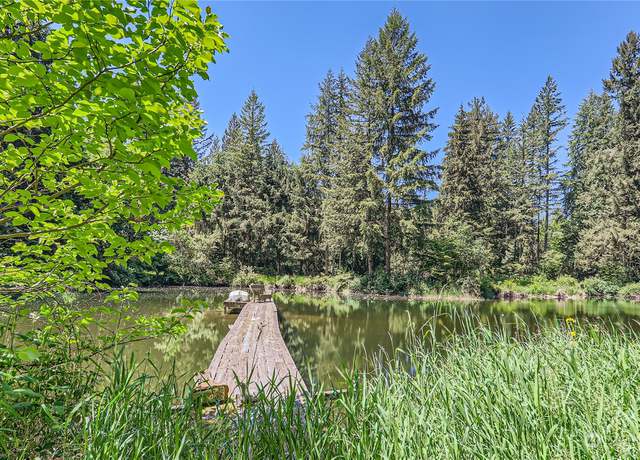
DREAM RETREAT! One-owner, this spacious 2-story home spans 2,276 SF on over 15 acres! Nestled alongside the picturesque Spring Lake, enjoy over 400 SF of low bank waterfront. Surrounded by tranquility, this secluded retreat boasts an additional two private lakes, RV parking, and 2 shops. Metal roof provides durability and longevity. Indulge in the jetted tub, bask in natural light streaming through skylights, or unwind in the solarium. Multiple decks offer serene outdoor spaces, and a private dock enhances waterfront living. Revel in the elegance of black marble flooring in the primary bathroom, complemented by stunning fir floors and ceramic tile throughout. Don't miss the opportunity to m
1/30
$1,300,000
4 beds2 baths2,276 sq ft15.13 acres (lot)
13721 Tastad Rd, Arlington, WA 98223
Listing provided by NWMLS as Distributed by MLS Grid
Looking for a new home. .. look no further. Introducing the New Redondo, a modernized 3 bedroom 2.5 bath townhome with an open concept design. The community is surrounded by a nature preserve which includes access to the Stillaguamish riverfront. This central location is only minutes to I-5 and features walkable access to nearby amenities. Our feature loaded townhomes include 9 ft ceilings, stainless-steel appliances, quartz countertops and more. Several builder incentives available. Only a few more homes remaining in the development – don’t miss the opportunity! Completed inventory available. If you are working with a licensed broker, please have your agent complete the Prospec
1/10
$519,900
3 beds2.5 baths1,520 sq ft2,677 sq ft (lot)
8402 Gilman Way, Arlington, WA 98223
Listing provided by NWMLS as Distributed by MLS Grid
Looking for a new home. .. look no further. Introducing the New Redondo, a modernized 3 bedroom 2.5 bath townhome with an open concept design. The community is surrounded by a nature preserve which includes access to the Stillaguamish riverfront. This central location is only minutes to I-5 and features walkable access to nearby amenities. Our feature loaded townhomes include 9 ft ceilings, stainless-steel appliances, quartz countertops and more. Several builder incentives available. Only a few more homes remaining in the development – don’t miss the opportunity! Completed inventory available. If you are working with a licensed broker, please have your agent complete the Prospec
1/10
$534,900
3 beds2.5 baths1,520 sq ft2,640 sq ft (lot)
8311 Gilman Way, Arlington, WA 98223
Listing provided by NWMLS as Distributed by MLS Grid
Discover serene suburban living on this 1 acer corner lot. Your own private spacious oasis surrounded by trees and mature landscaping. Nestled in a peaceful country setting, this home is conveniently located to experience the best of Arlington living with easy access to parks, schools, and shopping centers. Lot's of possibilities here for your imagination. Home and land priced to sell fast. This property will go quickly. Rehab loan or a perfect lot to rebuild your custom dream home. Check it out for yourself. Opportunities like this don't show up everyday. Level lot, fully fenced.
1/34
$440,000
3 beds2 baths1,460 sq ft1.00 acre (lot)
2514 188th St NE, Arlington, WA 98223
Listing provided by NWMLS as Distributed by MLS Grid
Welcome to The Lucky 13 Ranch. A premier horse facility on 14.46 acres located in Arlington WA. 69 stall dual isle barn, multiple wash racks, grooming bays, tack rooms, indoor restrooms, laundry room and offices. LARGE indoor arena 90x200 with sifted sand footing, Generous seasonal outdoor arena 150x300, large hay and shaving storage, 12 turnout paddocks with gravel footing and plenty of parking. This facility also includes a darling little 800 Sqft 2-bedroom 1.5 bath caretaker's apartment, kitchen w/ eating space, and cozy living room w/ fireplace. Location is minutes from I-5. Watch virtual tour and take in the beauty of the ranch.
1/40
$3,600,000
— beds— baths— sq ft
20004 43rd Ave NE, Arlington, WA 98223
Listing provided by NWMLS as Distributed by MLS Grid
The Natural light fills the interior spaces + expansive windows frame stunning natural private 5.01 acres that surrounds you in this Custom designed and stylish home incorporating wood + other elements. 25' Ceilings & Open great room living includes rock fireplace, dining & access to front and back outdoor spaces. Kitchen’s fixtures deliver everything a home chef could desire. Oversized Owners suite with large walk in closet + expertly appointed bath with exemplary finishes. A short walk down the driveway to your own private 268' river frontage will leave you feeling like you are far from home. Attached oversized 2-car garage. Everything has been carefully curated to provi
1/40
$975,000
3 beds2 baths2,364 sq ft5.01 acres (lot)
19702 106th Ave NE, Arlington, WA 98223
Listing provided by NWMLS as Distributed by MLS Grid
Step into warmth of single-level living at its finest! This condo is a true gem, designed w/ a sought-after 1-story layout exuding functionality & charm. Tucked away on a dead end str, this space offers generous sized light-filled rooms. W/ 2 bdrms, flexible bonus rm/office, & 2 baths, this home caters to your needs. Step out to the private balcony & soak in the serene views—a perfect spot to relax. Nestled in quiet 55+ community W/ well-managed HOA, you'll find peace of mind knowing that common area maintenance, water, & sewer are taken care of. Embrace your surroundings while still enjoying the convenience of being centrally located moments away from hospitals,
1/35
$499,000
3 beds2 baths1,324 sq ft
910 Medical Center Dr Unit G101, Arlington, WA 98223
Listing provided by NWMLS as Distributed by MLS Grid
Looking for a home in the Country? Look no further. This 3031 sq foot rambler has an updated kitchen, 2 master suits with walk in closets, 2 bedrooms with Jack and Jill bathroom, extra office space and enough room for everyone. Enjoy the large 5+ acre lot with outdoor storage, RV parking, and a treehouse with a zipline! This amazing home comes with a security system, Govee permanent outdoor lighting, 50 amp RV hookup, Level 2 EV charger, and a lot more.
1/30
$995,000
4 beds3.5 baths3,031 sq ft5.78 acres (lot)
13423 268th St NE, Arlington, WA 98223
Listing provided by NWMLS as Distributed by MLS Grid
Remarkably Designed home in sought after Viewmont Estates. This Craftsman design, stylishly incorporates wood + other elements. The Natural light fills the interior spaces + expansive windows frame the stunning natural surroundings. The open living style area includes fireplace, dining & access to upper deck. Kitchen’s high-end fixtures deliver the just right home chef experience. Owners suite boasts coffered ceilings with up lighting, loads of closet space + expertly designed bath. Enjoy the lower level open style flex area w/ wet bar & create that just right fit for a home gym, craft room, or extra living w/ its own entrance & access to the large back patio and yar
1/40
$1,350,000
4 beds4.5 baths3,985 sq ft1.01 acres (lot)
1104 278th St NE, Arlington, WA 98223
Listing provided by NWMLS as Distributed by MLS Grid
Turn of the century charmer ready for you, with a bedroom & bath on every floor! Graced with tall ceilings, ship lap & original molding, this home is sure to delight. Master suite is the entire upper floor, second floor family room & newly finished garden room on the main floor ensures there is room for everyone. Perched in a large lot with mountain views, outbuildings, & room for your RV AND boat. Newer roof, gutters. Walking distance to shopping & schools. This old town beauty will sell quickly!
1/40
$725,000
3 beds3 baths2,281 sq ft7,405 sq ft (lot)
114 N French Ave, Arlington, WA 98223
Listing provided by NWMLS as Distributed by MLS Grid
Rebecca of Sunnybrook farm! This quaint story book farm is waiting for you, the memories here will last a life time! 4.8 acres of pasture think pony's, horses, cows, pigs, chickens, and a rooster for an alarm clock! This home has had a complete remodel from ground up, everything new and permitted. 3 bedrooms, 2 bath, french doors that open to a trex deck looking out to your gorgeous property. Endless opportunity with the huge shop! Has its own 200 amp service and water connected. Possibility to covert 1200 sq ft of shop to ADU! The City of Arlington and Lakewood is booming! New High School, Amazon plant, shopping, restaurants all within 5 minutes! Close to I-5 going North and South. Make yo
1/33
$925,000
3 beds2 baths1,700 sq ft4.80 acres (lot)
18415 3rd Ave NE, Arlington, WA 98133
Listing provided by NWMLS as Distributed by MLS Grid
Escape to your own country oasis! This sprawling property boasts a spacious 5-bedroom, 3,916 sqft home nestled on 20 pristine acres of flat land. Experience the charm of rural living with top-notch amenities including a 6-stall barn, inviting in-ground pool, a separate 6-bay detached garage and shop, complete with a woodshop for hobbyists. Enjoy serene moments and revel in the privacy this retreat offers. Conveniently situated just minutes away from I-5, Lakewood High School, and shopping destinations, this haven combines tranquility with accessibility.
1/40
$1,699,999
5 beds3 baths3,916 sq ft20.90 acres (lot)
29 194th St NE, Arlington, WA 98223
Listing provided by NWMLS as Distributed by MLS Grid
Completely RENOVATED RAMBLER in the sought after golf course community of GLENEAGLE! This 3-bed, 2-bath, plus an office, home features an OPEN concept and desirable split floor plan! Professionally painted, luxury wood floors throughout, CUSTOM kitchen with 8-ft island and HUGE pantry, white quartz countertops, tile backsplash and new stainless appliances! Primary bedroom with private deck, ensuite bathroom with jetted tub and plumbing for stackable W/ D! New bathroom vanities with soft close doors/drawers, quartz countertops and shiplap! OVERSIZED utility room with tons of opportunity for customization! Newer 50-year Presidential roof and furnace! Corner lot with mature landscaping and pri
1/40
$740,000
3 beds2 baths1,850 sq ft0.25 acre (lot)
18304 Turnberry Pl, Arlington, WA 98223
Listing provided by NWMLS as Distributed by MLS Grid
Great rambler-style home in a convenient location! Offering 3 BD and 2 full baths, open living and dining area with vaulted ceilings, kitchen with dining area, laundry, storage, primary bedroom with its own bath and walk-in closet, garage & more! The home has been lovingly cared for and has just had the full interior painted and a new comp roof was installed 2 years ago. Gas furnace, water heater & gas cooking provide excellent energy efficiency. A new microwave was just installed. Outside you will appreciate the cute front yard & fenced backyard (low maintenance), storage shed & deck. Heartland Homes is a great neighborhood, Just minutes to I-5, Hwy 9, downtown Arli
1/28
$499,950
3 beds2 baths1,100 sq ft4,356 sq ft (lot)
19230 46th Ave NE, Arlington, WA 98223
Listing provided by NWMLS as Distributed by MLS Grid
Enjoy AFFORDABLE LIVING with just a little imagination & sweat equity! Airway Mobile Park 55+ community living offers a tranquil environment to come home to. Dedicated carport with multiple vehicle parking, ramp access to home, large serene backyard w/ room to garden, extra storage, & covered back deck. Community currently in the process of being connected to city sewer & road paved.
1/12
$52,500
2 beds1 bath728 sq ft
6206 188th St NE #69, Arlington, WA 98223
Listing provided by NWMLS as Distributed by MLS Grid
* * * PRICE REDUCTION * * * Welcome home to Highland View Estates! Great location, close to smokey point, I5 and Hwy9! This lovely home features vaulted ceilings, open kitchen w/ breakfast bar and nook, dining area, master with walk-in closet, and two more large bedrooms. This house has nice flow to it and feels spacious! Generously sized lot, fully fenced, lawn, large deck, and storage shed. Great location, great home, great price!
1/34
$574,999
3 beds2 baths1,542 sq ft8,276 sq ft (lot)
17606 Highland View Dr, Arlington, WA 98223
Listing provided by NWMLS as Distributed by MLS Grid
Nestled within the prestigious gated community of Eagle Ridge in Snohomish County, this exquisite custom-built residence captures attention with its meticulous craftsmanship and serene park-like surroundings. New updates include a new roof, fresh paint, driveway, and walkways that showcase the property. Recently completed, the lower level features a stunning bathroom, sauna, space for an additional room, wine storage & rec room. The grandeur of soaring ceilings, intelligently designed floor plans, and scenic vistas make a lasting impression. The main level encompasses a bedroom office, formal living and dining rooms, and a chef's kitchen adorned with striking quartz countertops and st
1/36
$1,050,000
4 beds3.5 baths4,215 sq ft5.06 acres (lot)
5018 226th Pl NE, Arlington, WA 98223
Listing provided by NWMLS as Distributed by MLS Grid
Unveil the full potential of this 80-acre farmhouse, barndominium and bring it back to its former glory. Whether you want to start a hobby farm, create a wedding venue with stunning views, equestrian haven, or help a furry friend with a rescue sanctuary, you have lots of room for that & more! Or use it as your personal oasis & host special gatherings amid the scenic backdrop! The home offers 3 beds, 2.5 baths, a spacious kitchen, and a river rock fireplace. Delight in the stream, 2 ponds, windmill, & sports court! Plus, utilize 4 outbuildings for RV/car storage, livestock, garden center, dog kennels, or. .. ? Nurture your farmhouse dream & fill this land with the atte
1/18
$1,500,000
4 beds2.5 baths5,404 sq ft80.00 acres (lot)
18210 3rd Ave NE, Arlington, WA 98223
Listing provided by NWMLS as Distributed by MLS Grid
Yes, over 4.5 acres within the city limits of Arlington PLUS three homes! TLC will reward the entrepreneur with vision. City water installed, city sewer scheduled with road improvements soon. Zoned 7200. Per Snohomish County 6905 is 2 bd 1 bth 636 sq ft built in 1960, 6909 is 1 bd 1 bth 538 sq ft built in 1951 and 6921 is 3 bd 1 bth 995 sq ft built in 1901. The potential for those that can think out of the box is great. Topography and condition of homes will need creative solutions. Continue with existing tenants, rehab and sell separately, tear down and build new, TDR or? Potential for testamentary segregation prior to sale. Seller makes no warranty, buyer to explore opportunities to their
1/16
$775,000
3 beds1 bath995 sq ft4.86 acres (lot)
6921 211th Pl NE, Arlington, WA 98223
Listing provided by NWMLS as Distributed by MLS Grid
Welcome to your own private, 5-ACRE OASIS, with amazing mountain VIEWS! Perched up on the hill near Silvana, this 1,850 sq ft home features a fully PERMITTED one-story ADU, heated SHOP and in-ground swimming POOL with slide! Property extends well beyond the fenced yard and could be cleared for more pasture area or kept as-is for added PRIVACY. Open concept main house with 4-season sunroom and extensive patio area, perfect for year-round entertaining! Attached 800 sq ft MIL provides for MULTIGENERATIONAL living or INCOME property! Hot tub, outdoor shower and turfed dog run too! Enjoy the fire pit, garden space, fruit trees and greenhouse! Heat pump and generator ready! Unique community of E
1/40
$1,100,000
4 beds3.5 baths2,650 sq ft5.00 acres (lot)
21012 6th Ave NW, Arlington, WA 98223
Listing provided by NWMLS as Distributed by MLS Grid
Introducing the New Redondo, a modernized 3-bedroom 2.5 bath townhome with an open concept design. This new-construction home by LGI Homes is located on a corner lot. The community is surrounded by a nature preserve which includes access to the Stillaguamish riverfront. This central location is only minutes to I-5 and features walkable access to nearby amenities. Our feature loaded townhomes include 9 ft ceilings, stainless-steel appliances, quartz countertops and more. Several builder incentives available. Don’t miss the opportunity! Completed inventory available. If you are working with a licensed broker, please have your agent complete the Prospect Registration Agreement ( * Site R
1/10
$534,900
3 beds2.5 baths1,520 sq ft2,269 sq ft (lot)
8303 Gilman Way, Arlington, WA 98223
Listing provided by NWMLS as Distributed by MLS Grid
Brand new 4-bedroom/2.5-bathroom townhome located in a corner lot with expansive entertaining areas! The kitchen has an island & luxury plank flooring. Upstairs, 4 beautiful bedrooms offer closet space & versatility to use as you wish. A loft includes access to a private balcony & makes a great place for your work area or exercise bike. Enjoy the serenity of homeownership at Gilman Walk! If you are working with a licensed broker, please complete the Prospect Registration Agreement ( * Site Registration Policy #4898) & submit prior to your first visit to the Gilman Walk Information Center.
1/11
$549,900
4 beds2.5 baths1,719 sq ft3,348 sq ft (lot)
8301 E Gilman Ave, Arlington, WA 98223
Listing provided by NWMLS as Distributed by MLS Grid
Stunning 3 bedroom 2.5 bathroom home on 5.6 acres. Living space with vaulted ceilings, decks off of the dining room and kitchen, hardwood floors and picture windows to enjoy the beautiful panoramic sunset view. Enjoy your kitchen with granite countertops, new dishwasher and microwave, eating space and vintage wood stove that you can cook on. Finished basement with wet bar that opens up to the well maintained front yard with stairs down to the orchard, greenhouse and newly updated barn. Enjoy your outdoor stone wood fire pizza oven. New water filtration system and new forced air furnace, a/c, & heat pump. Newly paved blacktop driveway. Don't miss out on this well maintained home!
1/30
$1,150,000
3 beds3 baths2,346 sq ft5.00 acres (lot)
6822 168th St NE, Arlington, WA 98223
Listing provided by NWMLS as Distributed by MLS Grid
This beautiful open concept rambler on over 1 acre is better than new with extra finishes. Great room is all open to kitchen and dining with den and 2 additional bedrooms. Island kitchen with walk in pantry and oversized laundry. Covered patio with outdoor fireplace for chilly evenings. Guest bedrooms share a Jack and Jill bath for privacy plus a 1/2 bath. Owners suite with extra large walk in closet.
1/17
$1,390,000
3 beds3 baths2,509 sq ft1.00 acre (lot)
11327 143rd Dr NE, Lake Stevens, WA 98258
Listing provided by NWMLS as Distributed by MLS Grid
Welcome to this beautiful corner lot home overlooking the serene greens of the golf course! Step into modern luxury w/ this fully updated 3-bed & 3 bath home that boasts a range of appealing features. As you enter, you'll be greeted by a spacious & bright living area showcasing brand-new flooring throughout the home. The heart of the home, the kitchen, has been completely renovated w/ contemporary finishes, like waterfall countertops, SS appliances, & stylish cabinetry. The extra-large primary bedroom is a true retreat w/ its private deck overlooking the golf course. Imagine waking up to stunning views & enjoying morning coffee in a peaceful setting. The backyard open
1/31
$600,000
3 beds2.5 baths1,592 sq ft5,663 sq ft (lot)
8321 Putters Ct, Arlington, WA 98223
Listing provided by NWMLS as Distributed by MLS Grid
Secluded charm awaits in this picturesque woodland retreat! Embrace tranquility in this freshly updated haven boasting new paint, trim, and retextured walls throughout. Make this home uniquely yours with two upstairs bonus rooms. Nestled amidst nature's embrace, discover the epitome of comfort with a brand-new heat pump ensuring year-round coziness. There’s room for all your all of your vehicles and outdoor gear on this level lot of over 3/4 acres. The large, detached garage is ready to be transformed into the shop of your dreams. With serene surroundings and modern upgrades, this enchanting abode offers the perfect blend of rustic allure and contemporary convenience. Welcome home to
1/40
$599,950
2 beds1.5 baths1,888 sq ft0.78 acre (lot)
31005 378th Ave NE, Arlington, WA 98223
Listing provided by NWMLS as Distributed by MLS Grid
Remarkable 4 bedroom, 2.75 bathrooms property with vast potential! A spacious home with, breathtaking mountain views, expansive acreage, and impressive outbuildings. 30x60 shop and 30x36 covered RV/boat storage, lots of space here. updated bathrooms with stylish tiles, new flooring, freshly painted inside. . Rural living w/ excellent access to I-5, 7 Lakes, Shopping and Medical.
1/29
$920,000
4 beds3 baths3,159 sq ft3.79 acres (lot)
206 172nd St NW, Arlington, WA 98223
Listing provided by NWMLS as Distributed by MLS Grid
[A BEAUTIFUL LIFE]Introducing a modern OASIS in the heart of Arlington, this exquisite 3-bdrm townhouse epitomizes URBAN luxury living. Nestled in a vibrant community, this meticulously crafted residence offers a harmonious blend of comfort, style, & convenience. You're greeted by an inviting ambiance that seamlessly combines contemporary design w/ practical functionality. Open-concept layout creates an airy atmosphere, perfect for both relaxing evenings & entertaining guests. Retreat to the luxurious primary suite, where TRANQUILITY awaits w/ its plush carpeting, generous closet space, & spa-like ensuite bathrm. 2 add. bdrms provide versatility & flexibility, w/ each
1/25
$520,000
3 beds2.5 baths1,429 sq ft1,742 sq ft (lot)
8803 E Gilman Ave, Arlington, WA 98223
Listing provided by NWMLS as Distributed by MLS Grid
Discover the exceptional Rialto, a modernized 4 bedroom, 2.5 bathroom townhome with expansive entertaining areas. With convenient access to both I-5 and WA-9 providing easy access to the employment and industry of Marysville and Everett in minutes. This new-construction home by LGI Homes is located on a corner lot with a private fence in the backyard. You will love spending time in the spacious kitchen which comes equipped with all new Whirlpool brand appliances, white wood cabinetry and quartz countertops. If you are working with a licensed broker, please complete the Prospect Registration Agreement ( * Site Registration Policy #4898) & submit prior to your first visit to the Gilman
1/12
$554,900
4 beds2.5 baths1,719 sq ft4,168 sq ft (lot)
8301 Gilman Way, Arlington, WA 98223
Listing provided by NWMLS as Distributed by MLS Grid
Welcome to this adorable country home! This fully fenced gated property features 3 bedrooms, 2 bathrooms, & a cozy woodstove. The property also includes a 4 stall barn with a tack room & a large hay area to hold 5 tons of hay. Additionally, there is a 2 bay shop with space for tractor storage or shavings, a huge chicken coop, & a woodshed. Enjoy the great outdoors on the trex front deck or soak in the hot tub off the primary bedroom. You can even ride your horses up 91st & get permission from the landowner to cross onto the Tree Farm. It's less than a 5-minute trailer ride to Udell or Morgan Horse Club & only 7-10 minutes to Bracken Road. Custom knotty alder door
1/30
$900,000
3 beds2 baths1,400 sq ft10.00 acres (lot)
9026 Grandview Rd, Arlington, WA 98223
Listing provided by NWMLS as Distributed by MLS Grid
Move in ready rambler on a nearly 1 acre parcel in fantastic location. Home features 1,788 sq. ft. of one level living space w/ flowing layout. Spacious living room w/ cozy wood stove. Full dining room. Kitchen w/ matching appliances. Primary suite w/ full bath & 2 additional generous size bedrooms. Full guest bathroom. Full laundry room. Detached 480sq. ft shop/garage. Desirable Arlington school district! Very easy commute to I5/Hw9, shopping, dining, sport fields, Smokey Point & more! Tons of space to farm & play. Lots of parking & space for the boat or RV.
1/42
$695,000
3 beds2 baths1,788 sq ft0.88 acre (lot)
15007 67th Ave NE, Arlington, WA 98223
Listing provided by NWMLS as Distributed by MLS Grid
A must see! 3 bedroom, 2 bath home with updated flooring, paint, plumbing, appliances, kitchen cabinets and doors. These 2 lots are fully fenced and have plenty of room for all of your toys. Detached MIL has 1 bedroom and 1 full bath with additional storage upstairs. Jordan River Trails Community boasts a heated pool, 2 clubhouses, playground, river access at the county park and a free parking pass to enjoy everything the river has to offer.
1/33
$479,000
3 beds2 baths1,188 sq ft0.42 acre (lot)
16133 Dogwood Ln, Arlington, WA 98223
Listing provided by NWMLS as Distributed by MLS Grid
Escape to the coveted Kackman Creek Community in picturesque Arlington where natures allure beckons. This magnificent home rests on a multi-acre retreat offering serenity and a gateway to natural splendor. Breathtaking vistas unfold—walking trails a tranquil pond and a meandering creek—inviting immersion in the beauty. Inside find a sanctuary marrying elegance with comfort. Open living areas bathe in natural light creating an inviting atmosphere. Retreat to peaceful bedrooms or gather in the elegant kitchen with custom cabinetry and top-of-the-line appliances. Expansive decks call for outdoor entertaining amidst natures symphony. This residence seamlessly blends privacy tranquil
1/40
$839,000
3 beds2 baths2,356 sq ft3.66 acres (lot)
25415 23rd Ave NE, Arlington, WA 98223
Listing provided by NWMLS as Distributed by MLS Grid
Owner Financing for this Duplex Great location, Open floor plan, both units have 2 bedroom, 2 bath open floor plan with newer appliances, washer and dryer, deck off the fenced backyard for privacy, garden space and large deck. 1 car garage with each unit, additional parking for 1 more car, paved driveway. Well maintained duplex with 3 year old roof. close to town, medical and hospital. Owner financing only, 25% down and 7% interest. Units have always been occupied.
1/28
$799,950
4 beds4 baths1,746 sq ft0.58 acre (lot)
21312 87th Ave NE Unit 1&2, Arlington, WA 98223
Listing provided by NWMLS as Distributed by MLS Grid
Welcome to your dream home in Arlington! This magnificent corner lot offers a spacious living experience. With its expansive layout this 2400sf home is perfect for those seeking ample space. This design seamlessly connects the kitchen, dining room, & family room, creating a warm and inviting atmosphere for gatherings or everyday living. The huge kitchen is a chef's delight, featuring a gas stove, center island & ample counter space. The upper level boasts 4 large bedrooms including a primary suite that is a true oasis, complete with a spacious layout, walk-in closet & 5 piece ensuite bathroom. The laundry room is conveniently located upstairs along with a guest bathroom tha
1/28
$745,000
4 beds2.5 baths2,400 sq ft6,970 sq ft (lot)
8330 193rd St NE, Arlington, WA 98223
Listing provided by NWMLS as Distributed by MLS Grid
Two story, 24' x 48' (2304 sq ft), split level house with new roof and large deck off back. The deck has stairs that lead down to the backyard. The septic and drain field behind the house was recently pumped. New water heater installed to code. Fully fenced yard. There are a number of buildings once used for chicken coops but currently are storage. House overlooks large orchard and pastures to West and view rises to the mountains in the East. Large level asphalt driveway to front of house with lots of parking for cars or RVs. 1.14 acre lot is part of a larger 5 acre estate. The adjacent 3.86 parcel has a shop and numerous fruit trees and timber. The two can be purchased together or individu
1/19
$1,050,242
3 beds2 baths2,304 sq ft5.00 acres (lot)
15413 Jordan Rd, Arlington, WA 98223
Listing provided by NWMLS as Distributed by MLS Grid
Fully updated home! 3 Bedroom 2.75 Bath home on 1 plus Acres! Almost new EVERYTHING! Quartz countertops & stainless steel appliances. Updated baths! Interior recently upgraded w/ new cabinets, doors & trim, wood & vinyl laminate, carpet, fixtures & Interior/Exterior paint. New roof & gutters! Wet bar in basement as well as large open area for entertainment. 3 bedroom septic. 2 additional rooms downstairs could be used as bedrooms/office. Large deck off main living area redone. Large storage room w/ Shelving. Mature landscaping!
1/39
$799,999
3 beds3 baths3,044 sq ft1.11 acres (lot)
18628 Jordan Rd, Arlington, WA 98223
Listing provided by NWMLS as Distributed by MLS Grid
Based on information submitted to the MLS GRID as of Wed May 01 2024. All data is obtained from various sources and may not have been verified by broker or MLS GRID. Supplied Open House Information is subject to change without notice. All information should be independently reviewed and verified for accuracy. Properties may or may not be listed by the office/agent presenting the information. Some IDX listings have been excluded from this website.
This area's enrollment policy is not based solely on geography. Please check the school district website for more information.
Elementary schools
Middle schools
High schools
GreatSchools Summary Rating
7/10
Kent Prairie Elementary School
Public, PreK-5
5/10
Pioneer Elementary School
Public, K-5
5/10
Stillaguamish School
Public, K-12 • Choice school
4/10
Presidents Elementary School
Public, PreK-5
4/10
Eagle Creek Elementary School
Public, K-5
Only showing 5 of
6 elementary schools.
School data is provided by GreatSchools, a nonprofit organization. Redfin recommends buyers and renters use GreatSchools information and ratings as a first step, and conduct their own investigation to determine their desired schools or school districts, including by contacting and visiting the schools themselves.Redfin does not endorse or guarantee this information. School service boundaries are intended to be used as a reference only; they may change and are not guaranteed to be accurate. To verify school enrollment eligibility, contact the school district directly.
Arlington, Washington offers a variety of transportation options to its residents. The city experiences moderate traffic levels, making it convenient for car owners to drive around. Public transportation is also available, with buses being a common mode of transport. In terms of road infrastructure, Arlington is well-connected with nearby highways and freeways, facilitating easy commutes to and from the city. Learn more on our Arlington city guide.
What types of properties are available in Arlington?
Arlington, Washington offers a variety of single-family home types, including ranch-style, split-level, and contemporary homes. These homes can be found throughout the city, with some located in established neighborhoods and others in newer developments. Most properties feature 3-4 bedrooms and were built within the past 10-20 years. To explore different property types for sale in Arlington, Washington, use the 'Home type' filter located above the active listings. Customize your search by selecting options like single-family homes, condos, townhomes, and more.
What is life like in Arlington?
Arlington, Washington offers a serene and picturesque living environment with its breathtaking landscape. The region boasts a variety of natural wonders, from lush forests to pristine lakes and rivers. The weather in Arlington is characterized by mild summers and cool winters, providing a pleasant climate for outdoor activities year-round. The area provides a range of job opportunities across different sectors, ensuring a diverse and thriving economy. Residents can enjoy a plethora of recreational options, such as hiking, fishing, and boating, making it an ideal place for adventure enthusiasts.
What are the schools and amenities like in Arlington?
Arlington, Washington boasts a variety of public amenities for its residents. There are numerous restaurants offering a wide range of cuisines to satisfy diverse culinary preferences. The city is home to several parks, providing open spaces for relaxation and recreation. For everyday needs, there are multiple grocery stores conveniently located throughout Arlington. Additionally, the city offers other amenities such as libraries, fitness centers, and shopping outlets for the convenience and enjoyment of its residents.
In the past month, 21 homes have been sold in Arlington. In addition to houses in Arlington, there was also 1 condo, 11 townhouses, and 1 multi-family unit for sale in Arlington last month. Arlington is a minimally walkable city in Snohomish County with a Walk Score of 26. Arlington is home to approximately 17,464 people and 7,874 jobs. Find your dream home in Arlington using the tools above. Use filters to narrow your search by price, square feet, beds, and baths to find homes that fit your criteria. Our top-rated real estate agents in Arlington are local experts and are ready to answer your questions about properties, neighborhoods, schools, and the newest listings for sale in Arlington. Our Arlington real estate stats and trends will give you more information about home buying and selling trends in Arlington. If you're looking to sell your home in the Arlington area, our listing agents can help you get the best price. Redfin is redefining real estate and the home buying process in Arlington with industry-leading technology, full-service agents, and lower fees that provide a better value for Redfin buyers and sellers.


 REDFIN IS COMMITTED TO AND ABIDES BY THE FAIR HOUSING ACT AND EQUAL OPPORTUNITY ACT. READ REDFIN'S FAIR HOUSING POLICY AND THE NEW YORK STATE FAIR HOUSING NOTICE.
 United States
 Canada