 2015 Terry Ave #411, Seattle, WA 98121
 2015 Terry Ave #411, Seattle, WA 98121
 2015 Terry Ave #411, Seattle, WA 98121
 121 Stewart St #2506, Seattle, WA 98101
 121 Stewart St #2506, Seattle, WA 98101
 121 Stewart St #2506, Seattle, WA 98101
 900 Lenora St Unit W901, Seattle, WA 98121
 900 Lenora St Unit W901, Seattle, WA 98121
 900 Lenora St Unit W901, Seattle, WA 98121
 1900 Alaskan Way #502, Seattle, WA 98101
 1900 Alaskan Way #502, Seattle, WA 98101
 1900 Alaskan Way #502, Seattle, WA 98101
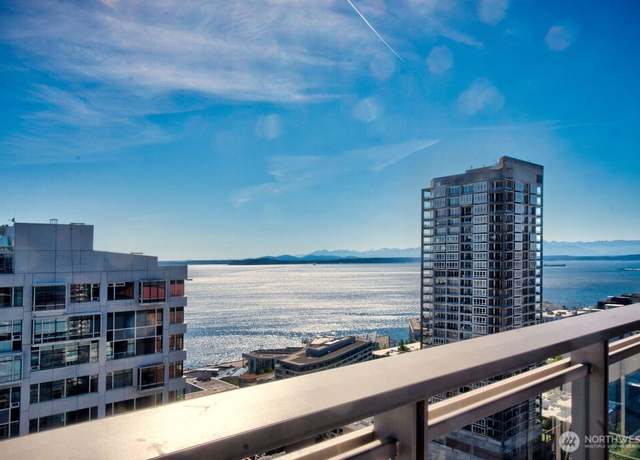 2033 2nd Ave #2010, Seattle, WA 98121
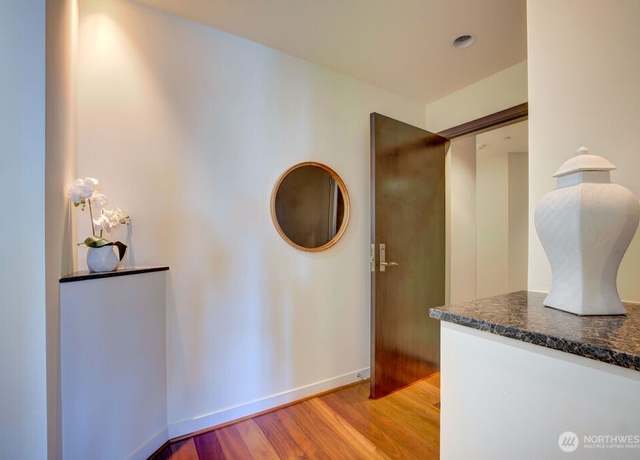 2033 2nd Ave #2010, Seattle, WA 98121
 2033 2nd Ave #2010, Seattle, WA 98121
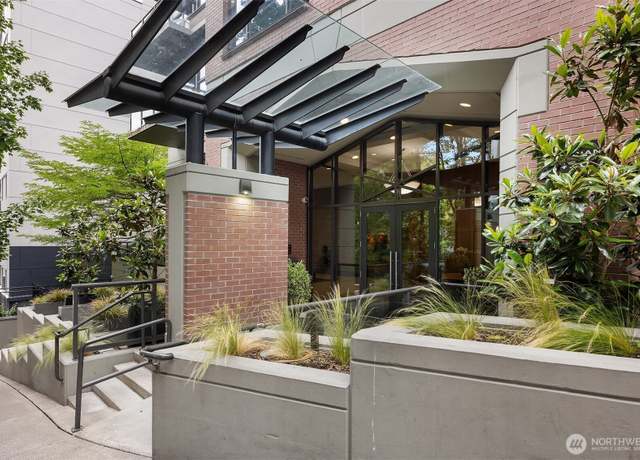 1420 Terry Ave Unit OU, Seattle, WA 98101
 1120 8th Ave #1004, Seattle, WA 98101
 2510 6th Ave #3507, Seattle, WA 98121
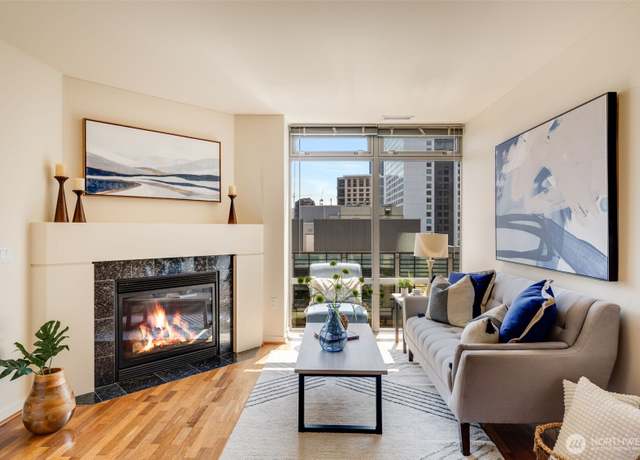 819 Virginia St #2505, Seattle, WA 98101
 2510 6th Ave #3106, Seattle, WA 98121
 121 Stewart St #2204, Seattle, WA 98101
 583 Battery St Unit 406N, Seattle, WA 98121
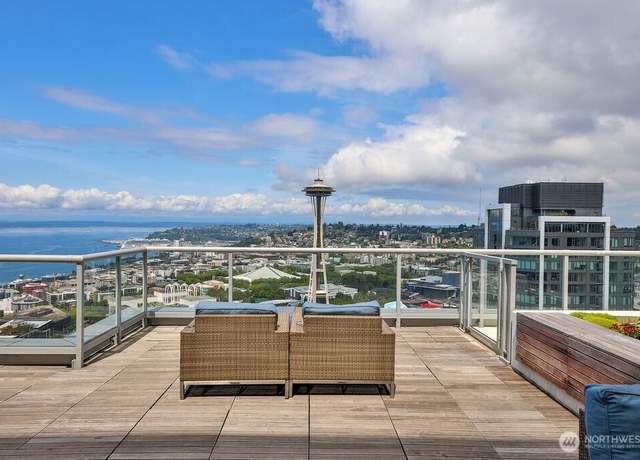 583 Battery St Unit 1908N, Seattle, WA 98121
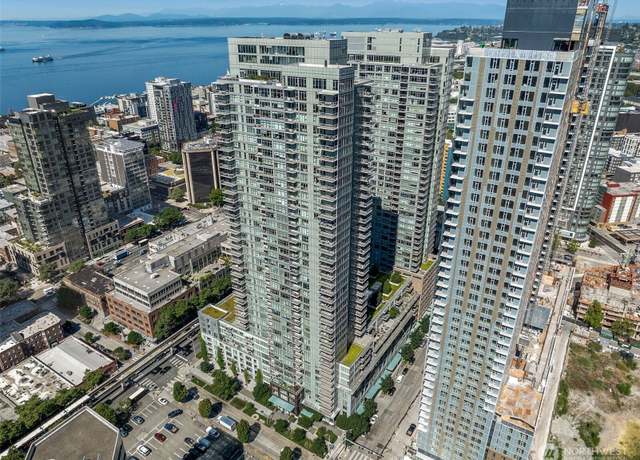 588 Bell St Unit 606S, Seattle, WA 98121
 1425 Western Ave Unit L308, Seattle, WA 98101
 2801 1st Ave #807, Seattle, WA 98121
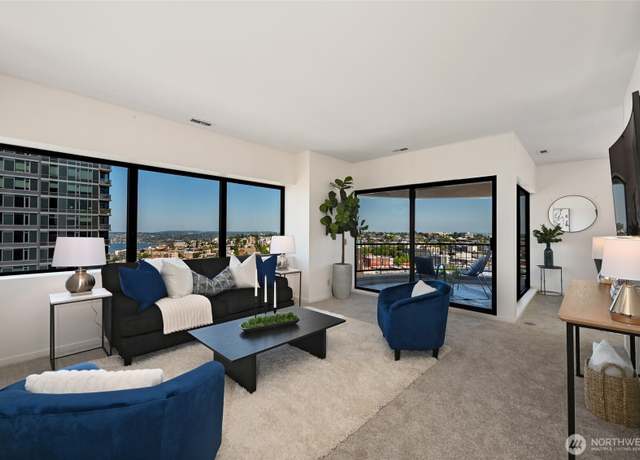 1301 Spring St Unit 17A, Seattle, WA 98104
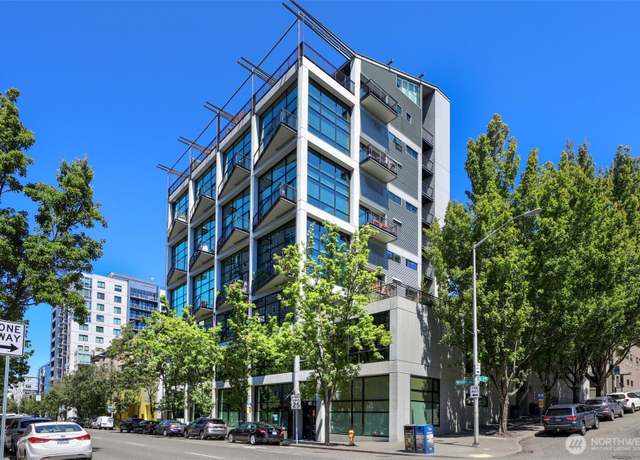 80 Vine St #703, Seattle, WA 98121
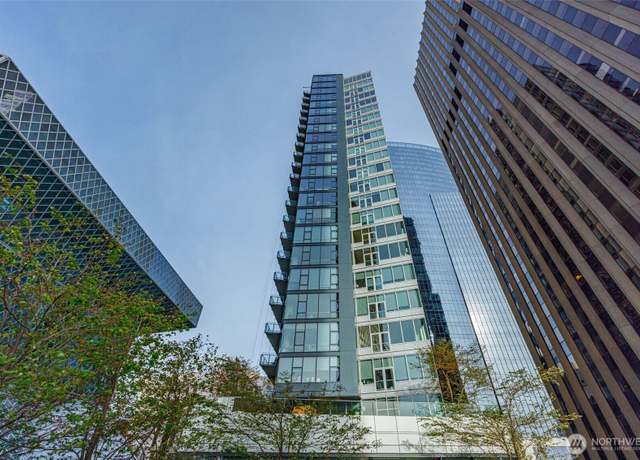 909 5th Ave #804, Seattle, WA 98164
 2607 Western Ave #202, Seattle, WA 98121
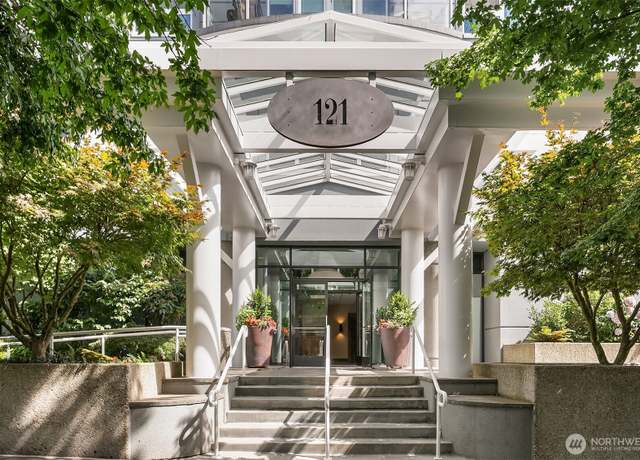 121 Vine St #2304, Seattle, WA 98121
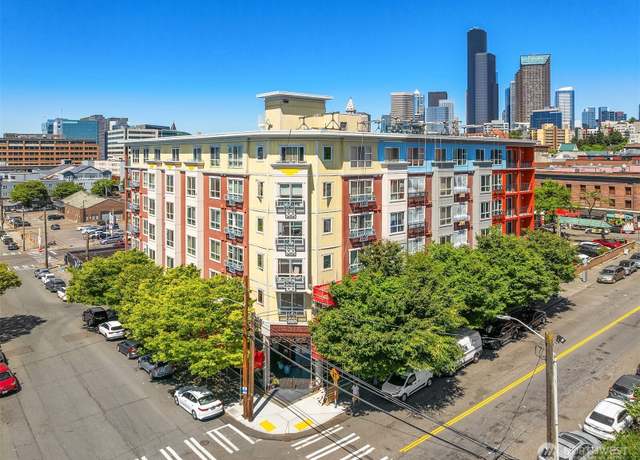 668 S Lane St #310, Seattle, WA 98104
 1420 Terry Ave #2504, Seattle, WA 98101
 1920 4th Ave #1702, Seattle, WA 98101
 1507 Western Ave #502, Seattle, WA 98101
 2201 3rd Ave #1303, Seattle, WA 98121
 1420 Terry Ave #904, Seattle, WA 98101
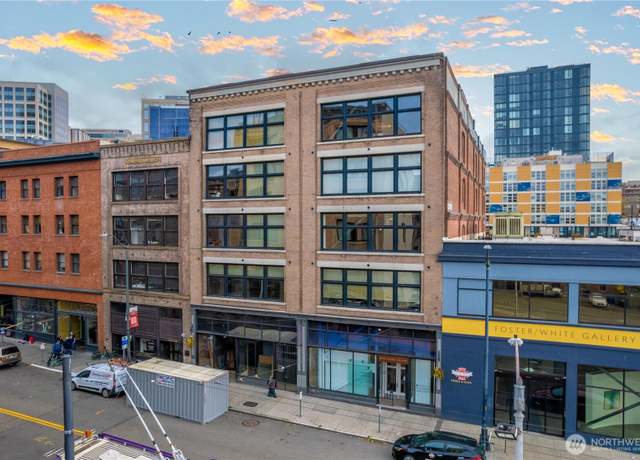 210 3rd Ave S Unit 3C, Seattle, WA 98104
 1105 Spring St #701, Seattle, WA 98104
 1321 Seneca St #1507, Seattle, WA 98101
 2510 6th Ave #3506, Seattle, WA 98121
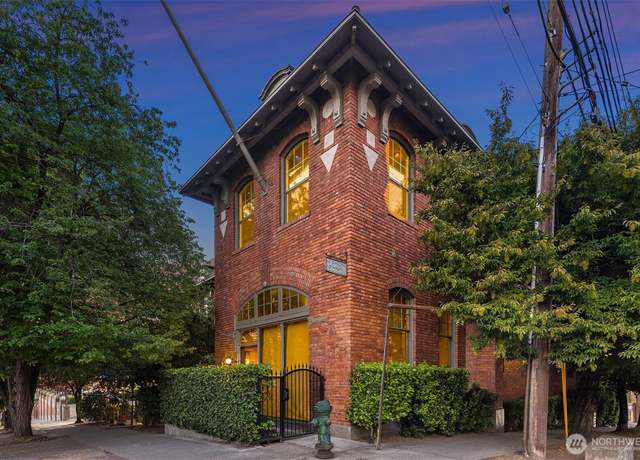 1406 Harvard Ave #8, Seattle, WA 98122
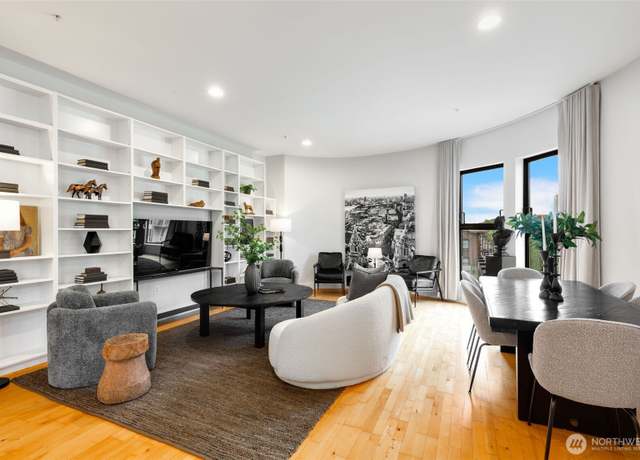 615 E Pike St #306, Seattle, WA 98122
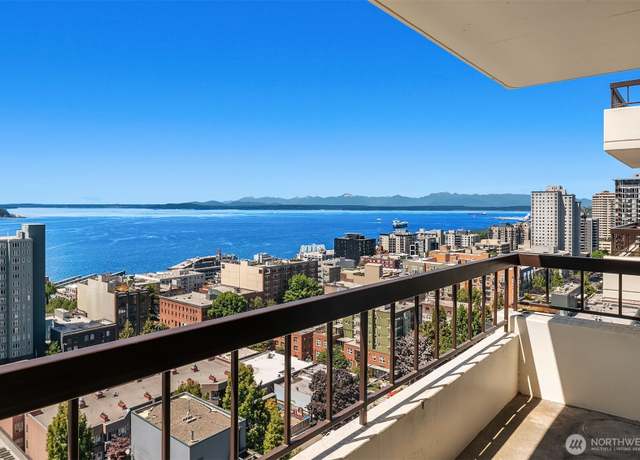 2201 3rd Ave #2003, Seattle, WA 98121
 2510 6th Ave #3902, Seattle, WA 98121
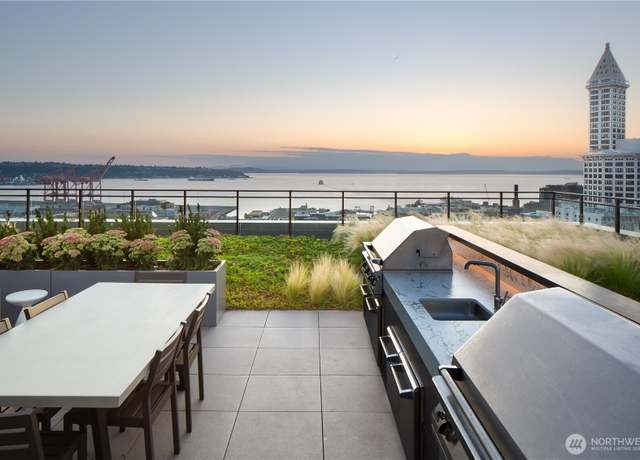 450 S Main St #516, Seattle, WA 98104
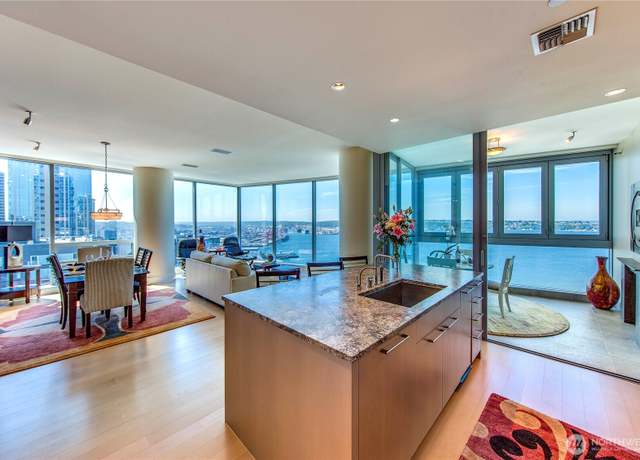 1521 2nd Ave #2303, Seattle, WA 98101
 737 Olive Way #3606, Seattle, WA 98101
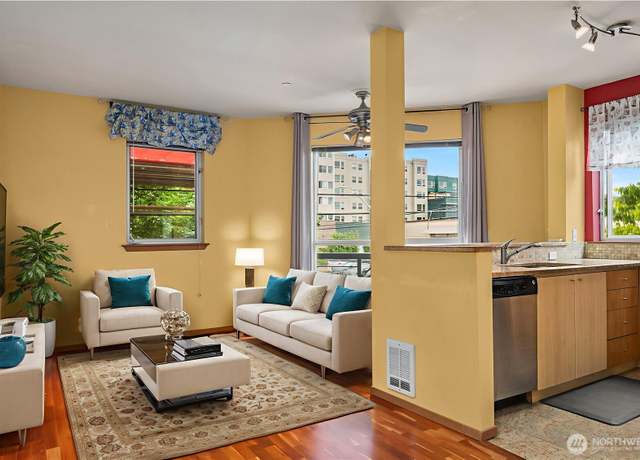 668 S Lane St #314, Seattle, WA 98104
 450 S Main St #1608, Seattle, WA 98104
 737 Olive Way #1903, Seattle, WA 98101
- Median Sale Price
- # of Homes Sold
- Median Days on Market
Median Sale Price (All Home Types)
$615,000
+0.6% YoY | Jun 2025
- 1 year
- 3 year
- 5 year

Based on information submitted to the MLS GRID as of Wed Jul 30 2025. All data is obtained from various sources and may not have been verified by broker or MLS GRID. Supplied Open House Information is subject to change without notice. All information should be independently reviewed and verified for accuracy. Properties may or may not be listed by the office/agent presenting the information. Some IDX listings have been excluded from this website.
About us
Find us
Subsidiaries
Copyright: © 2025 Redfin. All rights reserved.
Updated January 2023: By searching, you agree to the Terms of Use, and Privacy Policy.
Do not sell or share my personal information.
REDFIN and all REDFIN variants, TITLE FORWARD, WALK SCORE, and the R logos, are trademarks of Redfin Corporation, registered or pending in the USPTO.
California DRE #01521930
Redfin is licensed to do business in New York as Redfin Real Estate. NY Standard Operating Procedures
New Mexico Real Estate Licenses
TREC: Info About Brokerage Services, Consumer Protection Notice
Rocket Mortgage is an affiliated business of Redfin. All mortgage lending products and information are provided by Rocket Mortgage, LLC | NMLS #3030; www.NMLSConsumerAccess.org. Licensed in 50 states. This site is not authorized by the New York State Department of Financial Services for mortgage solicitation or loan applications activities related to properties located in the State of New York. For additional information on Rocket Mortgage or to receive lending services in the State of New York, please visit RocketMortgage.com.
Rocket Mortgage, LLC, Rocket Homes Real Estate LLC, Rocket Card, LLC, RockLoans Marketplace LLC (doing business as Rocket Loans), and Rocket Money, Inc., are separate operating subsidiaries of Rocket Limited Partnership. Redfin Corporation is an affiliated business of Rocket Limited Partnership. Each company is a separate legal entity operated and managed through its own management and governance structure. Rocket Limited Partnership is an indirect, wholly owned subsidiary of Rocket Companies, Inc. (NYSE: RKT).
If you are using a screen reader, or having trouble reading this website, please call Redfin Customer Support for help at 1-844-759-7732.
 REDFIN IS COMMITTED TO AND ABIDES BY THE FAIR HOUSING ACT AND EQUAL OPPORTUNITY ACT. READ REDFIN'S FAIR HOUSING POLICY AND THE NEW YORK STATE FAIR HOUSING NOTICE.
 United States
 Canada