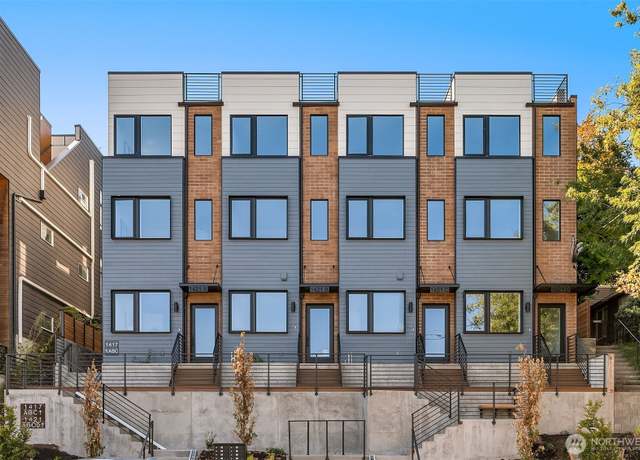
 1421 19th Ave Unit A, Seattle, WA 98122
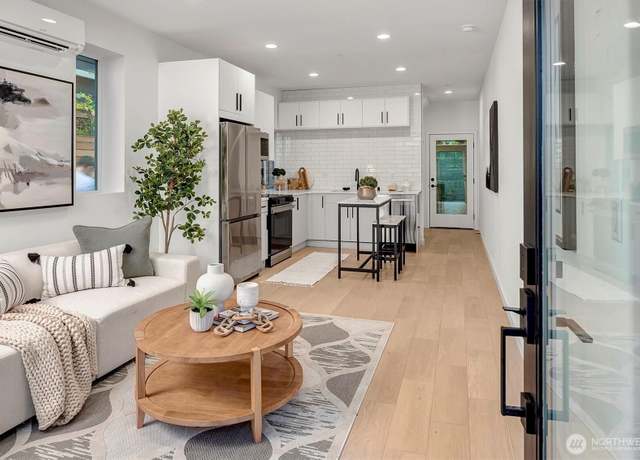 1421 19th Ave Unit A, Seattle, WA 98122
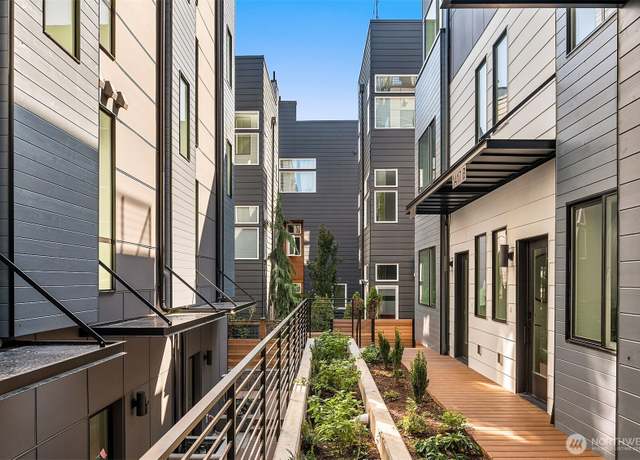 1421 19th Ave Unit A, Seattle, WA 98122
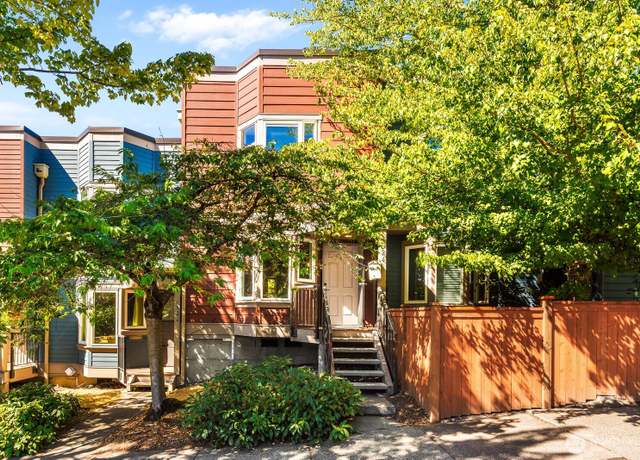 1524 E Yesler Way, Seattle, WA 98122
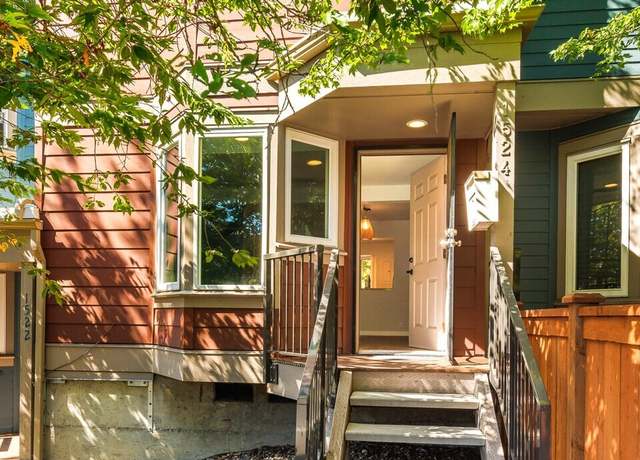 1524 E Yesler Way, Seattle, WA 98122
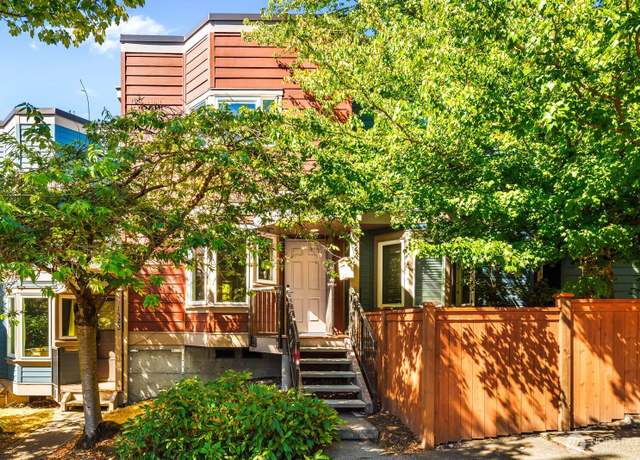 1524 E Yesler Way, Seattle, WA 98122
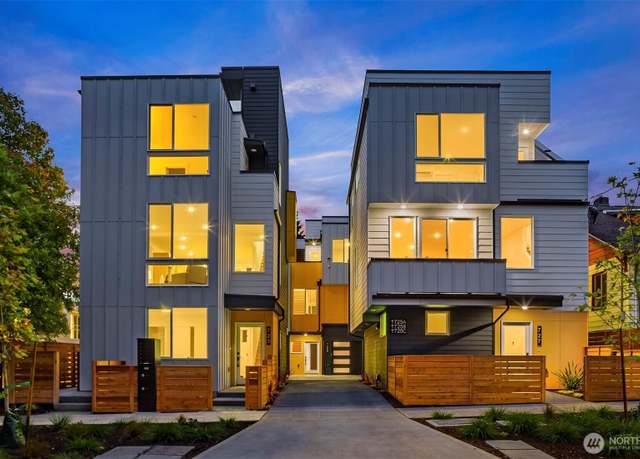 725 18th Ave Unit C, Seattle, WA 98122
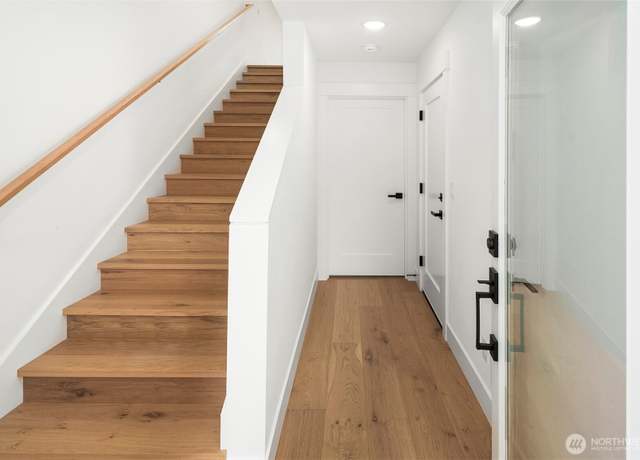 725 18th Ave Unit C, Seattle, WA 98122
 725 18th Ave Unit C, Seattle, WA 98122
 1101 17th Ave #201, Seattle, WA 98122
 1101 17th Ave #201, Seattle, WA 98122
 1101 17th Ave #201, Seattle, WA 98122
 1605 E Pike St #201, Seattle, WA 98122
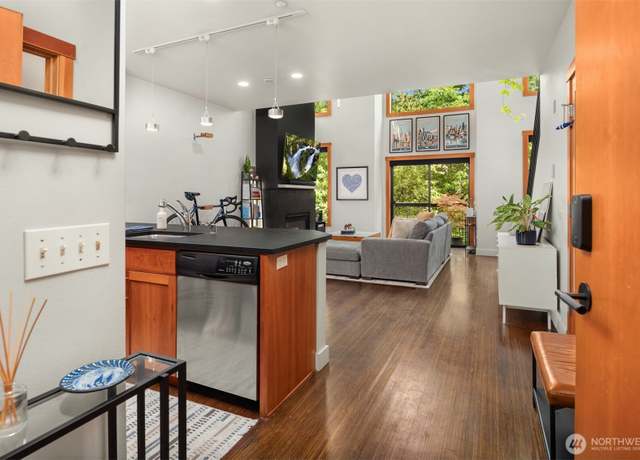 1605 E Pike St #201, Seattle, WA 98122
 1605 E Pike St #201, Seattle, WA 98122
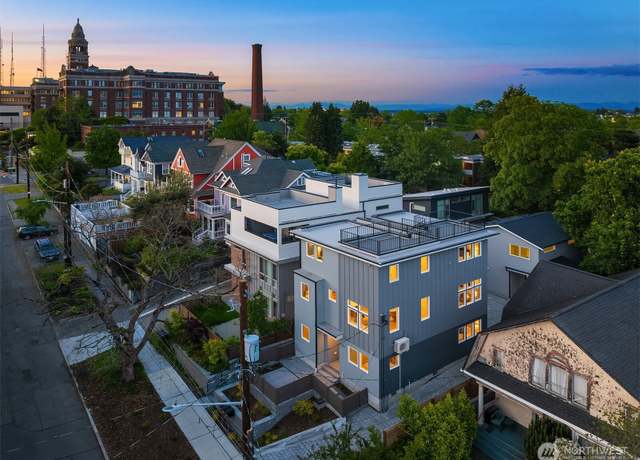 332 17th Ave Unit B, Seattle, WA 98122
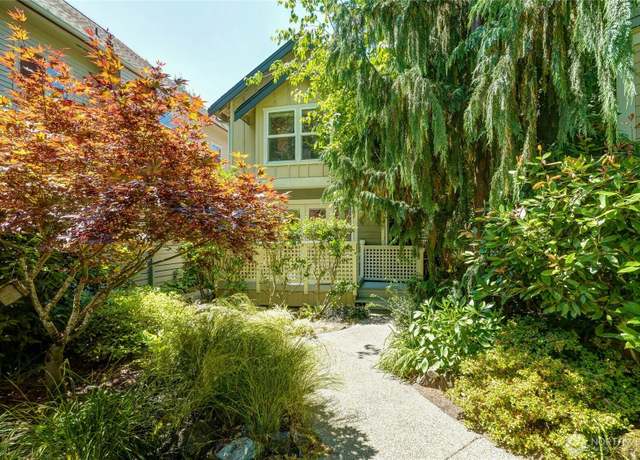 917 18th Ave Unit C, Seattle, WA 98122
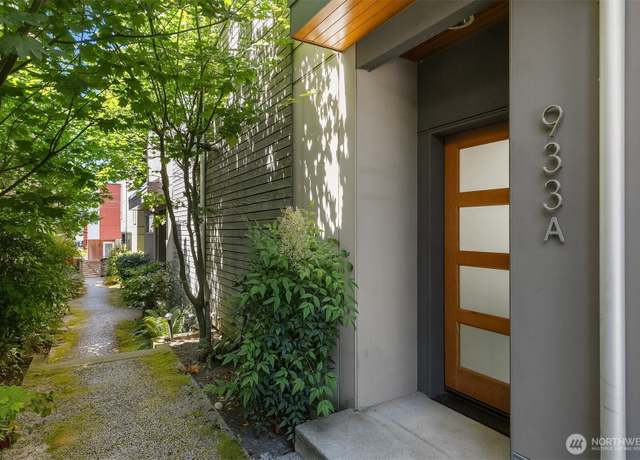 933 16th Avene, Seattle, WA 98122
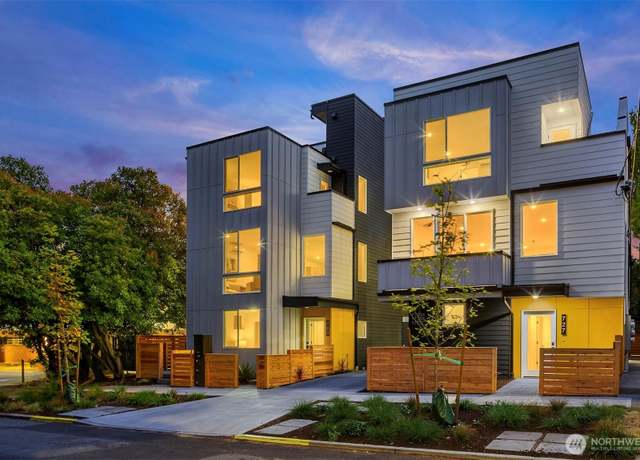 727 18th Ave, Seattle, WA 98122
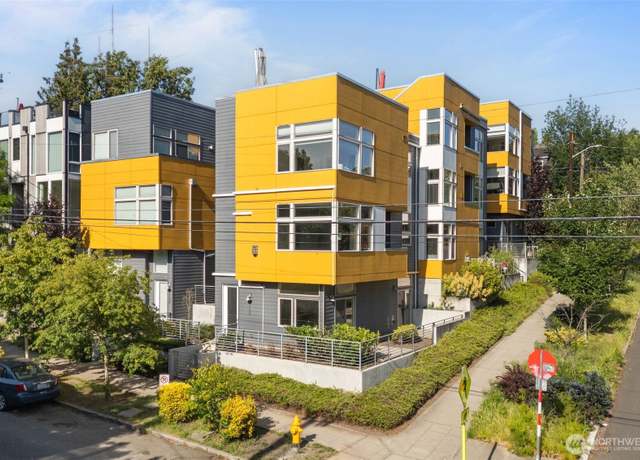 1100 14th Ave, Seattle, WA 98122
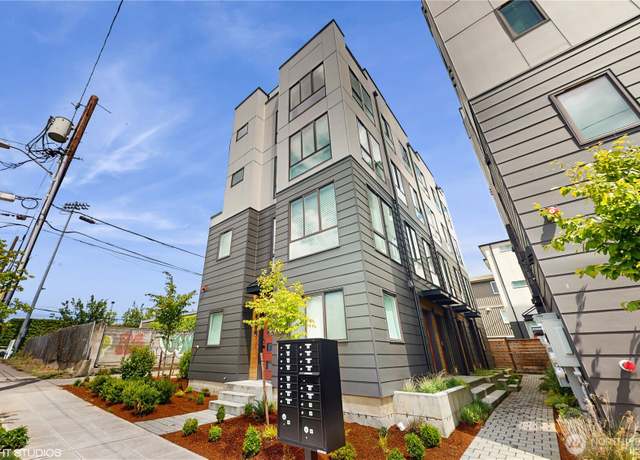 1300 E Remington Ct Unit A, Seattle, WA 98122
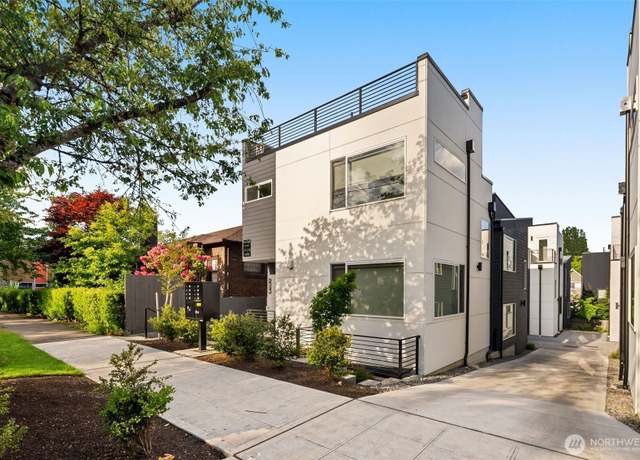 1470 B 21st Ave, Seattle, WA 98122
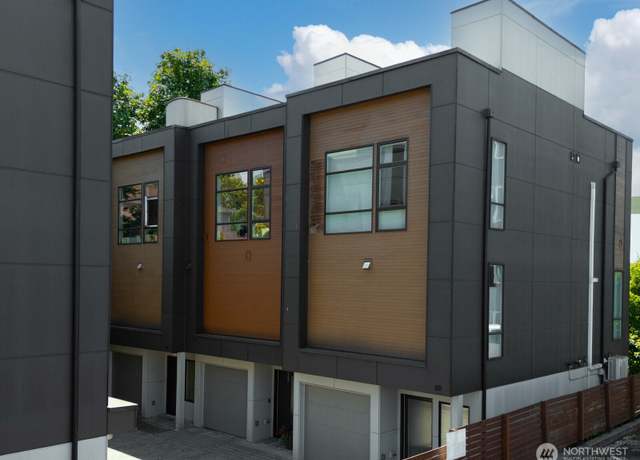 123 20th Ave, Seattle, WA 98122
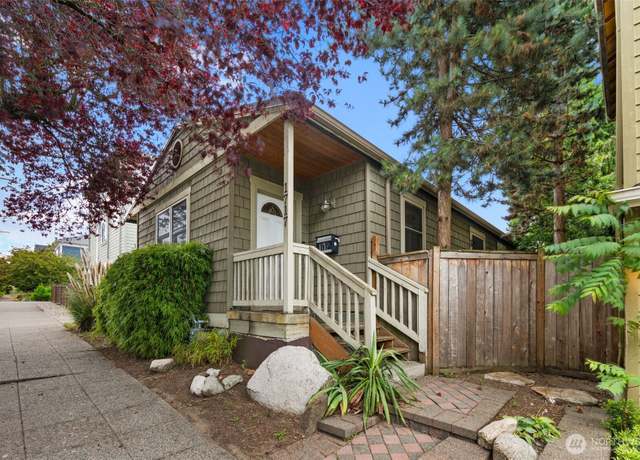 1717 E Spruce St, Seattle, WA 98122
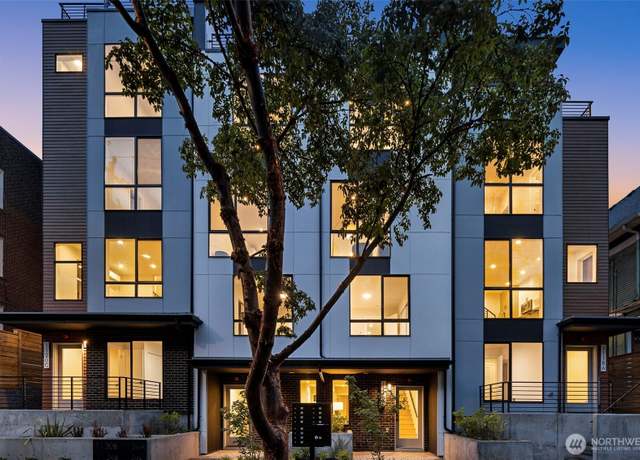 1124 B 13th Ave, Seattle, WA 98122
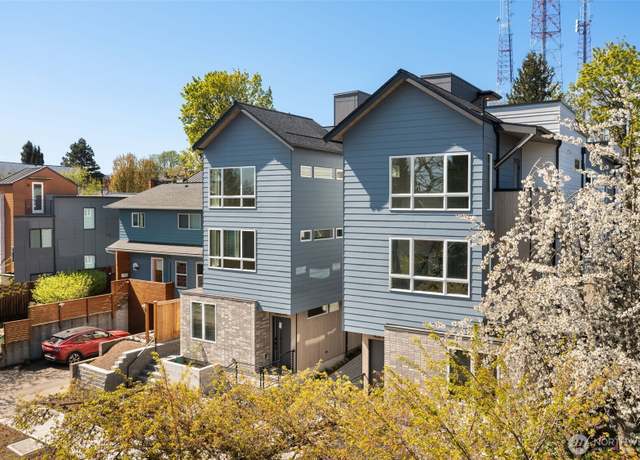 1625 A 21st Ave, Seattle, WA 98122
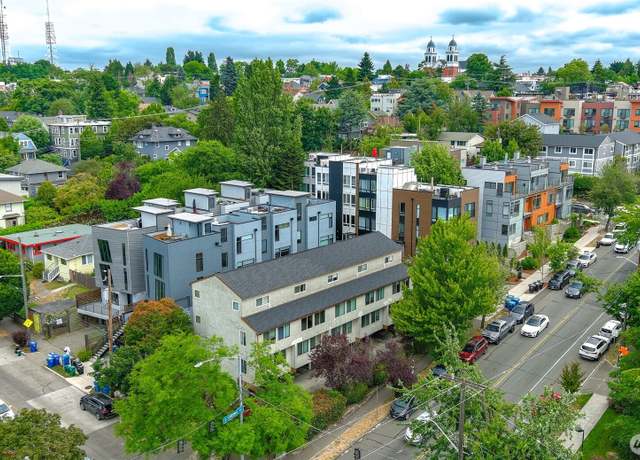 1402 E Cherry St, Seattle, WA 98122
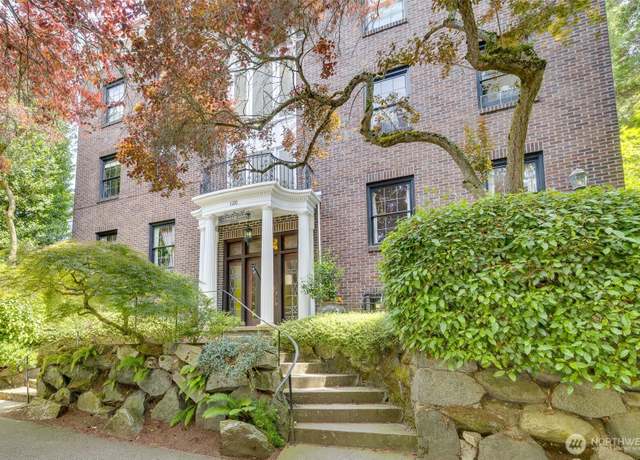 1120 17th Ave Unit B, Seattle, WA 98122
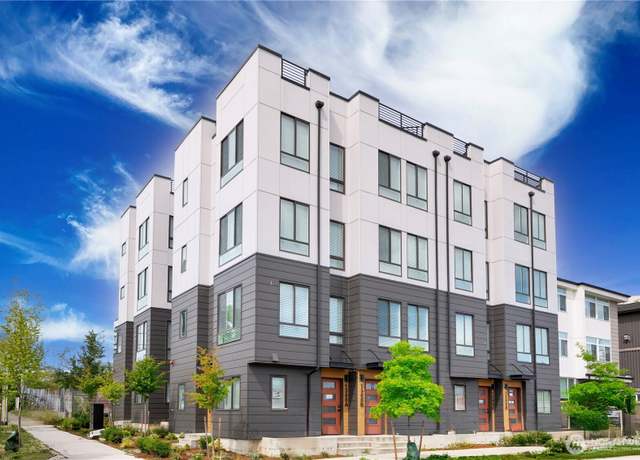 1300 E REMINGTON Ct Unit B, Seattle, WA 98122
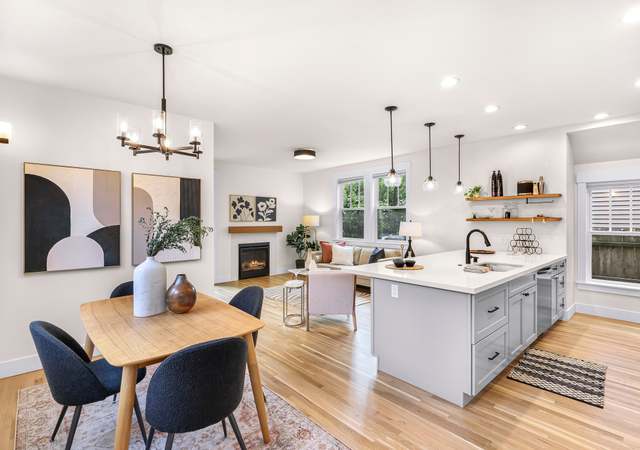 707 21st Ave Unit B, Seattle, WA 98122
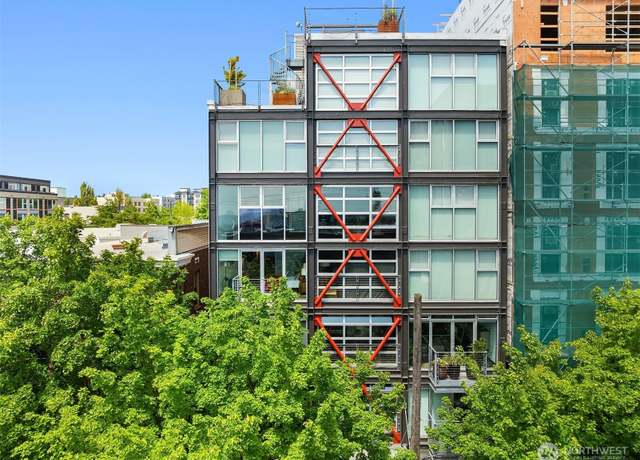 1310 E Union St #401, Seattle, WA 98122
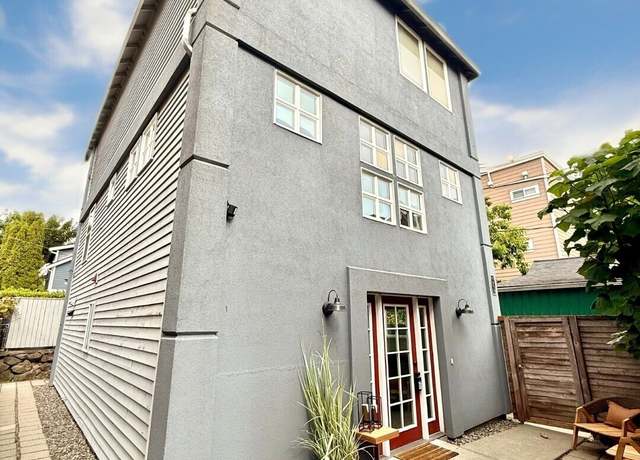 523 21st Ave Unit B, Seattle, WA 98122
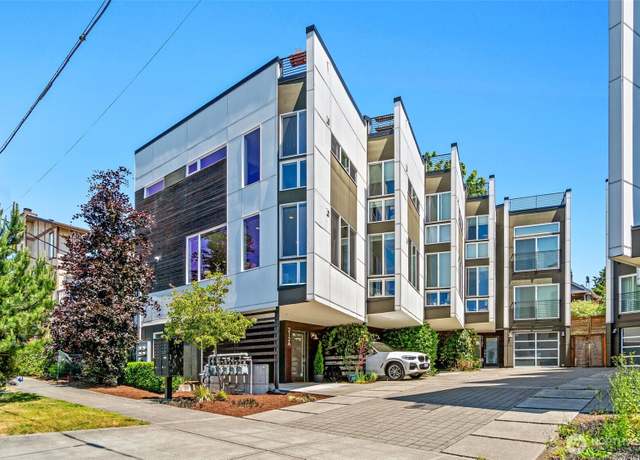 212 16th Ave Unit A, Seattle, WA 98122
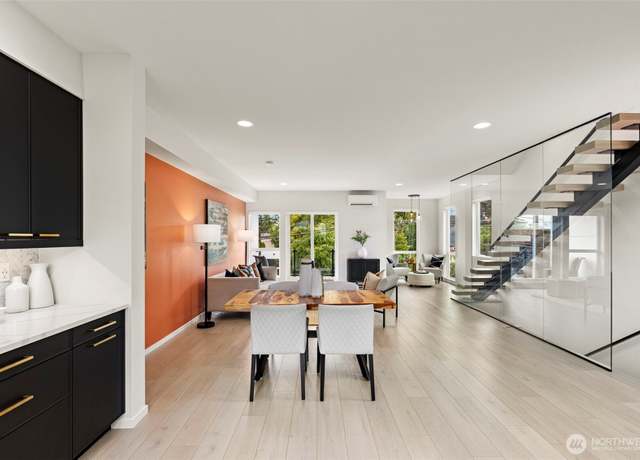 2014 E Pine St Unit A, Seattle, WA 98122
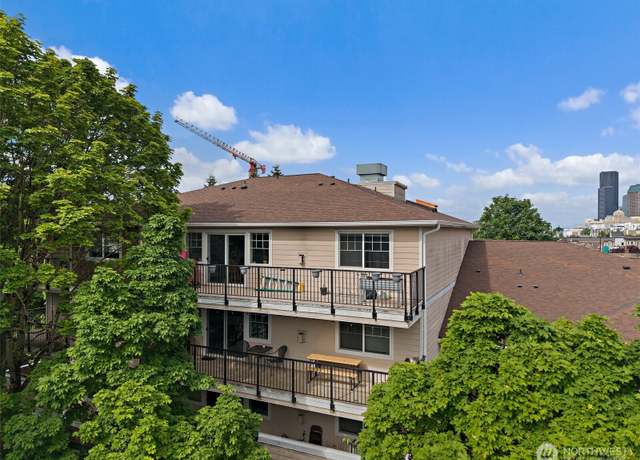 107 20th Ave #306, Seattle, WA 98122
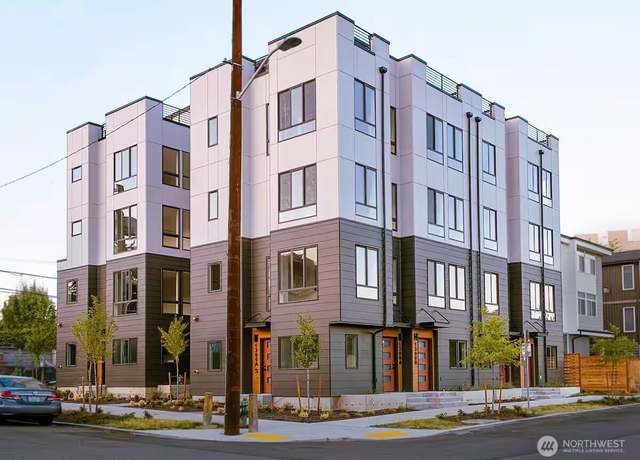 444 13th Ave, Seattle, WA 98122
 1101 17th Ave #403, Seattle, WA 98122
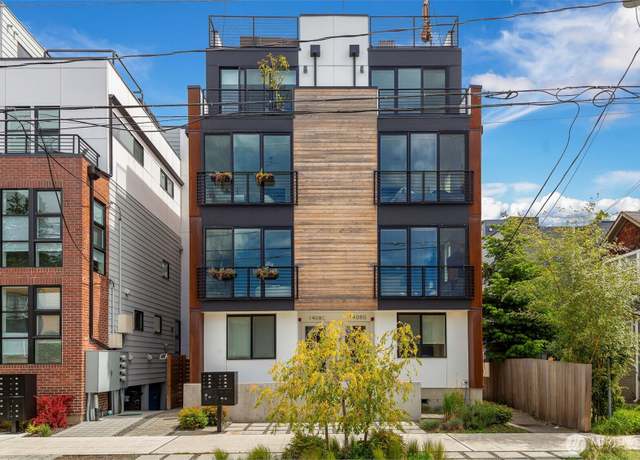 1406 21st Ave Unit A, Seattle, WA 98122
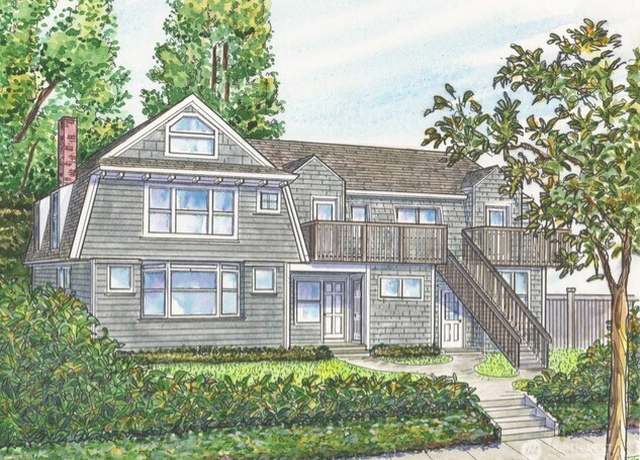 1111 18th Ave, Seattle, WA 98122
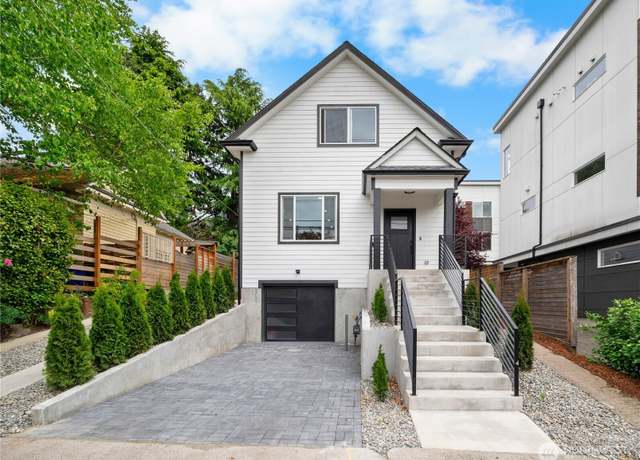 118 16th Ave, Seattle, WA 98122
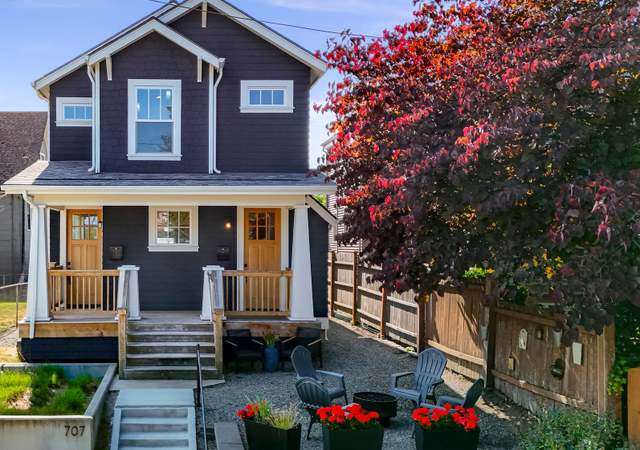 707 21st Ave Unit A, Seattle, WA 98122
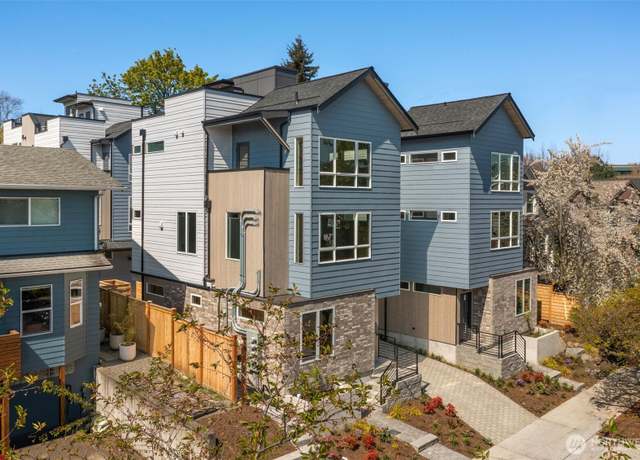 1625 B 21st Ave, Seattle, WA 98122
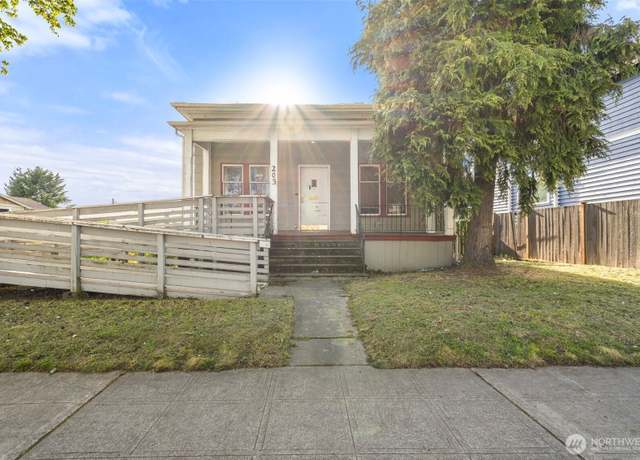 203 23rd Ave, Seattle, WA 98122
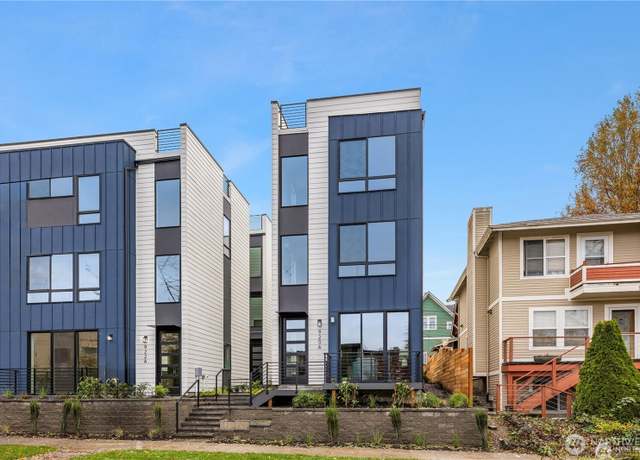 920 16th Ave Unit A, Seattle, WA 98122
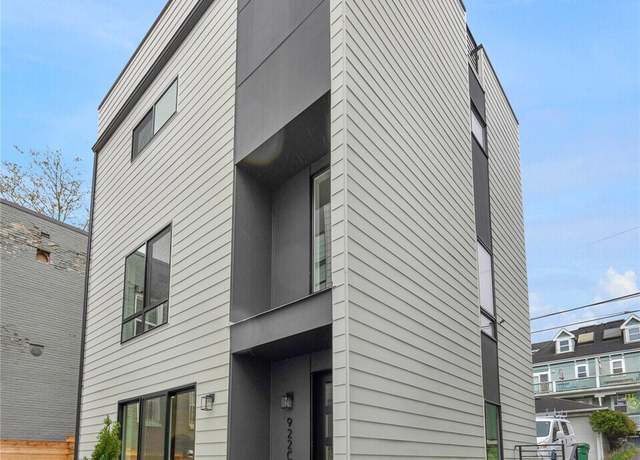 922 16th Ave Unit C, Seattle, WA 98122
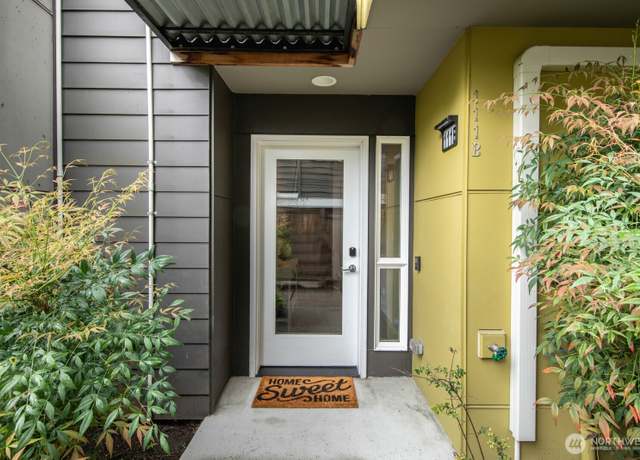 111 17th Ave Unit B, Seattle, WA 98112
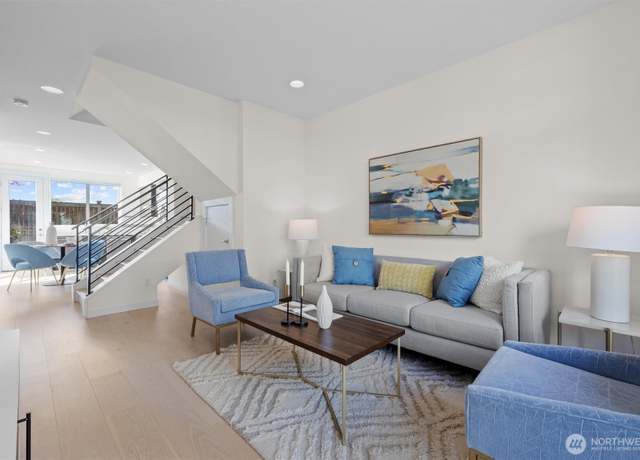 114 20th Ave Unit A, Seattle, WA 98122
 332 17th Ave, Seattle, WA 98122
 421 23rd Ave Unit B, Seattle, WA 98122
 1116 13th Ave Unit D, Seattle, WA 98122
 1310 E Union St #202, Seattle, WA 98122
- Median Sale Price
- # of Homes Sold
- Median Days on Market
Median Sale Price (All Home Types)
$855,000
+8.8% YoY | Jun 2025
- 1 year
- 3 year
- 5 year

Based on information submitted to the MLS GRID as of Wed Jul 30 2025. All data is obtained from various sources and may not have been verified by broker or MLS GRID. Supplied Open House Information is subject to change without notice. All information should be independently reviewed and verified for accuracy. Properties may or may not be listed by the office/agent presenting the information. Some IDX listings have been excluded from this website.
About us
Find us
Subsidiaries
Copyright: © 2025 Redfin. All rights reserved.
Updated January 2023: By searching, you agree to the Terms of Use, and Privacy Policy.
Do not sell or share my personal information.
REDFIN and all REDFIN variants, TITLE FORWARD, WALK SCORE, and the R logos, are trademarks of Redfin Corporation, registered or pending in the USPTO.
California DRE #01521930
Redfin is licensed to do business in New York as Redfin Real Estate. NY Standard Operating Procedures
New Mexico Real Estate Licenses
TREC: Info About Brokerage Services, Consumer Protection Notice
Rocket Mortgage is an affiliated business of Redfin. All mortgage lending products and information are provided by Rocket Mortgage, LLC | NMLS #3030; www.NMLSConsumerAccess.org. Licensed in 50 states. This site is not authorized by the New York State Department of Financial Services for mortgage solicitation or loan applications activities related to properties located in the State of New York. For additional information on Rocket Mortgage or to receive lending services in the State of New York, please visit RocketMortgage.com.
Rocket Mortgage, LLC, Rocket Homes Real Estate LLC, Rocket Card, LLC, RockLoans Marketplace LLC (doing business as Rocket Loans), and Rocket Money, Inc., are separate operating subsidiaries of Rocket Limited Partnership. Redfin Corporation is an affiliated business of Rocket Limited Partnership. Each company is a separate legal entity operated and managed through its own management and governance structure. Rocket Limited Partnership is an indirect, wholly owned subsidiary of Rocket Companies, Inc. (NYSE: RKT).
If you are using a screen reader, or having trouble reading this website, please call Redfin Customer Support for help at 1-844-759-7732.
 REDFIN IS COMMITTED TO AND ABIDES BY THE FAIR HOUSING ACT AND EQUAL OPPORTUNITY ACT. READ REDFIN'S FAIR HOUSING POLICY AND THE NEW YORK STATE FAIR HOUSING NOTICE.
 United States
 Canada