
Given the heated political climate of this year’s election and the inactivity that typically follows the Thanksgiving holiday, one might expect the real estate market to have taken it easy this November. On the contrary, prices and home sales both posted their largest annual gains so far in 2016 and inventory fell farther than it has all year, revealing an exceptionally lively fall market.
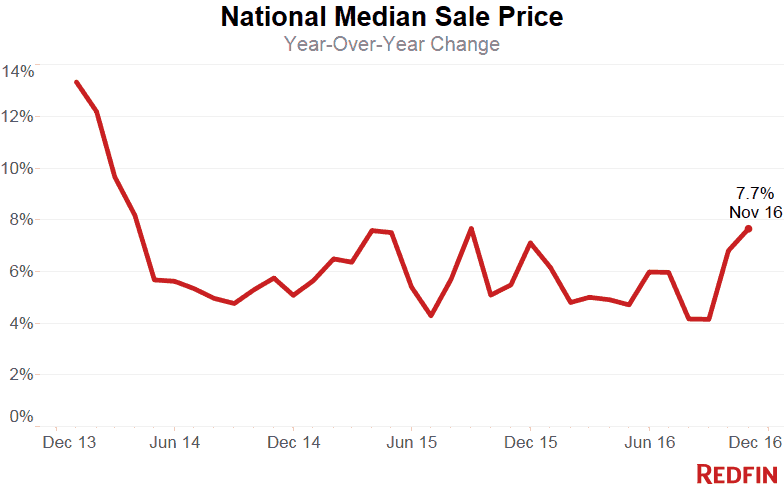
The median sale price rose 7.7 percent to $271,400, marking the highest annual price growth in 14 months. The number of homes sold climbed 20.1 percent compared to the same period last year, the largest annual increase since July 2015. More buyers chased fewer homes as inventory fell 9.7 percent from last year, marking the 14th month of annual declines and the biggest drop in supply since July 2014.
“Last year we saw a temporary slump in November sales as new mortgage industry regulations went into effect and delayed some closings,” said Redfin chief economist Nela Richardson. “Now, those regulatory hurdles have largely been resolved but the market is by no means back to normal. We’ve seen a pickup in the number of Redfin customers going on tours and making offers the last two months as consistently good economic news has bolstered consumer confidence. The Federal Reserve’s decision to raise rates is unlikely to significantly dampen homebuyer enthusiasm as we enter 2017. We’re still expecting another year of rising home prices and modestly growing home sales.”
| Market Summary | November 2016 | Month-Over-Month | Year-Over-Year |
|---|---|---|---|
| Median sale price | $271,400 | 1.2% | 7.7% |
| Homes sold | 219,900 | -6.0% | 20.1% |
| New listings | 204,400 | -17.7% | 0.2% |
| All Homes for sale | 742,200 | -7.9% | -9.7% |
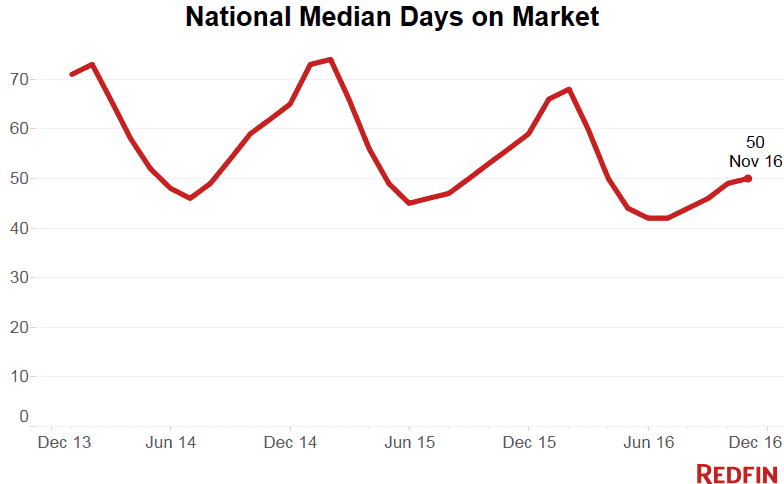
| Median days on market | 50 | 1 | -6 |
| Months of supply | 3.4 | 0 | -1.1 |
| Sold above list | 19.6% | -0.8% | 1.1% |
| Average Sale-to-list | 93.7% | 0.1% | -0.5% |
With fewer homes to choose from and more homes being sold, time was of the essence for homebuyers this fall. The typical home sold within 50 days, which is six days faster than last year, marking the fastest November since Redfin started tracking this data in 2009. One in four homes that sold in November was off the market within two weeks and one in five sold for more than the asking price.
Denver, Colorado was one of the fastest markets this November. The typical home sold in just 19 days — 16 days faster than the same time last year, and 69 percent of homes sold within two weeks. Home sales and prices both grew by double digits and inventory declined 25 percent.
“All you have to do is glance at the license plates on the cars parked downtown to understand how many transplants have flocked here,” said Redfin Denver real estate agent Michael Turner. “This influx of new buyers has kept demand high and led to steadily rising prices and an incredibly fast market. The inventory situation has yet to improve as sellers linger over the decision to list, worrying about being able to find a suitable replacement home and reluctant to give up their extremely low mortgage rates.”
Other November Highlights
Competition
- Seattle, WA was the fastest market, with the typical home under contract in just 15 days, down from 18 days from a year earlier. Oakland, CA and Denver, CO were the next fastest markets, each with a median 19 days on market. Boston, MA and Portland, OR rounded out the top five fastest markets, with the typical homes selling there in 20 and 23 days respectively.
- Competitive markets included San Francisco, CA where 60.6% of homes sold above list price, followed by 53.8% in Oakland, CA, 52.7% in San Jose, CA, 38.8% in Seattle, WA and 35.7% in Portland, OR.
- In Seattle, WA, 80.5% of homes for sale were off the market within two weeks, followed by Denver, CO (69%), Portland, OR (62.3%). Oakland, CA (62.3%) and Boston, MA (58.9%).
Prices
- Fort Lauderdale, FL had the nation’s highest price growth, rising 18.4% since last year to $225,000. Honolulu, HI and three other Florida metros–Lakeland, Tampa, and Deltona rounded out the top five markets for year-over-year price growth, all posting gains of more than 16%.
- 8 metros saw price declines in November. Baton Rouge, LA declined the most since last year falling 5.2% to $178,775. Prices fell 2.2% in San Francisco, the first time this metro has seen a price decline since May 2012.
Sales
- 73 out of 90 metros saw sales surge by double digits from last year. St. Louis, MO led the nation in year-over-year sales growth, up 55.9%, followed by Charleston, SC, up 48.6%. Birmingham, AL rounded out the top three with sales up 48.3% from a year ago.
- Columbia, SC saw the largest decline in sales since last year, falling 38.3%. Home sales in Buffalo, NY and Miami, FL declined by 6.9% and 5.8%, respectively.
Inventory
- Rochester, NY had the largest decrease in overall inventory, falling 40.3% since last November. Buffalo, NY (-35.2%), Portsmouth, NH (-31.2%) and Rochester, NH (-30.1%) also saw far fewer homes available on the market than a year ago.
- Provo, UT had the highest increase in the number of homes for sale, up 33.7% year over year, followed by St. Louis, MO (21.8%) and Ogden, UT (18.6%).
Below are market-by-market breakdowns for prices, sales, inventory and new listings for markets with populations of 1.5 million or more. For downloadable data on all of the markets Redfin tracks, visit the Redfin Data Center.
Median Sale Price
| Redfin Metro | Median Sale Price | Month-Over-Month | Year-Over-Year |
|---|---|---|---|
| Atlanta, GA | $200,000 | 1.3% | 8.9% |
| Austin, TX | $295,000 | 5.6% | 9.7% |
| Baltimore, MD | $241,000 | -5.5% | 2.6% |
| Boston, MA | $375,000 | 4.2% | 5.6% |
| Charlotte, NC | $210,000 | 2.4% | 7.1% |
| Chicago, IL | $214,900 | 0.0% | 9.6% |
| Cincinnati, OH | $155,000 | -3.1% | 12.7% |
| Cleveland, OH | $125,000 | -2.3% | 9.6% |
| Columbus, OH | $175,000 | 0.0% | 9.4% |
| Dallas-Fort Worth, TX | $239,900 | 2.1% | 15.0% |
| Denver, CO | $346,000 | 0.3% | 11.3% |
| Detroit, MI | $155,000 | -2.2% | 8.8% |
| Edison, NJ | $275,000 | -4.2% | -3.5% |
| Fort Lauderdale, FL | $225,000 | 1.6% | 18.4% |
| Hampton Roads, VA | $214,900 | 0.0% | 3.3% |
| Houston, TX | $223,000 | 2.8% | 11.5% |
| Indianapolis, IN | $153,500 | -0.3% | 5.1% |
| Kansas City, MO | $175,000 | -2.8% | 3.0% |
| Las Vegas, NV | $220,000 | 2.3% | 10.0% |
| Long Island, NY | $400,000 | -2.4% | 5.3% |
| Los Angeles, CA | $535,000 | -0.9% | 7.0% |
| Miami, FL | $257,800 | -0.9% | 14.6% |
| Milwaukee, WI | $175,000 | -14.6% | -1.8% |
| Minneapolis-St. Paul, MN | $234,900 | 2.1% | 4.9% |
| Nashville, TN | $247,200 | -1.1% | 8.0% |
| Oakland, CA | $635,000 | 4.3% | 7.8% |
| Orange County, CA | $635,000 | -0.5% | 5.8% |
| Orlando, FL | $202,000 | -1.2% | 9.2% |
| Philadelphia, PA | $230,000 | 0.9% | 7.0% |
| Phoenix, AZ | $230,000 | 0.0% | 8.5% |
| Pittsburgh, PA | $145,000 | -2.7% | 9.4% |
| Portland, OR | $339,900 | 0.0% | 11.5% |
| Riverside-San Bernardino, CA | $319,900 | 1.6% | 7.3% |
| Sacramento, CA | $345,000 | 0.4% | 8.5% |
| San Antonio, TX | $195,000 | -1.3% | 7.9% |
| San Diego, CA | $497,000 | -3.5% | 4.6% |
| San Francisco, CA | $1,100,000 | -7.6% | -2.2% |
| San Jose, CA | $875,000 | -0.6% | 4.2% |
| Seattle, WA | $455,000 | 3.4% | 12.3% |
| St. Louis, MO | $161,000 | -1.8% | 2.5% |
| Tampa, FL | $191,000 | 2.7% | 16.8% |
| Washington, DC | $375,000 | 5.0% | 5.6% |
| National | $271,400 | 1.2% | 7.7% |
Homes Sold
| Redfin Metro | Homes Sold | Month-Over-Month | Year-Over-Year |
|---|---|---|---|
| Atlanta, GA | 8,710 | 2.0% | 34.9% |
| Austin, TX | 2,026 | -11.4% | 11.0% |
| Baltimore, MD | 2,970 | -8.2% | 12.0% |
| Boston, MA | 5,579 | 3.9% | 16.1% |
| Charlotte, NC | 2,433 | -7.9% | 27.6% |
| Chicago, IL | 8,509 | -13.4% | 7.4% |
| Cincinnati, OH | 1,845 | -14.7% | 25.9% |
| Cleveland, OH | 2,019 | -10.8% | 9.2% |
| Columbus, OH | 1,958 | -19.4% | 13.3% |
| Dallas-Fort Worth, TX | 6,482 | -9.5% | 10.4% |
| Denver, CO | 5,002 | 2.5% | 38.6% |
| Detroit, MI | 5,351 | -22.6% | 20.4% |
| Edison, NJ | 2,763 | -4.2% | 25.8% |
| Fort Lauderdale, FL | 2,856 | -1.2% | 3.4% |
| Hampton Roads, VA | 1,582 | -9.1% | 11.5% |
| Houston, TX | 5,842 | -5.3% | 19.1% |
| Indianapolis, IN | 2,177 | -9.9% | 13.9% |
| Kansas City, MO | 2,499 | -10.7% | 35.3% |
| Las Vegas, NV | 3,104 | -0.9% | 26.5% |
| Long Island, NY | 2,576 | -7.5% | 11.8% |
| Los Angeles, CA | 6,120 | -1.7% | 26.3% |
| Miami, FL | 2,434 | 4.2% | -5.8% |
| Milwaukee, WI | 1,632 | -12.7% | 25.7% |
| Minneapolis-St. Paul, MN | 5,187 | -7.6% | 29.3% |
| Nashville, TN | 2,898 | -4.4% | 29.7% |
| Oakland, CA | 2,364 | -0.7% | 19.5% |
| Orange County, CA | 2,462 | -5.1% | 23.5% |
| Orlando, FL | 3,161 | -0.3% | 15.2% |
| Philadelphia, PA | 4,383 | 5.6% | 29.1% |
| Phoenix, AZ | 6,800 | -2.0% | 30.6% |
| Pittsburgh, PA | 1,873 | -9.9% | 22.5% |
| Portland, OR | 3,318 | -3.8% | 13.3% |
| Riverside-San Bernardino, CA | 4,504 | -1.3% | 27.1% |
| Sacramento, CA | 2,551 | -8.8% | 14.9% |
| San Antonio, TX | 1,833 | -15.9% | 13.0% |
| San Diego, CA | 2,984 | -4.8% | 26.0% |
| San Francisco, CA | 1,198 | -7.3% | 8.5% |
| San Jose, CA | 1,320 | -3.7% | 22.9% |
| Seattle, WA | 4,075 | -8.2% | 28.2% |
| St. Louis, MO | 3,067 | -16.4% | 55.9% |
| Tampa, FL | 5,310 | 16.7% | 26.8% |
| Washington, DC | 6,608 | -5.8% | 21.6% |
| National | 219,900 | -6.0% | 20.1% |
All Homes for Sale
| Redfin Metro | All Homes for Sale | Month-Over-Month | Year-Over-Year |
|---|---|---|---|
| Atlanta, GA | 32,726 | -0.2% | -2.1% |
| Austin, TX | 5,787 | -12.9% | 5.4% |
| Baltimore, MD | 10,590 | -12.3% | -20.7% |
| Boston, MA | 10,921 | -18.3% | -26.7% |
| Charlotte, NC | 9,173 | -7.7% | -10.7% |
| Chicago, IL | 39,560 | -11.1% | -12.4% |
| Cincinnati, OH | 8,058 | -6.6% | -12.9% |
| Cleveland, OH | 8,849 | -8.1% | -20.4% |
| Columbus, OH | 6,074 | -9.8% | -16.4% |
| Dallas-Fort Worth, TX | 14,965 | -14.1% | -13.8% |
| Denver, CO | 5,865 | -19.2% | -25.1% |
| Detroit, MI | 12,666 | -12.8% | -28.2% |
| Edison, NJ | 12,613 | -11.2% | -14.3% |
| Fort Lauderdale, FL | 13,334 | -0.4% | -10.6% |
| Hampton Roads, VA | 7,416 | -5.8% | -11.2% |
| Houston, TX | 22,702 | -7.2% | 1.3% |
| Indianapolis, IN | 7,239 | -7.9% | -19.2% |
| Las Vegas, NV | 11,634 | -7.9% | -16.8% |
| Long Island, NY | 10,642 | -8.6% | -22.0% |
| Los Angeles, CA | 16,163 | -12.2% | 8.2% |
| Miami, FL | 18,377 | 0.8% | 6.8% |
| Milwaukee, WI | 5,913 | -12.1% | -14.7% |
| Minneapolis-St. Paul, MN | 10,433 | -16.5% | -18.1% |
| Nashville, TN | 8,702 | -3.3% | 4.4% |
| Oakland, CA | 2,581 | -24.1% | -4.7% |
| Orange County, CA | 6,810 | -14.7% | 3.1% |
| Orlando, FL | 9,797 | -9.7% | -22.1% |
| Philadelphia, PA | 14,832 | -7.6% | -18.8% |
| Phoenix, AZ | 21,828 | -3.9% | -5.6% |
| Portland, OR | 5,546 | -17.6% | -3.6% |
| Riverside-San Bernardino, CA | 16,280 | -6.1% | 1.0% |
| Sacramento, CA | 4,612 | -18.6% | -15.1% |
| San Antonio, TX | 6,622 | -8.2% | -12.2% |
| San Diego, CA | 5,524 | -13.7% | -16.8% |
| San Francisco, CA | 1,932 | -25.2% | 16.5% |
| San Jose, CA | 1,999 | -13.7% | 18.4% |
| Seattle, WA | 4,260 | -24.8% | -14.9% |
| St. Louis, MO | 13,457 | -0.8% | 21.8% |
| Tampa, FL | 13,239 | -10.1% | -18.5% |
| Washington, DC | 15,596 | -15.0% | -22.8% |
| National | 742,200 | -7.9% | -9.7% |
New Listings
| Redfin Metro | New Listings | Month-Over-Month | Year-Over-Year |
|---|---|---|---|
| Atlanta, GA | 7,098 | -19.7% | 2.7% |
| Austin, TX | 2,062 | -19.3% | 4.6% |
| Baltimore, MD | 3,027 | -19.0% | -5.5% |
| Boston, MA | 4,240 | -29.4% | -1.6% |
| Charlotte, NC | 2,156 | -19.0% | 9.7% |
| Chicago, IL | 7,364 | -24.5% | -9.9% |
| Cincinnati, OH | 1,648 | -23.9% | -2.7% |
| Cleveland, OH | 2,025 | -18.4% | -2.8% |
| Columbus, OH | 1,809 | -22.2% | 6.6% |
| Dallas-Fort Worth, TX | 6,622 | -16.5% | 1.6% |
| Denver, CO | 3,397 | -24.1% | 6.5% |
| Detroit, MI | 4,449 | -20.3% | -3.0% |
| Edison, NJ | 2,470 | -18.3% | 2.3% |
| Fort Lauderdale, FL | 3,797 | 6.4% | -4.0% |
| Hampton Roads, VA | 1,753 | -6.7% | 12.2% |
| Houston, TX | 6,431 | -15.7% | 1.3% |
| Indianapolis, IN | 2,008 | -18.8% | 2.9% |
| Kansas City, MO | 2,347 | -18.5% | 21.7% |
| Las Vegas, NV | 3,017 | -15.1% | 1.0% |
| Long Island, NY | 2,100 | -18.4% | -9.4% |
| Los Angeles, CA | 5,611 | -22.2% | -4.2% |
| Miami, FL | 4,052 | 5.4% | 3.7% |
| Milwaukee, WI | 1,068 | -29.9% | -3.6% |
| Minneapolis-St. Paul, MN | 3,082 | -29.8% | 0.0% |
| Nashville, TN | 2,750 | -15.3% | 12.2% |
| Oakland, CA | 1,670 | -29.4% | 2.3% |
| Orange County, CA | 1,969 | -21.6% | -10.5% |
| Orlando, FL | 3,406 | -2.1% | -0.7% |
| Philadelphia, PA | 3,462 | -22.7% | -8.5% |
| Phoenix, AZ | 7,503 | -16.8% | 4.3% |
| Pittsburgh, PA | 1,447 | -26.0% | 6.7% |
| Portland, OR | 2,317 | -28.9% | -6.8% |
| Riverside-San Bernardino, CA | 4,805 | -16.0% | -6.6% |
| Sacramento, CA | 2,035 | -22.1% | 0.5% |
| San Antonio, TX | 2,032 | -12.5% | -0.1% |
| San Diego, CA | 2,409 | -21.5% | -7.0% |
| San Francisco, CA | 683 | -46.7% | -20.9% |
| San Jose, CA | 841 | -31.2% | -8.5% |
| Seattle, WA | 2,611 | -26.0% | 7.7% |
| St. Louis, MO | 2,854 | -22.0% | 14.3% |
| Tampa, FL | 5,048 | -5.3% | 4.9% |
| Washington, DC | 5,705 | -21.6% | 5.0% |
| National | 204,400 | -17.7% | 0.2% |


