
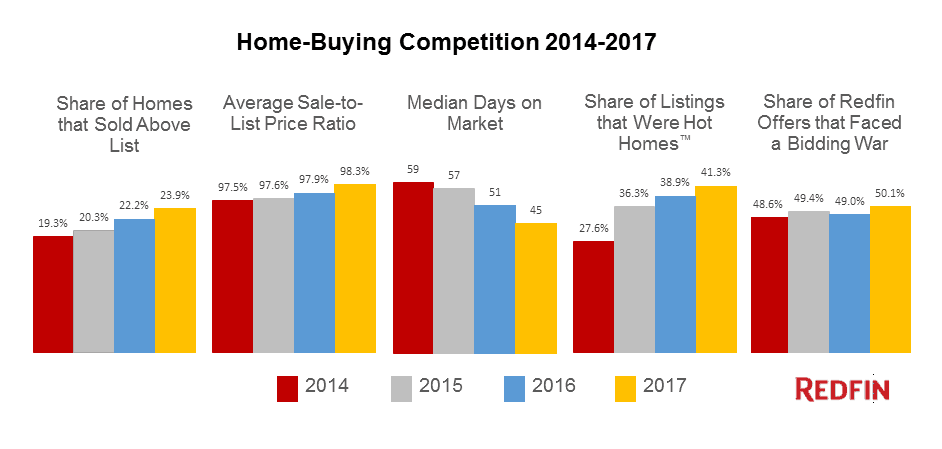
The 2017 housing market was the most competitive we have seen since 2013, when 65 percent of offers written by Redfin agents faced bidding wars. This year, just over half of all offers written by Redfin agents encountered competition, up from 49 percent last year. The pace at which homes went off the market made the competition more intense this year. Homes found buyers after a median 45 days on market, six days fewer than 2016. Forty-one percent of homes that were listed in 2017 were Redfin Hot Homes, a designation earned by homes with 7/10 or higher odds of going under contract within their first 14 days on the market, as determined by Redfin’s proprietary algorithm.
Grass Lawn in Redmond, Washington earned the distinction of most competitive neighborhood in 2017. Redfin’s ranking is based on several indicators of competition, including the percentage of homes that sold for more than their asking price, how quickly homes went under contract and annual price growth in 2017.
Nineteen of the 25 most competitive neighborhoods of 2017 were in the Seattle metro area, where 67 percent of homes listed this year were Hot Homes–the highest share of any market–and 62 percent of offers written by Redfin agents faced bidding wars. Competition was strong across the Seattle market, both in more suburban neighborhoods like Grass Lawn and Crossroads (#3) and more urban neighborhoods like Lower Queen Anne (#13). Several neighborhoods in North Seattle made the ranking, including Pinehurst (#2), Victory Heights (#10) and Licton Springs (#11).
In Grass Lawn, 73 percent of homes sold for over asking price and the typical home found a buyer in just six days. The average sale-to-list price ratio was 108.4 percent, an indication that many homes were bid up well above asking price.
“Grass Lawn is so super-competitive because it’s very close to the Microsoft and Google campuses, and tech companies such as Google and Oracle are expanding their footprints in the area. It is a suburban area with mostly older homes,” said Redfin Agent Gina Madeya. “The area offers easy access to one of only two freeways that can get you across Lake Washington and into downtown Seattle and it’s also a short drive from the shops and restaurants in downtown Redmond and Kirkland.”
| Rank | Neighborhood (City) | Metro | Median Sale Price | 2017 Price Growth | Avg Sale-to-List Price Ratio | Homes Sold Above Asking | Median Days on Market | Share of Listings that were Hot Homes™ |
| 1 | Grass Lawn (Redmond) | Seattle | $665,000 | 35.7% | 108.4% | 73.1% | 6 | 83.2% |
| 2 | Pinehurst (Seattle) | Seattle | $530,000 | 36.6% | 108.0% | 74.1% | 7 | 85.2% |
| 3 | Crossroads (Bellevue) | Seattle | $559,900 | 47.3% | 104.3% | 60.8% | 6 | 60.6% |
| 4 | North Cambridge (Cambridge) | Boston | $760,000 | 29.3% | 106.4% | 73.6% | 7 | 67.6% |
| 5 | Rainier View (Seattle) | Seattle | $411,000 | 26.5% | 108.0% | 72.4% | 7 | 70.6% |
| 6 | Newport (Bellevue) | Seattle | $813,000 | 24.1% | 107.0% | 66.9% | 6 | 84.6% |
| 7 | Ortega/Panama Park (Sunnyvale) | San Jose | $1,673,100 | 28.7% | 113.8% | 93.4% | 8 | 88.4% |
| 8 | Santa Clara North Central (Santa Clara) | San Jose | $ 1,175,000 | 22.4% | 112.1% | 89.1% | 8 | 81.8% |
| 9 | Palo Alto (Palo Alto) | San Jose | $2,620,000 | 32.5% | 107.7% | 69.1% | 9 | 81.8% |
| 10 | Victory Heights (Seattle) | Seattle | $625,000 | 29.5% | 108.0% | 62.9% | 7 | 77.0% |
| 11 | Licton Springs (Seattle) | Seattle | $599,950 | 20.0% | 108.5% | 72.3% | 6 | 82.0% |
| 12 | Downtown Redmond (Redmond) | Seattle | $567,000 | 19.1% | 107.4% | 79.1% | 6 | 82.1% |
| 13 | Lower Queen Anne (Seattle) | Seattle | $565,000 | 32.9% | 105.4% | 62.0% | 7 | 72.2% |
| 14 | Upper West Ridge (Woodinville) | Seattle | $625,000 | 21.4% | 103.5% | 73.2% | 5 | 80.5% |
| 15 | Olympic Hills (Seattle) | Seattle | $525,000 | 23.5% | 106.1% | 70.1% | 7 | 76.5% |
| 16 | Overlake (Redmond) | Seattle | $820,000 | 19.4% | 107.9% | 71.4% | 6 | 79.3% |
| 17 | Columbia City (Seattle) | Seattle | $667,000 | 30.8% | 107.3% | 58.9% | 7 | 72.9% |
| 18 | Bitter Lake (Seattle) | Seattle | $510,000 | 34.6% | 105.1% | 59.5% | 7 | 75.3% |
| 19 | Woodridge (Bellevue) | Seattle | $865,000 | 22.9% | 106.6% | 66.7% | 7 | 76.7% |
| 20 | Greenwood Point (Issaquah) | Seattle | $500,000 | 23.6% | 105.2% | 59.5% | 6 | 83.3% |
| 21 | Cedar Park (Seattle) | Seattle | $586,000 | 21.3% | 107.4% | 68.7% | 7 | 73.5% |
| 22 | Wallingford (Seattle) | Seattle | $875,000 | 21.9% | 108.5% | 65.2% | 7 | 81.0% |
| 23 | West Campbell (Campbell) | San Jose | $1,316,000 | 25.3% | 110.1% | 83.8% | 9 | 80.0% |
| 24 | Queensborough, Brentwood, Crystal Springs (Bothell) | Seattle | $522,500 | 21.5% | 104.8% | 63.3% | 6 | 72.1% |
| 25 | Athmar Park (Denver) | Denver | $308,072 | 16.7% | 104.0% | 76.9% | 4 | 83.7% |
Looking for the most competitive areas in your metro? Download metro-level data here.
Madeya helped a family purchase a home in Grass Lawn earlier this year. The home, which Madeya says came on the market slightly underpriced at $860,000, was bid up to over $1 million. Her clients were absolutely in love with the home. Their offer wasn’t the highest, but they won over the sellers by waiving all contingencies, working with a reputable lender and providing a $100,000 earnest money deposit.
“This sounds extreme, but that’s what it takes in some neighborhoods because demand is so high,” says Madeya. “My advice to a Seattle buyer is to get really clear about your full financial capability and your risk tolerance. Find out what you can truly afford and start looking at homes well below that amount, so that when that bidding war inevitably happens, you have some leverage to work with. Get clear early in the search so you and your agent can be more deliberate and strategic.”
She says that buyers who are hesitant about getting into a competitive situation or waiving contract protections can consider new construction homes, which are typically less competitive, or look for the rare property that doesn’t fly off the market. Those homes are often slightly overpriced or may have a funky layout, but they represent opportunities for buyers to negotiate.
North Cambridge (#4) just outside of Boston is highly desirable given its proximity to Harvard and MIT, the T station and all of the stores and restaurants in Porter Square, says Redfin agent Haley Fehling. Fehling says properties are routinely bid up between $50,000 and $100,000 over the asking price. With many international buyers who are able to offer all cash, buyers who need financing often decide to waive contingencies to compete.
In North Cambridge, financed buyers of Fehling’s recently won a bidding war with a personalized letter. “My buyers just closed on a North Cambridge condo. They waived contingencies and offered above the asking price, but the seller said their letter made the difference.”
Fehling says it’s not enough to simply say that you like the home. The letter should tell your story and explain in detail how you connected to the home. “My buyers shared how the seller’s bar stools reminded them of their home in Vermont, which helped show who they are as people instead of numbers on a page.”
She advises taking cues from the home. Do the sellers have a pet, a beautiful garden or a quaint reading nook? Find a way to connect with the seller using your observations in the home.
Bidding war strategies often come with risks for the buyer, so we recommend speaking to a Redfin agent in your neighborhood to determine the right strategy for you. Below are links to more information about how to successfully buy a home in a competitive market.
- Secrets to Win a Bidding War
- How to Get a Good Deal on a House in a Great Area
- The Risks of Waiving 3 Common Home Buying Contingencies
- Consider a Fixer-Upper to Avoid Competition
- How to Make a Competitive Offer with a VA Loan
Which neighborhoods will be most competitive in 2018? Next month, we’ll publish our Hottest Neighborhoods of 2018 report, an analysis of Redfin.com user activity data and local Redfin agent insights that predicts which neighborhoods will heat up in the new year.
More Market Data
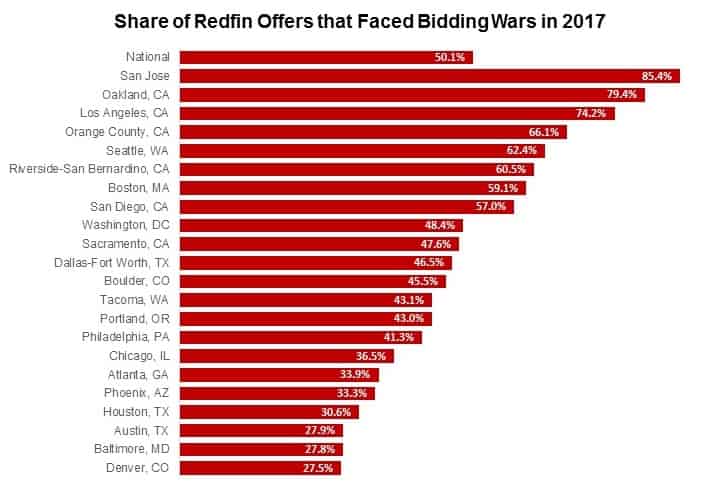
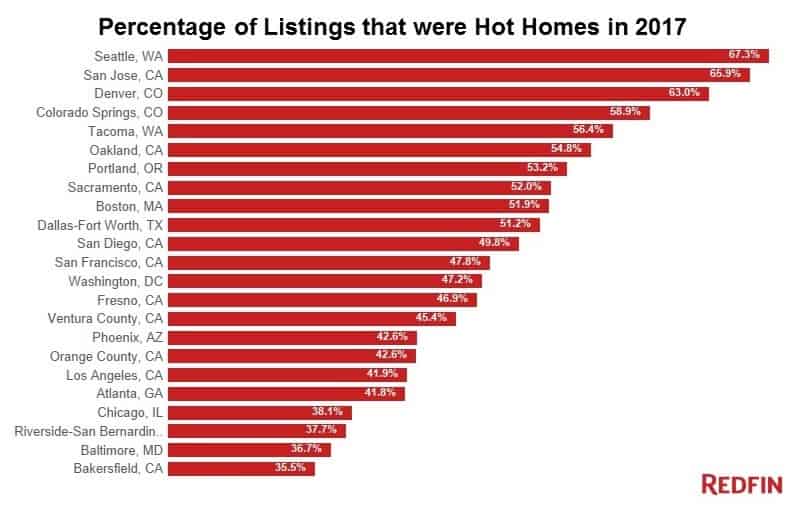
- The graphs below rank the nation’s largest markets by the percentage of homes listed this year that were Hot Homes and by the portion of offers written by Redfin agents that faced competition in 2017.
- Want to know which zip codes in your metro area were the most competitive in 2017? Click here to download a spreadsheet.
- Curious about which neighborhoods were most competitive in previous years? Here are our reports from 2016 and 2015.
For downloadable data on all of the markets Redfin tracks, visit the Redfin Data Center.
Methodology: To determine the rankings, we analyzed four factors in metro areas with populations greater than 1 million. The rankings were based on transaction data from multiple listing services and public records data. Each factor was given equal weighting, with the exception of the average sale-to-list price ratio, which was given three times the weight as it best represents the effect of competition. Neighborhoods must have had at least 50 home sales between January and December 2017 to be included in the top 25 national ranking. Only condo, single-family home and townhome sales were included. We controlled for the overlapping or duplication of neighborhoods. The four factors analyzed were:
- Year-over-year median sale price growth (year-to-date through December for each year)
- Percentage of homes that sold above their asking price
- Median days on market
- Average ratio of sale price to list price


