Key takeaways
- The Chicago housing market slightly favored sellers in May, but the balance of power was nearly even.
- Home prices, sales, and listings all rose as activity returned to the market.
- The city’s seasonal trends acted more “normal” than they have in years, in line with the national market’s slow reset.
Chicago housing market snapshot
| Balance of Power | Median Sale Price (YoY) | Pending Sales (YoY) | Active Listings (YoY) | Days on Market (YoY) |
| Balanced market | $395,400 (+5.2%) | 7,778 (+6.3%) | 26,679 (+0.7%) | 51 (-3 days) |
Spring housing season was in full swing in May, and Chicago’s market followed suit. Sales increased, homes moved faster, and prices climbed. The typical listing took about seven weeks to sell, but those that were well-priced moved more quickly than in previous springs. The market was nearly perfectly balanced, but strategy still mattered.
Learn everything you need to know about the Chicago, IL, housing market as we edge closer to summer, and what buyers and sellers can do to succeed.
U.S. housing market snapshot
| Balance of Power | Median Sale Price (YoY) | Pending Sales (YoY) | Active Listings (YoY) | Days on Market (YoY) |
| Buyer’s Market | $393,247 (+2.3%) | 349,901 (+4.4%) | 1,483,919 (+0.7%) | 48 (+2 days) |
Nationally, prices are rising, inventory is growing, and pending sales are up. The prolonged slow and expensive buyer’s market that has defined the post-pandemic market is finally showing signs of thawing—but buyers are still firmly in charge.
“Housing has been stuck in a rut for years, with buyers and sellers priced out and too few homes to go around,” said Chen Zhao, Redfin’s head of economics research. “While conditions are still difficult, many cities are undergoing a yearslong reset from the pandemic, with price growth easing and inventory climbing—helping affordability improve as wages rise. Pending home sales have increased over the last three months, which is an early sign that buyers and sellers are beginning to reenter the market. But volatility tied to the Iran War is keeping everyone on edge.”
Let’s dive into the Chicago housing market.
Chicago’s housing market slightly favored sellers
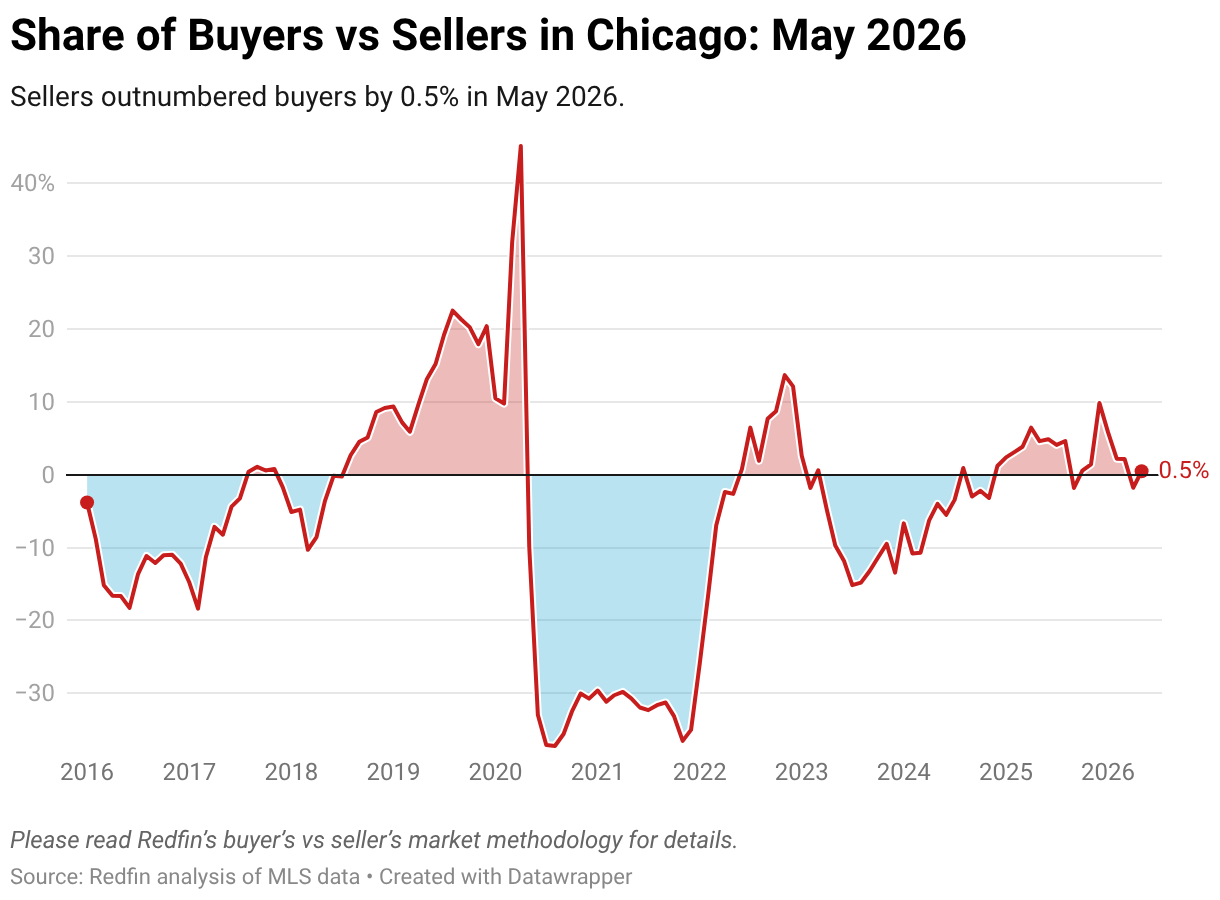
In Chicago, buyers outnumbered sellers by just 0.5% in May, giving the market a slight tilt toward sellers. The number of buyers rose 5% year over year in May, while the number of sellers was essentially flat. Nationally, it was essentially the opposite; there were 47% more sellers than buyers.
Homes moved relatively quickly. The median home sat on the market for 51 days, and 44% of listings went under contract within two weeks. Meanwhile, 37% of homes sold above their original list price, compared to just 26% nationally.
Active buyers should move quickly on well-priced listings—homes that are priced right are still drawing multiple offers. Sellers can be confident in the demand but shouldn’t overprice; the data shows buyers are active but not desperate, and overpriced homes are sitting.
Prices rose at a less frenzied pace
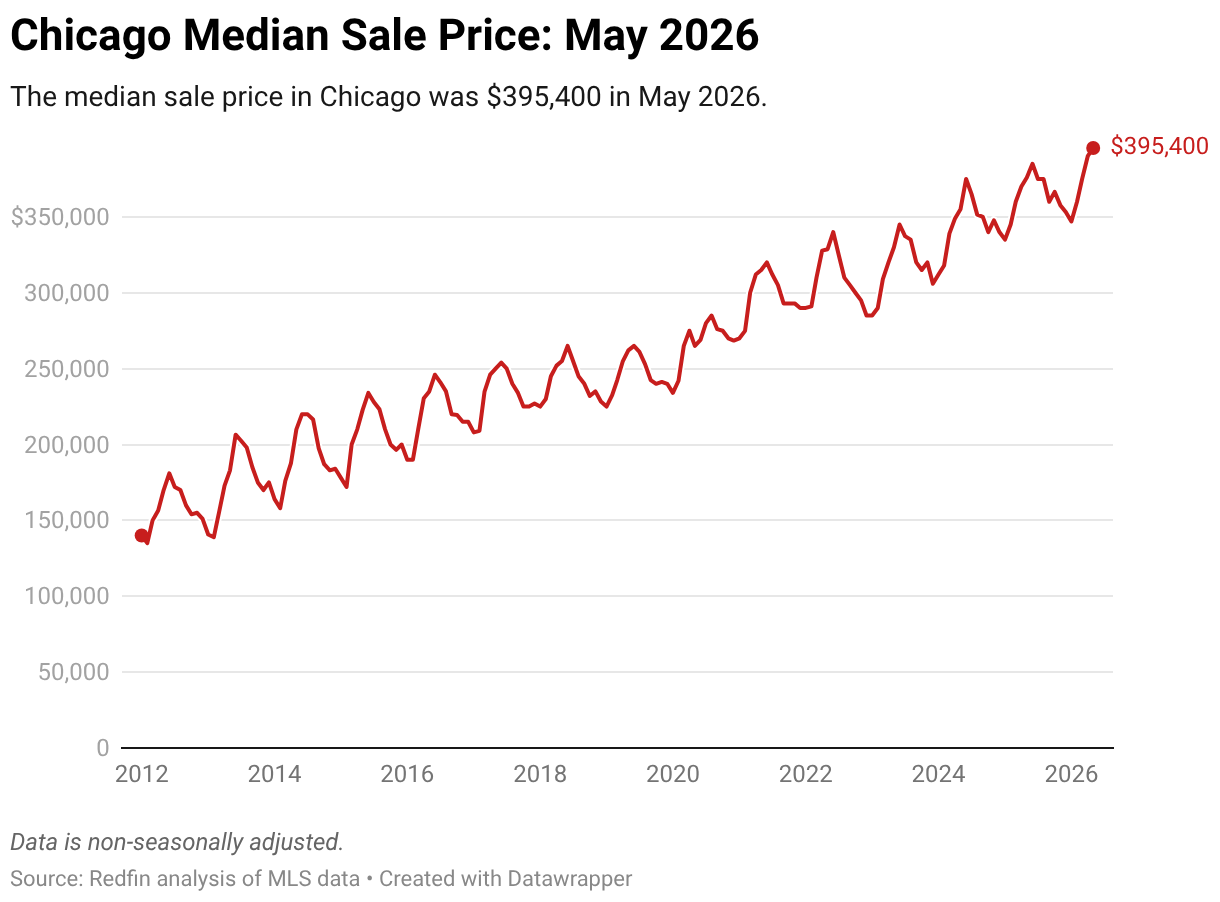
The median sale price in Chicago reached $379,900 in May, up 5.4% year over year. That was a continued upward trend, but a deceleration from the 8.3% year-over-year growth at this time in 2024 and the 6.1% gain last year. Chicago’s appreciation outpaced the nation as a whole (where prices rose just 1.9%), but the gap narrowed.
To put this data into context, Chicago’s median sale price has nearly doubled from its post-recession lows. The sharpest growth came during the pandemic, when prices jumped by $50,000 in under two years. The current pace of growth is far more sustainable, averaging roughly 5–6% annually since mid-2024.
Home searchers shouldn’t wait for price drops from sellers, though. Only 11% of active listings in Chicago have had a price reduction, compared to 20% nationally. That said, sellers who do cut their price are cutting by an average of 4% of their list price. Sellers should price to the market, and buyers should make competitive offers.
Inventory held steady
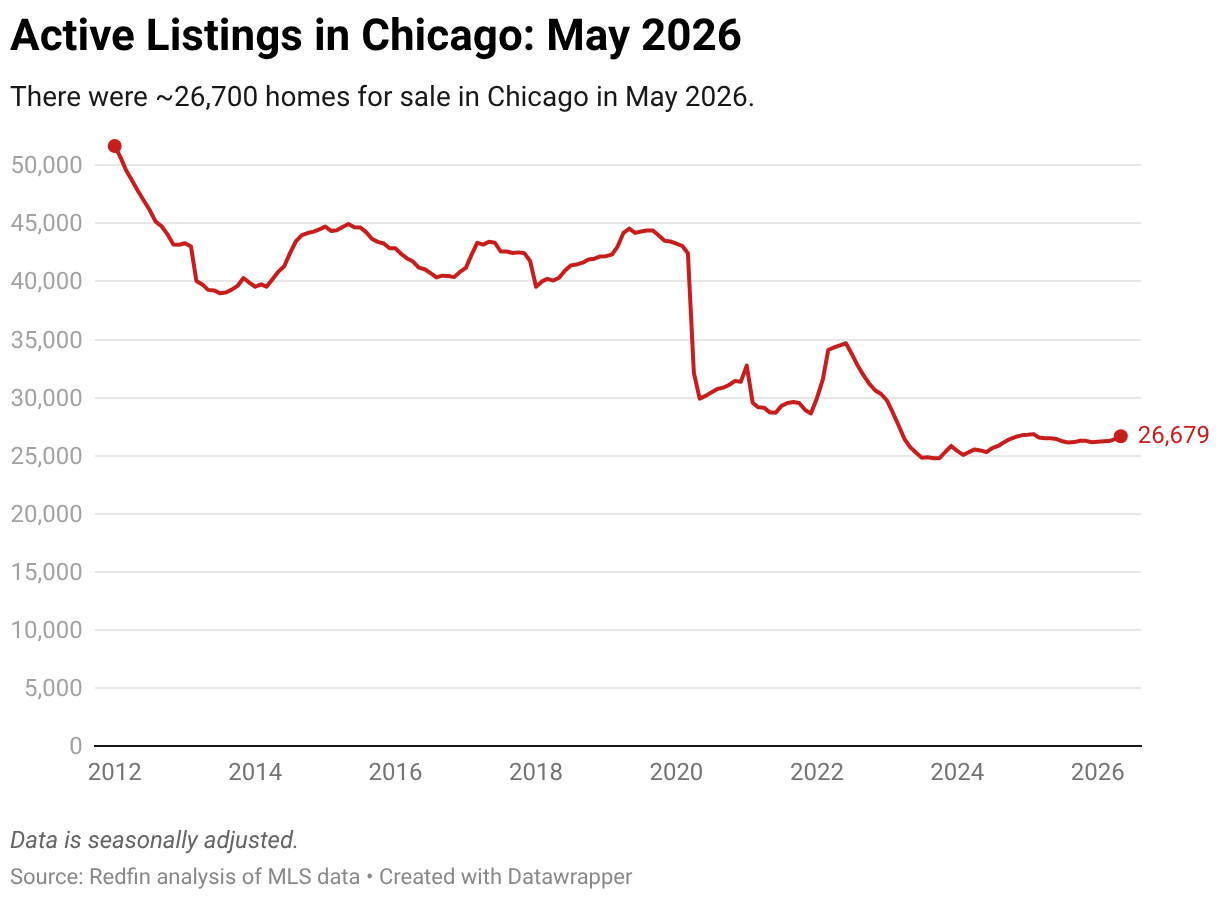
Active listings held steady at 26,679, up less than 1% year over year—essentially flat after several months of modest growth. New listings climbed 4%, a sign that more homeowners chose to sell. Combined with months of supply at 3.1 (compared to 3.5 nationally), Chicago remained a tighter market than the U.S. as a whole.
The data painted a picture of a market that was unevenly normalizing: inventory plateaued near its multi-year rebuild level, but demand absorbed much of it before supply could accumulate meaningfully. For buyers, that meant a similar number of options as last year and still limited leverage on price.
All data is a Redfin analysis of MLS, U.S. Census Bureau, and/or county record data. Check the Redfin Data Center for additional in-depth housing market data.