
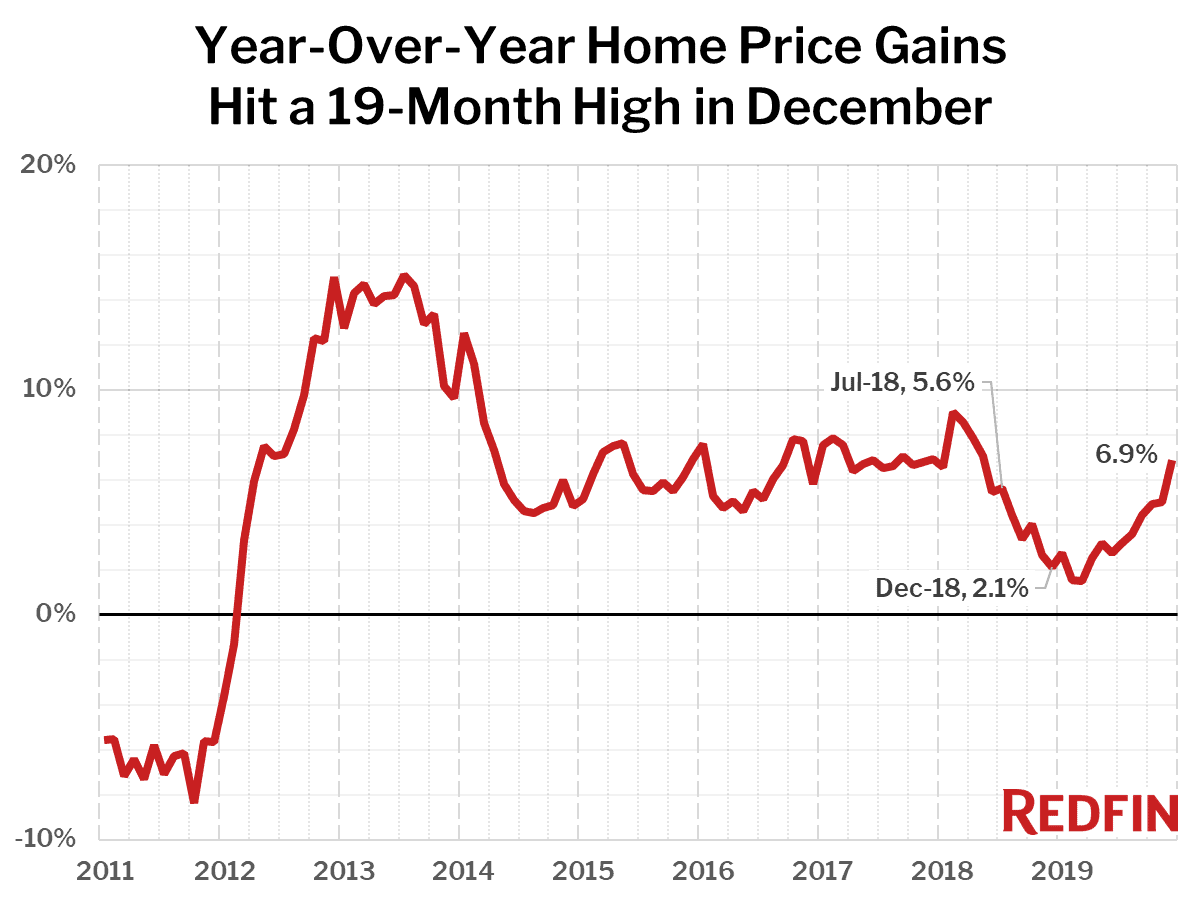
A record shortage of homes for sale drove prices up on a monthly and annual basis.
U.S. home-sale prices increased 6.9% year over year in December to a median of $312,500 across the 217 metros Redfin tracks. Home prices were also up 1.1% month over month on a seasonally-adjusted basis, the largest increase since February 2018.
“Low mortgage rates and a strong economy fueled homebuyer demand in December, which boosted both home sales and prices,” said Redfin chief economist Daryl Fairweather. “Prices heated up in West Coast metros like Seattle and Los Angeles, which indicates the slowdown of 2019 has officially ended in these markets.”
Prices continued to increase the fastest in affordable metro areas in December. Among the 20 metro areas with the largest year-over-year price increases, 16 were below the national median, led in December by Memphis (median price $190,000, up 15.9%), Camden, NJ ($195,000, +14.7%) and Cincinnati ($187,000, +14.4%).
For the more expensive metro areas, a boost in the loan limits for mortgages backed by FHA, VA, Fannie Mae and Freddie Mac that takes effect in January could impact affordability and put upward pressure on home prices in the sweet spot of the limit increases. The new limit for most of the country is $510,400, up from $484,350 in 2019, while the limit in high-cost areas has increased to $765,600, up from $726,525 in 2019.
Of the 85 largest metro areas Redfin tracks, only two saw a year-over-year decline in the median sale price: In New York, home prices were down 2.4%—possibly as a result of the increase in New York City’s “mansion tax” on homes priced above $1 million. In San Francisco, they fell 1.7%.
| Market Summary | December 2019 | Month-Over-Month | Year-Over-Year |
|---|---|---|---|
| Median sale price | $312,500 | 0.5% | 6.9% |
| Homes sold, seasonally-adjusted | 276,800 | 1.0% | 6.8% |
| New listings, seasonally-adjusted | 304,600 | -1.3% | -5.1% |
| All Homes for sale | 646,800 | -14.6% | -14.9% |
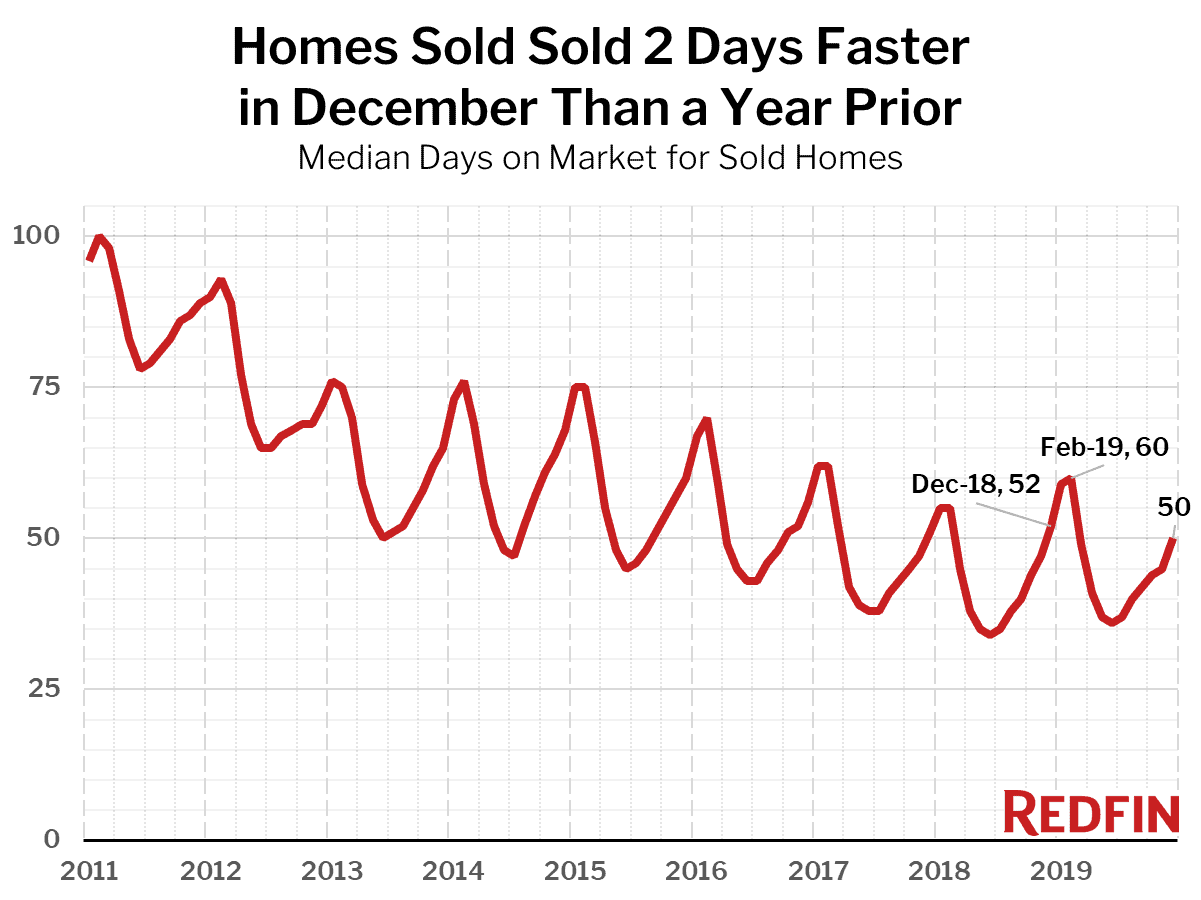
| Median days on market | 50 | 5 | -2 |
| Months of supply | 2.6 | -0.5 | -0.8 |
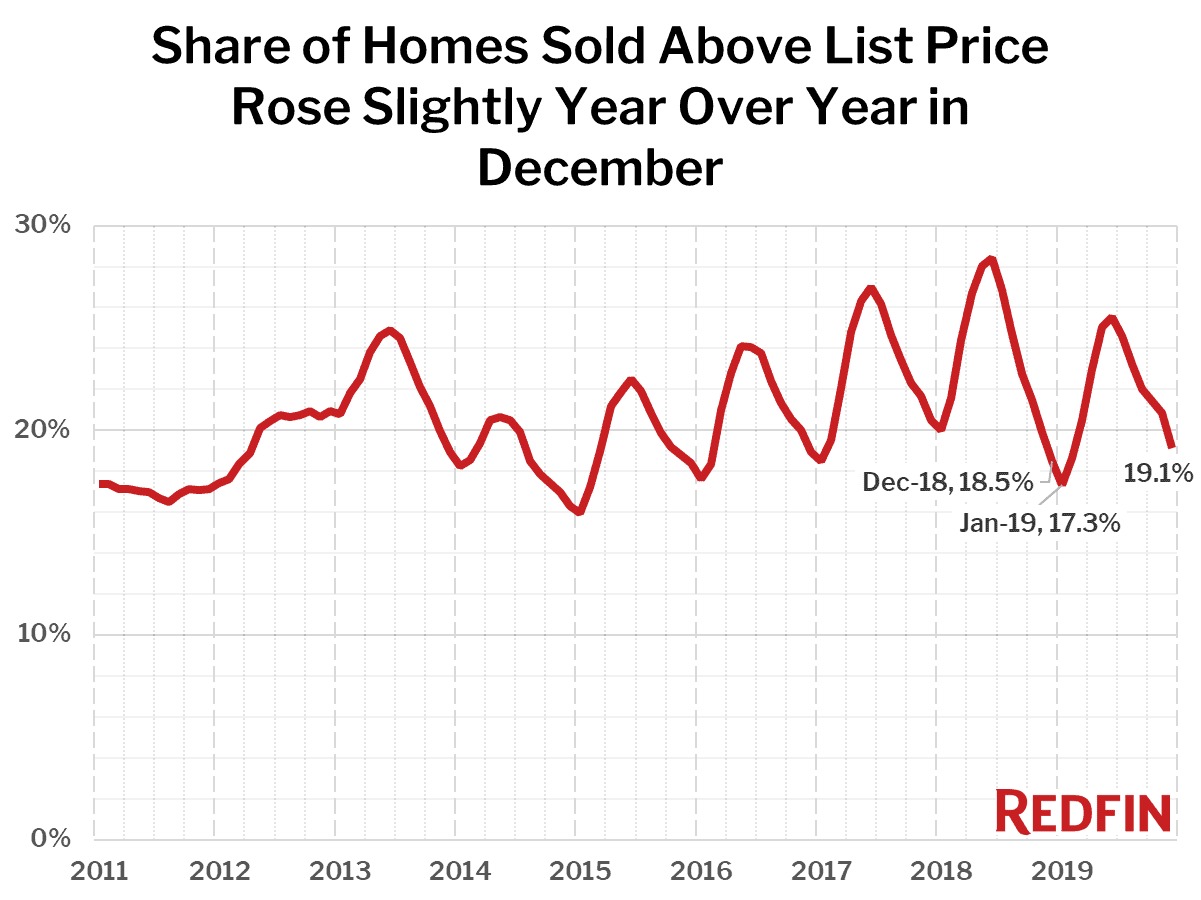
| Sold above list | 19.1% | -1.7 pts† | 0.6 pts† |
| Median Off-Market Redfin Estimate | $283,400 | -3.6% | 3.6% |
| Average Sale-to-list | 97.4% | -0.5 pts† | 0.3 pts† |
† – “pts” = percentage point change
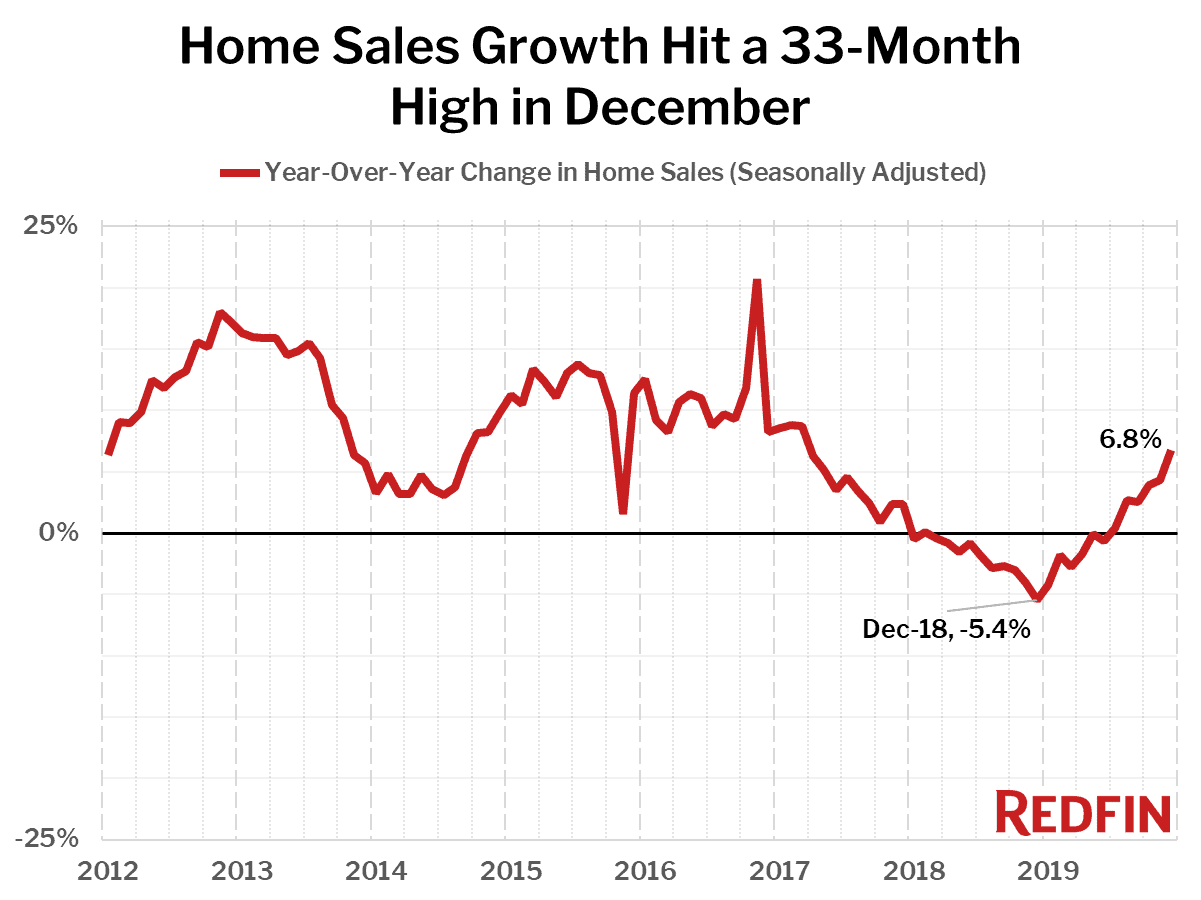
Nationwide, home sales increased 6.8% year over year in December, the fifth consecutive month of increases, and were up 1.0% from November on a seasonally-adjusted basis.
The markets with the biggest increases in home sales from a year ago were Anaheim, CA (37.7%), North Port, FL (35.8%) and New Haven, CT (23.0%).
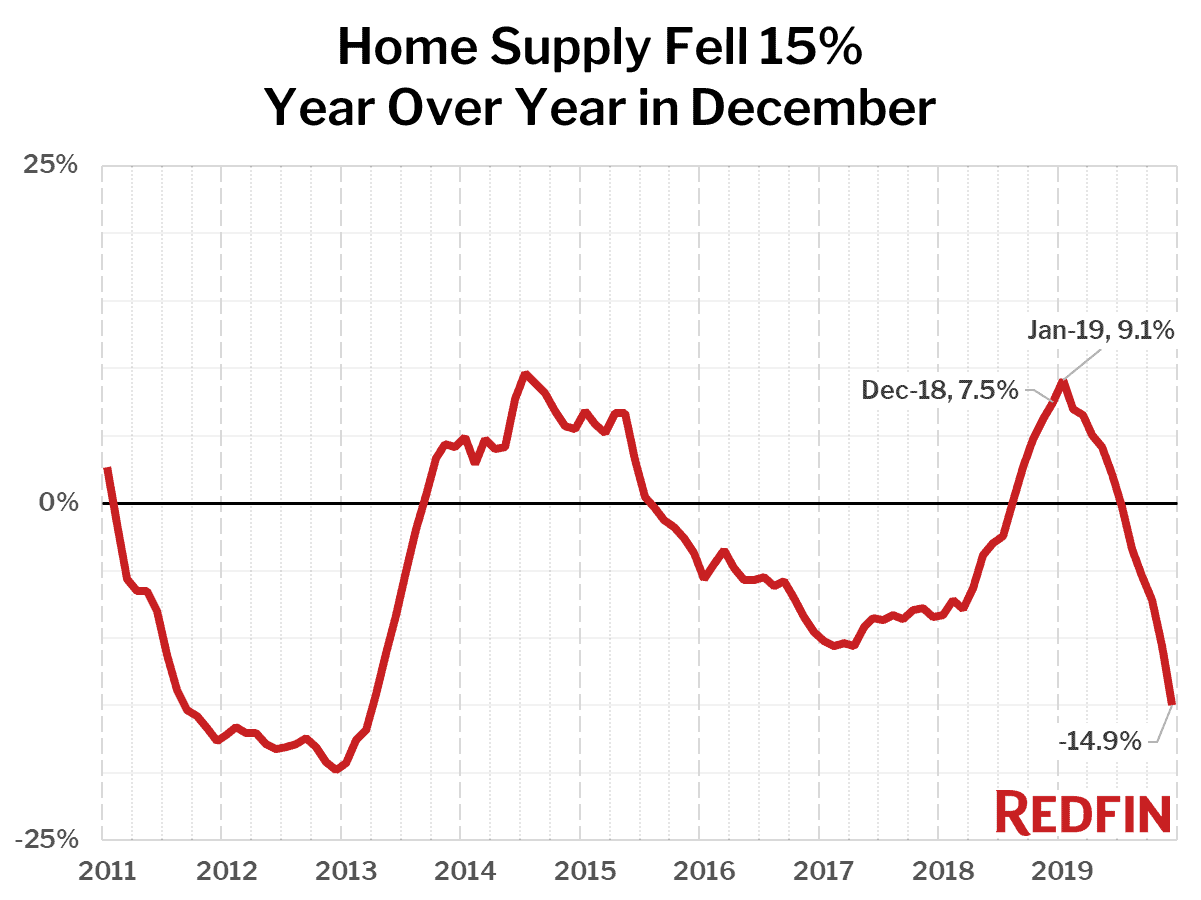
The supply of homes for sale fell 14.9% year over year, the biggest decline since March 2013 and the sixth straight month of declines. There were fewer homes for sale last month than any time since at least December 2012. Just one of the 85 largest metros tracked by Redfin posted a year-over-year increase in inventory: Knoxville, TN (5.3%).
Compared to a year ago, the biggest declines in the number of homes for sale were in Salt Lake City (-54.7%), Tacoma, WA (-44.3%) and San Diego, CA (-40.3%).
The rapid reduction in supply can be attributed both to the increase in home sales and to a decline in new listings, which fell 5.1% in December from a year earlier—the largest drop on record since our data began in 2012. “Many homeowners have refinanced their mortgages to take advantage of low interest rates and therefore feel committed to staying put,” continued Fairweather. “The lack of homes for sale is going to fuel competition and price growth in 2020.”
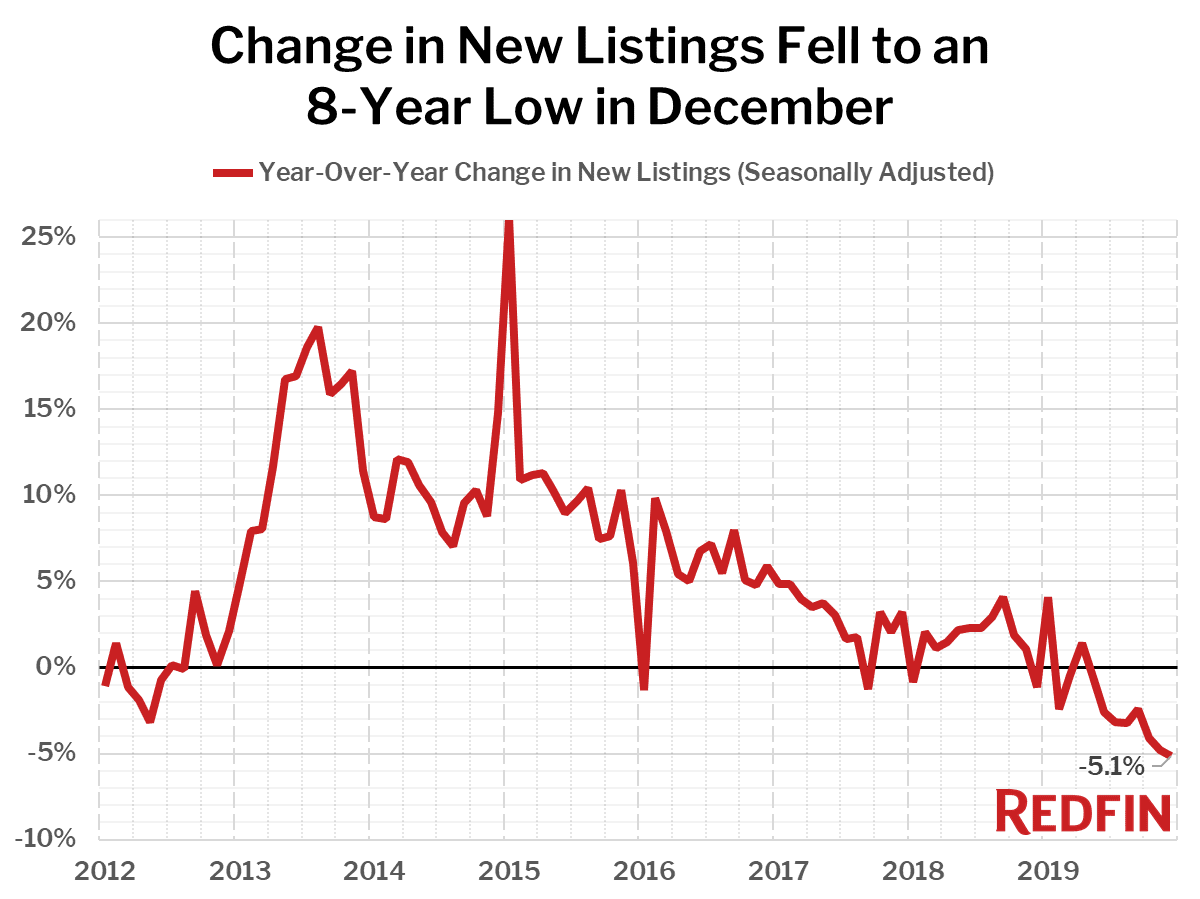
Seasonally-adjusted new listings in December fell the most from a year earlier in Salt Lake City (-50.4%), followed by Allentown, PA (-39.3%) and Kansas City, MO (-38.9%).
Homes sold in December spent two fewer days on market compared to the prior year. In December, the typical home went under contract in 50 days, compared to 52 days in December 2018.
The share of homes sold above list price increased year over year, coming in at 19.1% in December compared to 17.3% a year earlier.
Other December Highlights
Competition
- Omaha and Tacoma were the fastest markets, with half of all homes pending sale in just 21 days, down from 23 days and 34 days a year earlier, respectively. Grand Rapids, MI was the next fastest market with 25 median days on market, followed by Buffalo, NY (25) and Fresno (26).
- The most competitive market in December was San Francisco where 51.6% of homes sold above list price, followed by Oakland at 44.4%, Tacoma at 41.8%, San Jose at 40.0% and Los Angeles at 36.7%.
Prices
- Memphis had the nation’s highest price growth, rising 15.9% since last year to $190,000. Camden, NJ had the second highest at 14.7% year-over-year price growth, followed by Cincinnati (14.4%), Honolulu (14.1%), and Newark, NJ (13.4%).
- 2 metros saw price declines in December: New York (-2.4%) and San Francisco (-1.7%).
Sales
- Anaheim led the nation in year-over-year sales growth, up 37.7%, followed by North Port, FL, up 35.8%. New Haven rounded out the top three with sales up 23.0% from a year ago.
- Salt Lake City saw the largest decline in sales since last year, falling 2.8%. Home sales in Camden and New York declined by 2.5% and 1.9%, respectively.
Inventory
- Knoxville had the highest increase in the number of homes for sale, up 5.3% year over year.
- Salt Lake City had the largest decrease in overall inventory, falling 54.7% since last December. Tacoma (-44.3%), San Diego (-40.3%), and Seattle (-39.7%) also saw far fewer homes available on the market than a year ago.
Redfin Estimate
- Miami (90.2%) had the largest share of homes predicted to sell for below list price, according to Redfin Estimate data, followed by Fort Lauderdale (87.3%) and West Palm Beach (87.0%).
- San Francisco (10.8%) had the largest share of homes predicted to sell at or above list price, followed by San Jose (15.1%) and Tacoma (17.4%).
Below are market-by-market breakdowns for prices, inventory, new listings and sales for markets with populations of 750,000 or more. For downloadable data on all of the markets Redfin tracks, visit the Redfin Data Center.
Median Sale Price
| Redfin Metro | Median Sale Price | Month-Over-Month | Year-Over-Year |
|---|---|---|---|
| Albany, NY | $215,000 | -3.4% | 10.3% |
| Allentown, PA | $206,000 | -1.9% | 8.4% |
| Anaheim, CA | $720,000 | 0.0% | 5.9% |
| Atlanta, GA | $250,000 | 2.0% | 5.7% |
| Austin, TX | $322,400 | 4.4% | 6.2% |
| Bakersfield, CA | $251,000 | 0.8% | 11.1% |
| Baltimore, MD | $279,500 | 1.6% | 7.5% |
| Baton Rouge, LA | $215,000 | 8.1% | 5.9% |
| Birmingham, AL | $212,000 | 1.0% | 9.8% |
| Boston, MA | $500,000 | 2.0% | 10.4% |
| Bridgeport, CT | $390,000 | 2.6% | 2.5% |
| Buffalo, NY | $160,000 | 0.6% | 8.8% |
| Camden, NJ | $195,000 | -2.5% | 14.7% |
| Charlotte, NC | $267,000 | 3.5% | 11.3% |
| Chicago, IL | $241,000 | 0.0% | 5.2% |
| Cincinnati, OH | $187,000 | 2.5% | 14.4% |
| Cleveland, OH | $146,000 | -2.7% | 1.4% |
| Columbus, OH | $210,000 | -0.5% | 5.1% |
| Dallas, TX | $303,400 | 2.8% | 2.8% |
| Dayton, OH | $135,000 | -3.5% | 3.8% |
| Denver, CO | $412,500 | -0.6% | 4.4% |
| Detroit, MI | $135,000 | -3.6% | 9.8% |
| El Paso, TX | $172,700 | 1.9% | 8.6% |
| Elgin, IL | $215,000 | -7.3% | 0.9% |
| Fort Lauderdale, FL | $280,000 | 1.5% | 8.6% |
| Fort Worth, TX | $249,900 | 1.6% | 4.6% |
| Frederick, MD | $410,000 | -2.9% | 4.9% |
| Fresno, CA | $277,000 | -3.8% | 5.3% |
| Grand Rapids, MI | $205,000 | -0.5% | 7.9% |
| Greensboro, NC | $175,500 | -2.5% | 13.3% |
| Greenville, SC | $213,000 | -1.5% | 2.4% |
| Hartford, CT | $219,900 | -0.5% | 4.5% |
| Houston, TX | $254,000 | 4.5% | 5.8% |
| Indianapolis, IN | $192,000 | 3.2% | 9.7% |
| Jacksonville, FL | $238,000 | 2.6% | 3.5% |
| Kansas City, MO | $225,000 | 2.3% | 9.8% |
| Knoxville, TN | $219,000 | 1.2% | 12.9% |
| Lake County, IL | $224,600 | -2.8% | 4.5% |
| Las Vegas, NV | $295,000 | 2.4% | 6.5% |
| Los Angeles, CA | $649,000 | 1.4% | 8.2% |
| Louisville, KY | $198,000 | 4.2% | 7.0% |
| McAllen, TX | $164,000 | 2.6% | 12.4% |
| Memphis, TN | $190,000 | 5.6% | 15.9% |
| Miami, FL | $317,000 | 1.0% | 7.5% |
| Milwaukee, WI | $218,000 | 0.4% | 11.8% |
| Minneapolis, MN | $279,800 | -0.1% | 7.6% |
| Montgomery County, PA | $315,000 | -1.6% | 5.0% |
| Nashville, TN | $313,600 | 2.5% | 8.2% |
| Nassau County, NY | $465,000 | 2.2% | 6.9% |
| New Brunswick, NJ | $317,500 | -3.8% | 3.8% |
| New Haven, CT | $215,000 | 2.4% | 3.6% |
| New Orleans, LA | $229,400 | -2.4% | 6.5% |
| New York, NY | $488,000 | -3.4% | -2.4% |
| Newark, NJ | $368,500 | 2.6% | 13.4% |
| North Port, FL | $285,200 | 2.1% | 6.4% |
| Oakland, CA | $725,000 | 0.8% | 5.3% |
| Oklahoma City, OK | $185,000 | 0.6% | 10.4% |
| Omaha, NE | $200,200 | -3.3% | 5.4% |
| Orlando, FL | $266,500 | 4.1% | 6.6% |
| Oxnard, CA | $606,500 | -0.6% | 1.1% |
| Philadelphia, PA | $215,000 | -1.4% | 13.2% |
| Phoenix, AZ | $292,500 | 2.6% | 10.4% |
| Pittsburgh, PA | $169,900 | -4.0% | 4.6% |
| Portland, OR | $400,000 | -2.7% | 3.9% |
| Providence, RI | $289,000 | -2.2% | 7.8% |
| Raleigh, NC | $290,000 | -1.0% | 3.9% |
| Richmond, VA | $265,000 | 3.9% | 11.8% |
| Riverside, CA | $380,000 | 0.1% | 5.8% |
| Rochester, NY | $149,900 | -0.1% | 9.0% |
| Sacramento, CA | $410,000 | -0.7% | 3.8% |
| Salt Lake City, UT | $348,300 | 1.0% | 10.6% |
| San Antonio, TX | $235,000 | 4.2% | 4.4% |
| San Diego, CA | $581,000 | -3.2% | 2.8% |
| San Francisco, CA | $1,322,500 | -3.8% | -1.7% |
| San Jose, CA | $1,053,800 | -2.5% | 2.3% |
| Seattle, WA | $572,500 | 3.1% | 6.0% |
| St. Louis, MO | $185,300 | 1.8% | 7.4% |
| Tacoma, WA | $375,000 | 0.0% | 9.3% |
| Tampa, FL | $245,000 | 2.9% | 7.0% |
| Tucson, AZ | $237,100 | 5.4% | 12.9% |
| Tulsa, OK | $178,000 | 4.7% | 7.2% |
| Urban Honolulu, HI | $615,000 | 6.8% | 14.1% |
| Virginia Beach, VA | $239,900 | 3.0% | 9.6% |
| Warren, MI | $211,000 | -0.7% | 8.2% |
| Washington, DC | $415,000 | 0.0% | 3.8% |
| West Palm Beach, FL | $290,000 | 0.0% | 8.3% |
| Worcester, MA | $282,000 | 2.5% | 8.9% |
| National | $312,500 | 0.5% | 6.9% |
Homes Sold
| Redfin Metro | Homes Sold, seasonally adjusted | Month-Over-Month | Year-Over-Year |
|---|---|---|---|
| Albany, NY | 816 | -5.0% | -1.6% |
| Allentown, PA | 907 | -1.0% | 7.7% |
| Anaheim, CA | 2,666 | 2.8% | 32.7% |
| Atlanta, GA | 9,230 | 1.3% | 4.4% |
| Austin, TX | 3,112 | -0.4% | 7.0% |
| Bakersfield, CA | 736 | -1.0% | -2.0% |
| Baltimore, MD | 3,595 | -0.2% | 9.7% |
| Baton Rouge, LA | 879 | 2.6% | 15.8% |
| Boston, MA | 4,447 | 7.1% | 12.9% |
| Bridgeport, CT | 1,068 | 5.1% | 8.7% |
| Buffalo, NY | 1,009 | -6.0% | -4.3% |
| Camden, NJ | 1,630 | -3.7% | -4.6% |
| Charlotte, NC | 3,860 | 0.8% | 12.6% |
| Chicago, IL | 8,156 | 3.6% | 7.4% |
| Cincinnati, OH | 2,695 | 0.6% | 3.8% |
| Cleveland, OH | 2,442 | -1.5% | 1.0% |
| Columbus, OH | 2,654 | 1.2% | 8.4% |
| Dallas, TX | 5,804 | 2.0% | 9.8% |
| Dayton, OH | 1,030 | 1.2% | 4.9% |
| Denver, CO | 4,916 | 5.4% | 15.4% |
| Detroit, MI | 1,725 | -0.5% | -5.2% |
| El Paso, TX | 700 | -2.6% | 5.7% |
| Elgin, IL | 937 | -0.4% | 2.5% |
| Fort Lauderdale, FL | 2,894 | -0.4% | 3.6% |
| Fort Worth, TX | 2,859 | -0.7% | 1.7% |
| Frederick, MD | 1,489 | -0.1% | 8.0% |
| Fresno, CA | 760 | -1.5% | 2.5% |
| Grand Rapids, MI | 1,321 | -3.6% | 4.3% |
| Greensboro, NC | 833 | -1.5% | 17.5% |
| Greenville, SC | 1,169 | 7.2% | 16.8% |
| Hartford, CT | 1,315 | 1.1% | 6.0% |
| Houston, TX | 7,860 | 2.5% | 10.4% |
| Indianapolis, IN | 2,970 | -1.4% | 7.1% |
| Jacksonville, FL | 2,497 | 2.6% | 10.0% |
| Kansas City, MO | 3,134 | 3.2% | 9.5% |
| Knoxville, TN | 1,278 | 3.9% | 10.6% |
| Lake County, IL | 1,082 | 4.3% | 7.5% |
| Las Vegas, NV | 3,477 | 0.1% | 14.3% |
| Los Angeles, CA | 5,905 | -1.1% | 10.1% |
| Louisville, KY | 1,282 | -9.6% | -1.0% |
| McAllen, TX | 267 | -14.6% | 9.7% |
| Memphis, TN | 1,092 | -1.3% | -0.6% |
| Miami, FL | 2,412 | -6.0% | -1.6% |
| Milwaukee, WI | 1,820 | 1.9% | 8.9% |
| Minneapolis, MN | 5,261 | 1.2% | 6.7% |
| Montgomery County, PA | 2,230 | 0.5% | 4.6% |
| Nashville, TN | 3,522 | 1.8% | 16.1% |
| Nassau County, NY | 2,551 | -2.8% | -0.9% |
| New Brunswick, NJ | 2,976 | -5.9% | 1.5% |
| New Haven, CT | 939 | 1.7% | 17.6% |
| New Orleans, LA | 1,161 | -6.1% | 0.8% |
| New York, NY | 4,318 | -2.9% | -5.7% |
| Newark, NJ | 2,187 | 4.0% | 6.8% |
| North Port, FL | 2,095 | 5.7% | 24.4% |
| Oakland, CA | 2,292 | 4.4% | 11.3% |
| Oklahoma City, OK | 1,916 | -1.0% | 9.3% |
| Omaha, NE | 1,165 | -1.4% | 7.7% |
| Orlando, FL | 4,082 | 2.6% | 13.2% |
| Oxnard, CA | 694 | -5.0% | 7.6% |
| Philadelphia, PA | 2,123 | -0.9% | 0.3% |
| Phoenix, AZ | 8,465 | -0.8% | 16.8% |
| Pittsburgh, PA | 2,162 | -0.8% | 4.2% |
| Portland, OR | 3,356 | 2.0% | 14.0% |
| Providence, RI | 1,853 | 2.0% | 11.3% |
| Raleigh, NC | 2,463 | 3.7% | 17.3% |
| Richmond, VA | 1,637 | -0.1% | 15.0% |
| Riverside, CA | 4,769 | 0.3% | 9.1% |
| Rochester, NY | 1,051 | -3.1% | -0.1% |
| Sacramento, CA | 2,648 | 0.7% | 6.7% |
| Salt Lake City, UT | 1,497 | -3.8% | -5.4% |
| San Antonio, TX | 2,876 | 1.7% | 7.2% |
| San Diego, CA | 3,069 | 0.8% | 16.4% |
| San Francisco, CA | 916 | 0.7% | 8.7% |
| San Jose, CA | 1,208 | -0.1% | 12.8% |
| Seattle, WA | 3,980 | 0.7% | 10.5% |
| St. Louis, MO | 3,547 | 2.6% | 8.3% |
| Tacoma, WA | 1,329 | 2.7% | 2.2% |
| Tampa, FL | 5,626 | 3.4% | 13.3% |
| Tucson, AZ | 1,557 | 2.3% | 11.6% |
| Tulsa, OK | 1,156 | -2.5% | 6.0% |
| Urban Honolulu, HI | 748 | 0.9% | 3.1% |
| Virginia Beach, VA | 2,239 | -4.1% | 11.4% |
| Warren, MI | 3,412 | -0.1% | 1.2% |
| Washington, DC | 6,043 | 1.4% | 1.4% |
| West Palm Beach, FL | 2,780 | -0.3% | 4.3% |
| Worcester, MA | 1,029 | 0.9% | 5.1% |
| National | 276,800 | 1.0% | 6.8% |
New Listings
| Redfin Metro | New Listings, seasonally adjusted | Month-Over-Month | Year-Over-Year |
|---|---|---|---|
| Albany, NY | 934 | -0.4% | -15.6% |
| Allentown, PA | 845 | -2.5% | -19.8% |
| Anaheim, CA | 2,727 | 0.0% | -7.5% |
| Atlanta, GA | 10,670 | 1.7% | 0.8% |
| Austin, TX | 3,524 | -0.4% | 1.5% |
| Bakersfield, CA | 876 | -4.6% | -5.0% |
| Baltimore, MD | 4,025 | -4.0% | -6.3% |
| Baton Rouge, LA | 821 | -12.4% | -23.2% |
| Boston, MA | 4,573 | 0.0% | -8.7% |
| Bridgeport, CT | 1,230 | -0.3% | 4.5% |
| Buffalo, NY | 1,067 | -4.0% | -16.2% |
| Camden, NJ | 1,936 | -1.6% | -7.5% |
| Charlotte, NC | 4,079 | 0.8% | 0.4% |
| Chicago, IL | 10,393 | 0.9% | -0.4% |
| Cincinnati, OH | 2,963 | -0.9% | 0.2% |
| Cleveland, OH | 2,813 | 0.3% | -5.0% |
| Columbus, OH | 2,766 | -2.0% | -1.6% |
| Dallas, TX | 7,143 | 0.7% | 1.1% |
| Dayton, OH | 1,166 | 4.7% | 16.0% |
| Denver, CO | 5,291 | 5.6% | 8.5% |
| Detroit, MI | 2,157 | -1.6% | -8.3% |
| El Paso, TX | 885 | 8.1% | 3.5% |
| Elgin, IL | 1,176 | 0.8% | 0.3% |
| Fort Lauderdale, FL | 3,539 | -3.7% | -11.4% |
| Fort Worth, TX | 3,534 | 3.2% | 7.3% |
| Frederick, MD | 1,685 | -4.5% | 2.9% |
| Fresno, CA | 845 | -6.7% | -7.3% |
| Grand Rapids, MI | 1,404 | -2.0% | -8.3% |
| Greensboro, NC | 802 | -2.3% | -4.6% |
| Greenville, SC | 1,365 | 6.3% | 13.0% |
| Hartford, CT | 1,402 | -4.7% | 4.7% |
| Houston, TX | 9,837 | 0.0% | 2.3% |
| Indianapolis, IN | 2,818 | -6.7% | -6.3% |
| Jacksonville, FL | 2,765 | 1.0% | 4.8% |
| Kansas City, MO | 2,831 | -4.8% | -17.0% |
| Knoxville, TN | 1,147 | -12.1% | -9.1% |
| Lake County, IL | 1,258 | -7.2% | -14.8% |
| Las Vegas, NV | 3,512 | -3.2% | -19.5% |
| Los Angeles, CA | 6,536 | 0.8% | -8.7% |
| Louisville, KY | 1,420 | -4.5% | -8.3% |
| McAllen, TX | 409 | -14.6% | -13.7% |
| Memphis, TN | 1,224 | -4.9% | -11.1% |
| Miami, FL | 3,704 | -5.6% | -11.5% |
| Milwaukee, WI | 1,875 | 1.1% | -16.8% |
| Minneapolis, MN | 5,547 | 0.0% | 0.9% |
| Montgomery County, PA | 2,679 | -0.5% | 6.6% |
| Nashville, TN | 3,988 | -2.4% | 3.5% |
| Nassau County, NY | 3,262 | -1.5% | -4.3% |
| New Brunswick, NJ | 3,330 | -8.0% | -14.8% |
| New Haven, CT | 984 | -6.9% | -1.4% |
| New Orleans, LA | 1,340 | -7.7% | -0.4% |
| New York, NY | 7,530 | 0.7% | -5.5% |
| Newark, NJ | 2,326 | -9.9% | -18.1% |
| North Port, FL | 2,214 | -1.6% | 0.8% |
| Oakland, CA | 2,492 | 2.8% | -3.2% |
| Oklahoma City, OK | 2,169 | 2.4% | 6.0% |
| Omaha, NE | 1,275 | 6.2% | 11.6% |
| Orlando, FL | 4,493 | -1.5% | -0.1% |
| Oxnard, CA | 796 | 0.1% | -4.8% |
| Philadelphia, PA | 2,632 | -7.5% | -6.4% |
| Phoenix, AZ | 8,094 | -1.0% | -8.8% |
| Pittsburgh, PA | 2,483 | -1.9% | 5.7% |
| Portland, OR | 3,317 | -1.6% | 1.2% |
| Providence, RI | 2,089 | -1.0% | -5.0% |
| Raleigh, NC | 2,379 | -8.4% | -6.7% |
| Richmond, VA | 1,705 | -1.0% | -3.6% |
| Riverside, CA | 5,203 | -0.7% | -7.9% |
| Rochester, NY | 1,194 | 1.1% | 4.4% |
| Sacramento, CA | 2,980 | 0.2% | -5.5% |
| Salt Lake City, UT | 1,357 | -2.8% | -26.0% |
| San Antonio, TX | 3,573 | 4.3% | 7.5% |
| San Diego, CA | 3,233 | 0.7% | -5.5% |
| San Francisco, CA | 1,047 | 4.8% | 4.2% |
| San Jose, CA | 1,174 | 3.1% | -15.7% |
| Seattle, WA | 4,062 | 1.5% | 15.8% |
| St. Louis, MO | 3,050 | -6.2% | -21.5% |
| Tacoma, WA | 1,364 | 6.8% | 5.3% |
| Tampa, FL | 5,886 | -1.4% | -4.9% |
| Tulsa, OK | 1,127 | -3.5% | -19.9% |
| Urban Honolulu, HI | 839 | -5.2% | -20.6% |
| Virginia Beach, VA | 2,424 | -4.8% | -3.2% |
| Warren, MI | 3,818 | -1.0% | -9.1% |
| Washington, DC | 6,625 | -1.3% | -2.0% |
| West Palm Beach, FL | 3,493 | 0.1% | -5.3% |
| Worcester, MA | 1,046 | -15.8% | -14.6% |
| National | 304,600 | -1.3% | -5.1% |
All Homes for Sale
| Redfin Metro | All Homes for Sale | Month-Over-Month | Year-Over-Year |
|---|---|---|---|
| Albany, NY | 2,456 | -15.1% | -16.3% |
| Allentown, PA | 1,595 | -11.6% | -32.4% |
| Anaheim, CA | 4,752 | -26.2% | -32.2% |
| Atlanta, GA | 22,448 | -10.4% | -8.9% |
| Austin, TX | 5,421 | -16.5% | -19.1% |
| Bakersfield, CA | 1,531 | -13.7% | -20.1% |
| Baltimore, MD | 7,937 | -20.1% | -13.7% |
| Baton Rouge, LA | 3,301 | -0.9% | -11.1% |
| Birmingham, AL | 3,333 | -14.7% | -17.3% |
| Boston, MA | 5,365 | -34.6% | -19.2% |
| Bridgeport, CT | 4,159 | -19.8% | -9.4% |
| Buffalo, NY | 1,663 | -16.2% | -19.9% |
| Camden, NJ | 4,353 | -15.6% | -28.6% |
| Charlotte, NC | 7,925 | -17.0% | -17.8% |
| Chicago, IL | 26,941 | -7.0% | 14.9% |
| Cincinnati, OH | 5,574 | -18.1% | -16.0% |
| Cleveland, OH | 5,938 | -20.3% | -17.3% |
| Columbus, OH | 4,573 | -22.7% | -6.8% |
| Dallas, TX | 13,881 | -18.9% | -9.4% |
| Dayton, OH | 1,938 | -15.9% | -18.3% |
| Denver, CO | 4,797 | -28.5% | -19.2% |
| Detroit, MI | 4,811 | -12.7% | -5.5% |
| El Paso, TX | 2,412 | -9.8% | -2.5% |
| Elgin, IL | 3,026 | -1.4% | 18.1% |
| Fort Lauderdale, FL | 12,629 | -5.2% | -10.1% |
| Fort Worth, TX | 5,847 | -17.6% | -6.0% |
| Frederick, MD | 2,477 | -24.5% | -8.9% |
| Fresno, CA | 1,287 | -18.7% | -23.3% |
| Grand Rapids, MI | 2,077 | -16.9% | -4.8% |
| Greensboro, NC | 1,618 | -10.4% | -23.3% |
| Greenville, SC | 3,483 | -10.7% | -0.5% |
| Hartford, CT | 4,026 | -19.7% | -12.0% |
| Houston, TX | 23,688 | -10.4% | -5.9% |
| Indianapolis, IN | 4,563 | -18.6% | -15.7% |
| Jacksonville, FL | 6,240 | -12.4% | -16.6% |
| Knoxville, TN | 3,331 | -11.3% | 5.3% |
| Lake County, IL | 3,830 | -8.0% | 8.2% |
| Las Vegas, NV | 8,575 | -14.7% | -13.7% |
| Los Angeles, CA | 11,656 | -24.9% | -28.4% |
| Louisville, KY | 2,621 | -15.7% | -8.8% |
| McAllen, TX | 1,701 | -7.7% | -12.5% |
| Memphis, TN | 2,368 | -15.1% | -11.1% |
| Miami, FL | 17,075 | -6.7% | -9.6% |
| Milwaukee, WI | 3,585 | -20.6% | -7.3% |
| Minneapolis, MN | 7,011 | -24.9% | -13.7% |
| Montgomery County, PA | 4,311 | -20.9% | -18.3% |
| Nashville, TN | 9,074 | -13.5% | -8.1% |
| Nassau County, NY | 8,633 | -15.0% | -11.1% |
| New Brunswick, NJ | 9,280 | -15.8% | -15.3% |
| New Haven, CT | 2,704 | -18.8% | -17.2% |
| New Orleans, LA | 3,883 | -10.8% | -2.1% |
| New York, NY | 29,865 | -8.0% | -12.7% |
| Newark, NJ | 6,726 | -15.5% | -8.2% |
| North Port, FL | 6,324 | -3.3% | -19.9% |
| Oakland, CA | 1,597 | -37.6% | -35.7% |
| Oklahoma City, OK | 4,326 | -8.4% | -14.1% |
| Omaha, NE | 1,570 | -15.4% | -12.5% |
| Orlando, FL | 8,435 | -10.0% | -17.9% |
| Oxnard, CA | 1,502 | -18.7% | -10.8% |
| Philadelphia, PA | 5,466 | -18.6% | -8.1% |
| Phoenix, AZ | 13,259 | -16.3% | -31.8% |
| Pittsburgh, PA | 7,192 | -13.6% | -5.3% |
| Portland, OR | 4,653 | -21.3% | -22.9% |
| Providence, RI | 4,183 | -19.7% | -18.1% |
| Raleigh, NC | 5,030 | -17.7% | -12.1% |
| Richmond, VA | 2,470 | -20.4% | -17.1% |
| Riverside, CA | 11,805 | -17.3% | -25.2% |
| Rochester, NY | 1,361 | -18.9% | -18.9% |
| Sacramento, CA | 3,200 | -28.5% | -32.7% |
| Salt Lake City, UT | 1,561 | -18.1% | -54.7% |
| San Antonio, TX | 8,013 | -11.0% | -4.1% |
| San Diego, CA | 4,108 | -24.2% | -40.3% |
| San Francisco, CA | 850 | -45.5% | -15.5% |
| San Jose, CA | 923 | -43.6% | -37.8% |
| Seattle, WA | 3,308 | -31.4% | -39.7% |
| St. Louis, MO | 6,842 | -12.8% | -25.0% |
| Tacoma, WA | 1,042 | -23.1% | -44.3% |
| Tampa, FL | 11,303 | -9.5% | -23.0% |
| Tulsa, OK | 2,449 | 0.7% | -32.9% |
| Urban Honolulu, HI | 3,040 | -11.7% | -2.4% |
| Virginia Beach, VA | 4,788 | -16.0% | -24.2% |
| Warren, MI | 7,095 | -17.9% | -3.9% |
| Washington, DC | 9,077 | -23.6% | -19.1% |
| West Palm Beach, FL | 12,387 | -4.5% | -11.9% |
| Worcester, MA | 1,695 | -28.6% | -23.0% |
| National | 646,800 | -14.6% | -14.9% |
Median Off-Market Redfin Estimate
| Redfin Metro | Estimate | Month-Over-Month | Year-Over-Year |
|---|---|---|---|
| Albany, NY | $195,100 | -6.2% | -9.3% |
| Allentown, PA | $208,200 | -3.7% | -0.4% |
| Atlanta, GA | $226,900 | -1.7% | 4.2% |
| Austin, TX | $294,100 | -4.3% | -2.0% |
| Bakersfield, CA | $189,600 | -9.2% | -12.1% |
| Baltimore, MD | $266,200 | -0.9% | 4.9% |
| Baton Rouge, LA | $126,800 | -16.6% | -16.2% |
| Birmingham, AL | $130,700 | -8.2% | -12.1% |
| Boston, MA | $515,900 | 1.4% | 5.9% |
| Bridgeport, CT | $388,600 | 0.1% | -37.8% |
| Buffalo, NY | $147,600 | -5.5% | -5.7% |
| Camden, NJ | $201,900 | -1.1% | 4.7% |
| Charlotte, NC | $200,600 | -3.2% | -2.1% |
| Chicago, IL | $259,400 | 1.3% | 7.0% |
| Cincinnati, OH | $161,400 | -5.1% | -3.9% |
| Cleveland, OH | $138,300 | -4.3% | 0.1% |
| Columbus, OH | $193,000 | -2.8% | 2.5% |
| Dallas, TX | $255,100 | -2.9% | -0.4% |
| Dayton, OH | $121,800 | -1.8% | 4.3% |
| Denver, CO | $405,200 | -1.5% | -1.0% |
| Detroit, MI | $102,200 | -5.0% | -3.8% |
| Fort Lauderdale, FL | $266,300 | -1.1% | 1.4% |
| Fort Worth, TX | $216,400 | -3.7% | 1.8% |
| Fresno, CA | $255,000 | -1.9% | 0.7% |
| Grand Rapids, MI | $166,100 | -2.1% | 4.0% |
| Greenville, SC | $155,600 | -10.5% | -7.8% |
| Hartford, CT | $221,400 | 0.0% | -34.4% |
| Houston, TX | $195,200 | -4.7% | -5.9% |
| Indianapolis, IN | $160,600 | -2.9% | 0.5% |
| Jacksonville, FL | $206,200 | -4.9% | -4.7% |
| Kansas City, MO | $179,200 | -3.1% | -3.5% |
| Knoxville, TN | $174,100 | -2.7% | 16.1% |
| Las Vegas, NV | $280,200 | -0.4% | 2.7% |
| Los Angeles, CA | $633,900 | -0.3% | 0.6% |
| Louisville, KY | $173,000 | -1.5% | 14.8% |
| Memphis, TN | $142,300 | -2.2% | 5.8% |
| Miami, FL | $312,400 | 0.1% | 5.8% |
| Milwaukee, WI | $194,900 | -1.8% | -6.8% |
| Minneapolis, MN | $268,800 | -1.3% | 4.0% |
| Montgomery County, PA | $320,100 | -0.9% | 1.3% |
| Nashville, TN | $269,500 | -1.2% | 8.8% |
| New Haven, CT | $219,700 | 0.0% | -28.5% |
| New Orleans, LA | $167,700 | -6.6% | -1.2% |
| Newark, NJ | $361,000 | -3.1% | -2.9% |
| Oakland, CA | $761,300 | -0.8% | -0.7% |
| Oklahoma City, OK | $142,500 | -4.2% | 1.1% |
| Omaha, NE | $186,500 | 0.2% | 10.4% |
| Orlando, FL | $230,200 | -2.8% | -0.3% |
| Oxnard, CA | $591,900 | -1.4% | -1.6% |
| Philadelphia, PA | $185,800 | -1.8% | -7.1% |
| Phoenix, AZ | $264,600 | -3.2% | -1.0% |
| Pittsburgh, PA | $131,200 | -8.4% | -9.3% |
| Portland, OR | $393,400 | -1.5% | 0.9% |
| Providence, RI | $287,600 | -2.5% | -2.5% |
| Raleigh, NC | $251,700 | -5.2% | -4.9% |
| Richmond, VA | $231,900 | -1.1% | 4.3% |
| Riverside, CA | $324,600 | -7.3% | -11.0% |
| Rochester, NY | $142,500 | -3.8% | -1.4% |
| Sacramento, CA | $406,200 | -1.5% | 1.2% |
| Salt Lake City, UT | $345,800 | -0.1% | 6.7% |
| San Antonio, TX | $181,800 | -6.7% | -5.2% |
| San Diego, CA | $590,900 | -1.2% | -0.2% |
| San Francisco, CA | $1,352,700 | 0.6% | 0.9% |
| San Jose, CA | $1,116,000 | -1.2% | -8.8% |
| Seattle, WA | $543,800 | -2.7% | -3.0% |
| St. Louis, MO | $155,400 | -3.9% | 0.1% |
| Tacoma, WA | $349,000 | -3.1% | 1.3% |
| Tampa, FL | $214,900 | -3.6% | -1.5% |
| Tucson, AZ | $197,900 | -6.0% | -4.4% |
| Tulsa, OK | $128,500 | -6.3% | -7.5% |
| Warren, MI | $208,100 | -1.2% | -1.6% |
| Washington, DC | $395,500 | -0.7% | 2.1% |
| West Palm Beach, FL | $271,700 | -1.0% | 2.6% |
| Worcester, MA | $274,600 | -3.5% | -3.3% |
| National | $283,400 | -3.6% | 3.6% |


