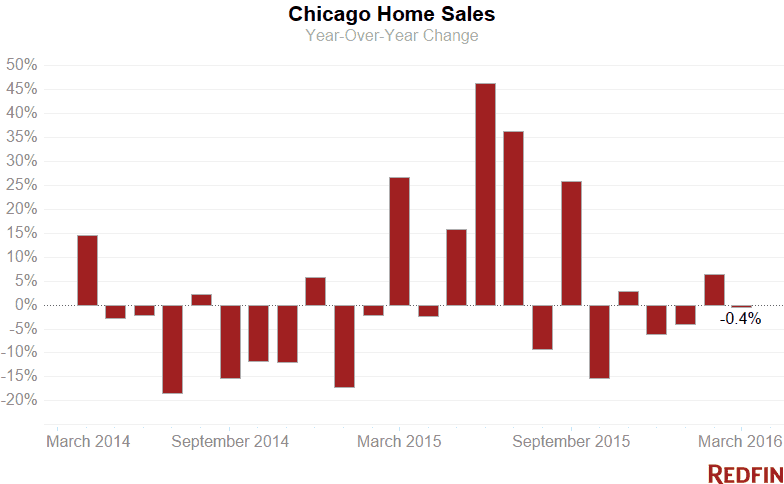
Chicago home prices were up 12 percent in March from a year ago, with the typical property selling for $252,000. Sales dipped 0.4 percent as buyers confronted a shortage of houses for sale.
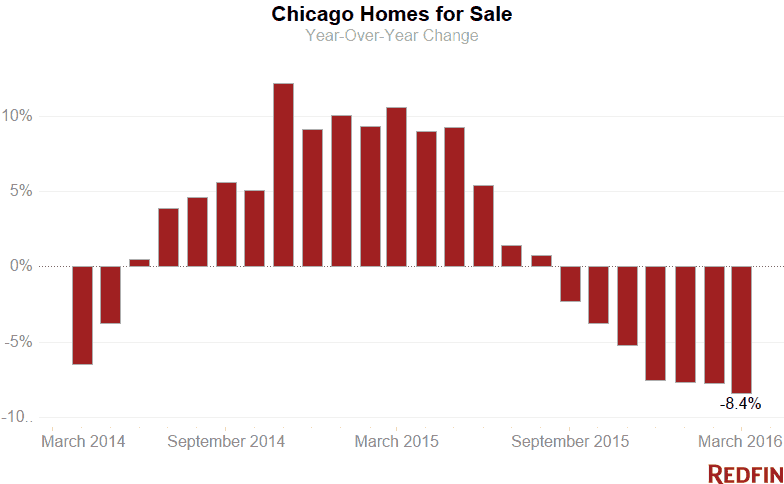
The inventory of homes on the market fell 8.4 percent, the seventh consecutive month of declines and the steepest drop in two years. New listings were down 5.5 percent, the third drop in the past four months.
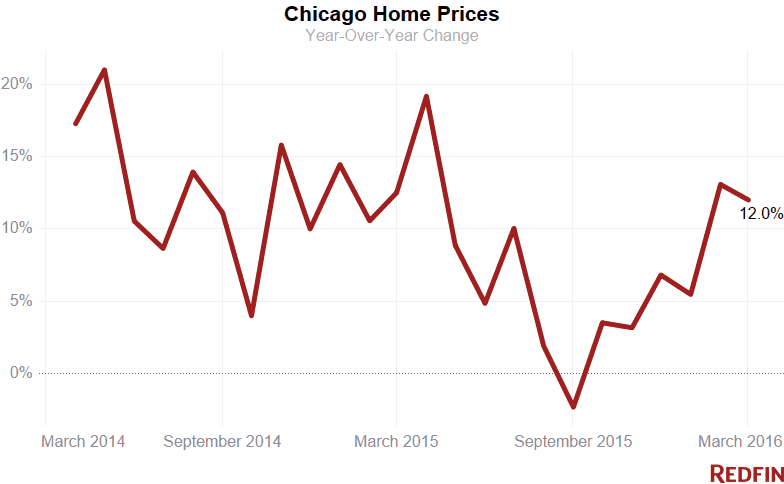
One in four houses sold for more than asking price. A typical home was on the market 74 days in Chicago, ten days fewer than a year ago.
With rental prices rising, property owners have a strong motivation to lease instead of sell.
“Would-be sellers are hoarding the houses,” Redfin real estate agent Greg Whelan said. “I’ve had more and more clients keep their current home and rent it out after purchasing a new one.”
“The low interest rates over the past five years make holding onto an appreciating asset all the more appealing,” said Whelan. “Currently, there are few other avenues available to get a solid return on your money. Cashing out just doesn’t makes sense if there’s no need to do so, especially when leasing your property often well exceeds your costs.”
Additionally, properties with two to four units, an asset class coveted by small investors looking to profit from rising rents, are in demand. The median price on those multi-unit buildings jumped a whopping 40.8 percent last month, to $159,450.
As with single-family homes, multi-unit inventory was down 12.5 percent. That pushed sales down 31 percent in March compared to a year ago.
Hot Neighborhoods
In Oakland, a near Southside neighborhood along Lake Michigan, only 10 homes sold in the first three months of the year but prices more than doubled, with a typical property seling for $349,900.
Edgewater had the city’s second-highest price growth, at 50.3 percent, with a typical home selling for $237,000. The neighborhood, known for its abundance of condos, had 149 sales in the first three months of 2016. Hyde Park, Bridgeport, McKinley Park and Gold Coast all had price appreciation at or above 40 percent.
Ukrainian Village, this year’s hottest neighborhood, was the most expensive in the city, with a typical home selling for $579,900. Nearby Bucktown took second place, with a median price of $514,000.
See our city page for the most up-to-date data on Chicago home prices.
Here’s what’s happening in your neighborhood:
| Place | Median Sale Price | Year-Over-Year | Homes Sold | Year-Over-Year | Inventory | Year-Over-Year | New Listings | Median Days on Market | Avg Sale-to-List |
|---|---|---|---|---|---|---|---|---|---|
| Albany Park | $245,000 | 6.3% | 91 | 21.3% | 145 | -5.2% | 157 | 94 | 96.4% |
| Andersonville | $370,450 | -9.1% | 30 | 25.0% | 59 | -15.7% | 72 | 62 | 97.0% |
| Archer Heights | $145,554 | -12.8% | 13 | -38.1% | 30 | 50.0% | 23 | 99 | 100.3% |
| Austin | $88,250 | 26.1% | 112 | 4.7% | 163 | -12.4% | 159 | 63.5 | 101.3% |
| Avondale | $292,500 | 0.8% | 62 | -32.6% | 110 | 4.8% | 143 | 68 | 98.8% |
| Beverly | $238,000 | 2.4% | 44 | 29.4% | 100 | -6.5% | 82 | 133 | 96.8% |
| Bridgeport | $355,000 | 45.5% | 37 | -11.9% | 84 | 9.1% | 68 | 69 | 98.6% |
| Brighton Park | $150,000 | 15.4% | 41 | -12.8% | 55 | -3.5% | 61 | 80 | 100.3% |
| Bucktown | $514,000 | 9.2% | 71 | 1.4% | 86 | -15.7% | 126 | 79 | 97.3% |
| Clearing | $160,000 | 18.1% | 53 | 15.2% | 93 | -10.6% | 86 | 90 | 97.8% |
| Edgewater | $248,000 | 50.3% | 149 | -1.3% | 293 | -19.1% | 304 | 100.5 | 96.8% |
| Edison Park | $310,000 | 10.6% | 19 | -40.6% | 65 | 14.0% | 56 | 124 | 96.6% |
| Englewood | $23,000 | 4.5% | 56 | -16.4% | 192 | -13.5% | 140 | 60 | 92.8% |
| Evanston | $250,000 | 4.8% | 97 | 42.6% | 387 | -13.2% | 152 | 82 | 97.3% |
| Garfield Ridge | $187,157 | 7.0% | 75 | -9.6% | 134 | 17.5% | 129 | 97 | 98.6% |
| Gold Coast | $380,000 | 40.0% | 99 | 6.4% | 257 | -11.4% | 214 | 106 | 94.7% |
| Humboldt Park | $178,000 | -24.9% | 111 | -8.3% | 194 | 9.6% | 226 | 73 | 100.9% |
| Hyde Park | $194,000 | 45.9% | 45 | 18.4% | 106 | -34.2% | 89 | 112.5 | 95.8% |
| Irving Park | $267,000 | 6.3% | 139 | 43.3% | 184 | -11.5% | 217 | 98 | 96.8% |
| Jefferson Park | $255,000 | 4.1% | 59 | 0.0% | 113 | 6.6% | 132 | 108 | 96.3% |
| Joliet | $154,000 | 19.0% | 193 | -4.0% | 670 | -28.5% | 302 | 78 | 96.6% |
| Kenwood | $170,000 | -18.4% | 35 | 2.9% | 91 | -4.2% | 75 | 99 | 97.8% |
| Lakeview | $382,200 | 6.2% | 376 | 10.3% | 743 | -9.9% | 882 | 92 | 97.6% |
| Lakeview / Wrigleyville | $383,900 | 6.6% | 377 | 10.6% | 746 | -9.9% | 886 | 92 | 97.6% |
| Lincoln Park | $417,750 | 1.6% | 114 | -1.7% | 261 | 8.8% | 267 | 85 | 96.7% |
| Lincoln Square | $397,000 | 26.0% | 32 | -21.9% | 115 | 21.1% | 106 | 142 | 96.8% |
| Logan Square | $426,500 | 31.0% | 144 | 10.8% | 189 | -3.6% | 270 | 74 | 99.6% |
| McKinley Park | $190,000 | 40.7% | 27 | 58.8% | 28 | -15.2% | 29 | 70 | 99.2% |
| Montclare | $195,000 | 11.4% | 21 | -27.6% | 34 | -42.4% | 30 | 98 | 97.6% |
| Mount Greenwood | $201,000 | 26.4% | 41 | -8.9% | 76 | 33.3% | 68 | 59 | 98.2% |
| Naperville | $330,000 | 7.5% | 178 | 4.1% | 1,159 | 3.4% | 472 | 104 | 97.0% |
| Near North Side | $392,750 | -1.8% | 496 | 5.1% | 1,095 | -4.9% | 1,096 | 88 | 97.1% |
| North Center | $465,100 | 10.7% | 55 | -6.8% | 118 | -16.3% | 128 | 104 | 96.9% |
| Oakland | $349,900 | 125.3% | 10 | 11.1% | 24 | -25.0% | 19 | 141.5 | 93.7% |
| Old Town | $375,000 | 20.5% | 64 | 10.3% | 103 | -12.0% | 130 | 102 | 96.5% |
| Portage Park | $269,000 | 3.9% | 131 | 15.9% | 169 | -17.6% | 183 | 100.5 | 98.0% |
| Pullman | $59,500 | 38.4% | 11 | -21.4% | 20 | 0.0% | 16 | 51 | 100.8% |
| Ravenswood | $325,000 | -14.6% | 45 | -19.6% | 109 | -6.0% | 133 | 83.5 | 97.6% |
| River North | $412,602 | 3.1% | 180 | 25.9% | 309 | 2.0% | 371 | 73 | 98.8% |
| Rogers Park | $166,550 | 9.2% | 96 | 20.0% | 197 | -7.5% | 174 | 99.5 | 97.1% |
| Roscoe Village | $457,500 | -5.7% | 78 | 52.9% | 138 | 10.4% | 180 | 104 | 98.2% |
| Sauganash | $310,000 | -11.1% | 27 | 68.8% | 54 | 1.9% | 61 | 112 | 94.6% |
| South Lawndale / Little Village | $90,500 | 38.2% | 34 | -8.1% | 54 | 1.9% | 48 | 68 | 98.0% |
| South Loop | $315,700 | -4.2% | 238 | 33.7% | 348 | -14.7% | 433 | 83 | 99.9% |
| South Shore | $60,000 | 15.3% | 67 | -16.2% | 141 | -18.5% | 105 | 100.5 | 96.4% |
| Streeterville | $420,000 | -9.7% | 121 | -6.2% | 322 | -11.3% | 284 | 113.5 | 95.9% |
| The Loop | $305,000 | -20.5% | 108 | -15.6% | 258 | -11.9% | 245 | 92 | 98.8% |
| Tri-taylor | $297,451.5 | 31.2% | 16 | 33.3% | 15 | -37.5% | 11 | 132 | 99.6% |
| Ukrainian Village | $579,900 | 18.1% | 23 | 53.3% | 46 | 2.2% | 56 | 103.5 | 96.2% |
| Uptown | $245,000 | 9.9% | 139 | 0.0% | 295 | -16.9% | 341 | 91 | 96.6% |
| Washington Park | $50,000 | -23.7% | 16 | 0.0% | 20 | -52.4% | 17 | 100 | 93.9% |
| West Loop | $367,450 | 5.0% | 112 | -23.3% | 177 | 0.6% | 282 | 45.5 | 100.5% |
| West Town | $449,900 | 7.6% | 295 | -2.0% | 496 | -3.3% | 639 | 79 | 98.7% |
| Wicker Park | $445,000 | 2.6% | 73 | -21.5% | 117 | -12.7% | 155 | 56 | 98.8% |
| Chicago, IL | $252,000 | 12.0% | 2,364 | -0.4% | 11,150 | -8.4% | 4,622 | 74 | 98.3% |
For more information, contact Redfin journalist services:
Phone: 206-588-6863
Email: press@redfin.com
See Redfin’s data center to find out what’s happening in other cities.
To be added to Redfin’s press release distribution list, please click here.
 United States
 Canada