Mortgage rates posted their biggest weekly jump since November, pushing the average cost of a 30-year loan to 3.66 percent as the Federal Reserve wrapped up its April meeting.
While rates are at their highest since March, home loans are cheaper than they were at this time last year (3.68 percent) and have held at less than 4 percent all year, according to Freddie Mac’s weekly survey.
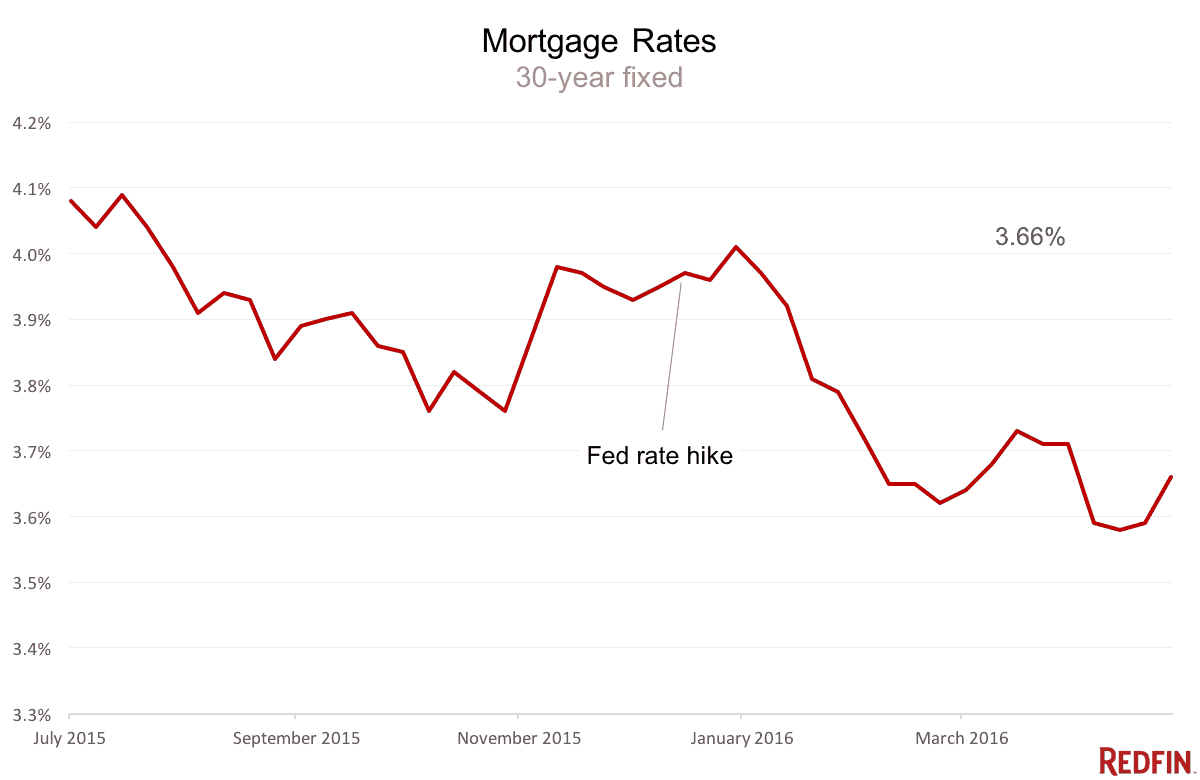
Source: Freddie Mac
There’s more
Here’s the bigger news. Today we got a first look at the economy’s 2016 performance and it wasn’t good. U.S. gross domestic product, the broadest measure of the country’s output, barely budged, growing at a paltry 0.5 percent pace. It was the worst showing in two years. We were growing almost three times this fast at the end of last year.
As the rest of the economy stalled, housing held strong. Spending on residential construction, remodeling and transactions rose an impressive 14.8 percent and helped hold us back from the brink of recession. Still, residential real estate has yet to return to its old starring role in the economy, thanks to the slow pace of construction and declining homeownership, among other things.
So what?
The economy tends to take a breather at the beginning of the year and things should pick up. On the plus side, employers are hiring and incomes are rising. Homebuilders are picking up the pace. But business and consumer spending is weak, which had Fed policymakers worried enough to keep their own benchmark rate steady yesterday.
In all, though, there’s good reason to think the economy will start to improve this spring, said Chris Low, chief economist at FTN Financial.
“Still, there is not yet anything in the data to suggest the rebound will be anywhere near as strong as last spring’s,” Low said. “For now, the Fed is right to be cautious.”
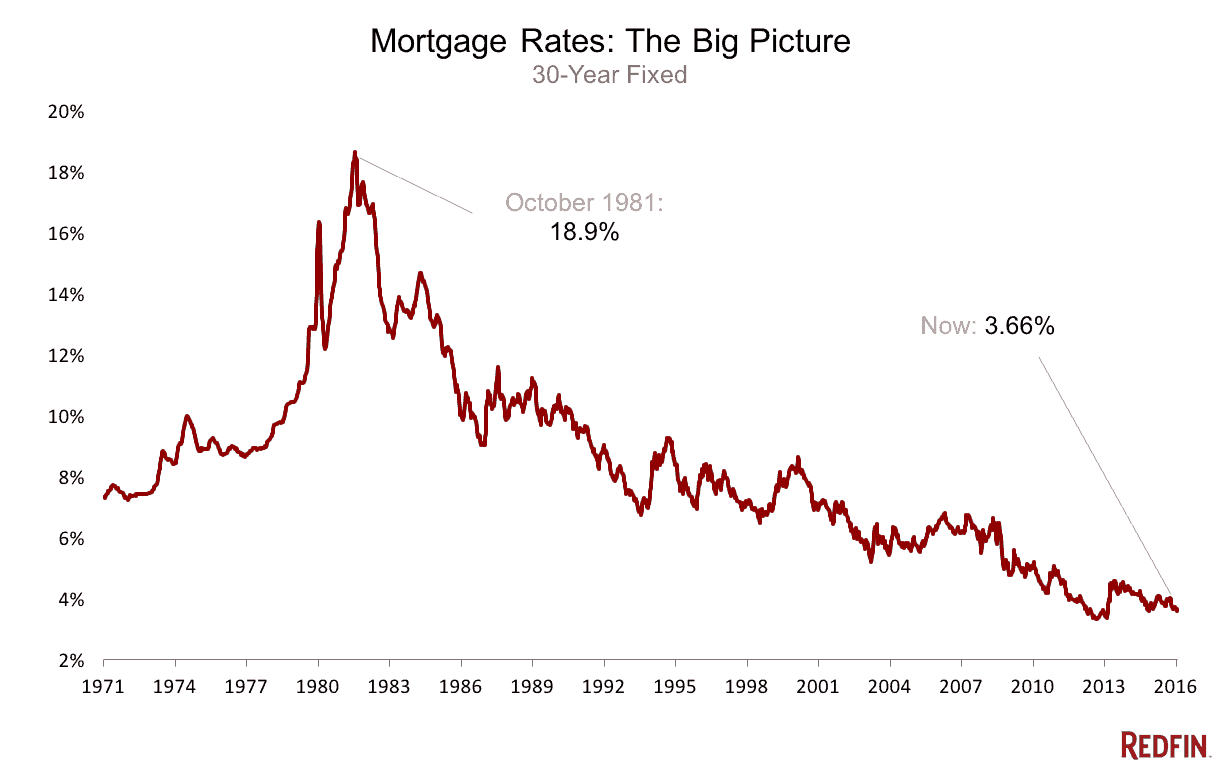
For homebuyers and sellers, the housing recovery is chugging along and the increase in mortgage rates might be short lived. Today, yields on the 10-year Treasury dipped, a sign mortgage rates probably will fall. Even if they don’t, remember this chart:
 United States
 Canada