Some expensive markets like San Jose, Seattle, and Boston are still seeing big gains in for-sale home inventory, while affordable markets like Oklahoma City, Buffalo, and Memphis are already experiencing big declines.
The number of homes for sale nationally fell 0.3 percent year over year in late June—the first annual decline since inventory started climbing in September. This marks the end of a brief respite for buyers in this years-old seller’s market. If supply growth continues falling at the rate it has been since April, by September the number of homes for sale will be down from a year earlier by more than 4 percent.
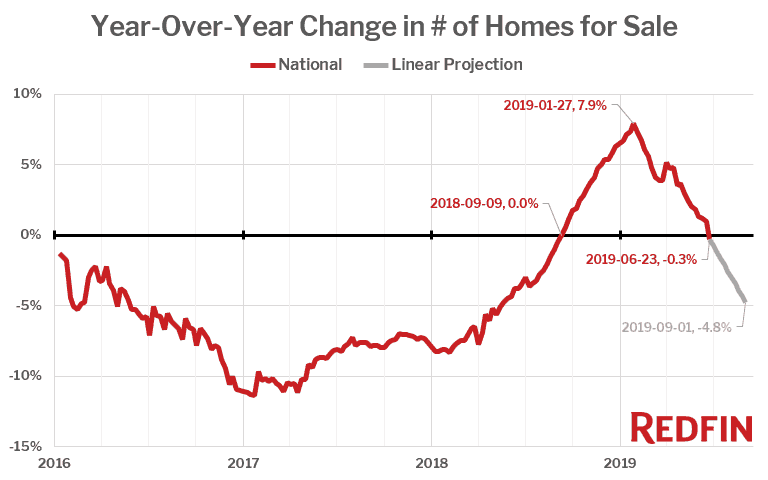
This is according to data on the number of homes for sale as of June 23 across 46 major markets Redfin tracks.
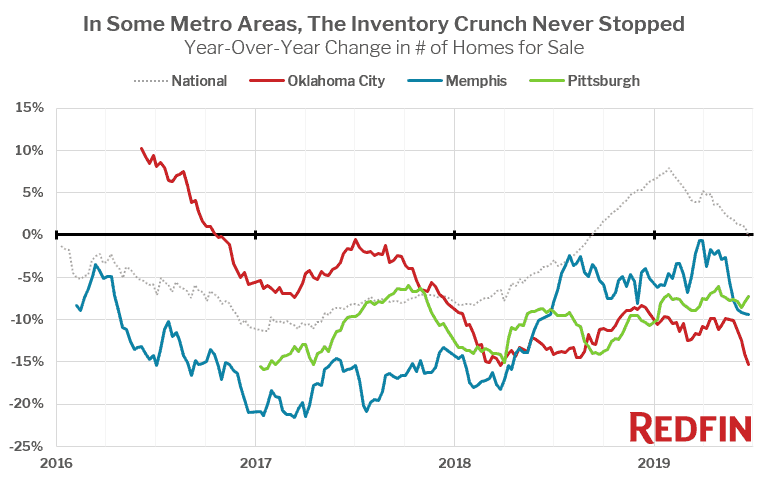
However, the national numbers mask a huge amount of regional variation under the surface. As of late June, 32 of the 46 largest U.S. metro areas had fewer homes for sale compared to a year earlier. In fact, in some of the country’s most affordable housing markets, the inventory crunch never subsided. For example, Oklahoma City, where the median price of homes sold in May was just $184,900, had 15.3 percent fewer homes for sale in late June compared to a year earlier and has not seen year-over-year growth since going negative in late 2016. Other affordable metro areas like Memphis and Pittsburgh have similar stories.
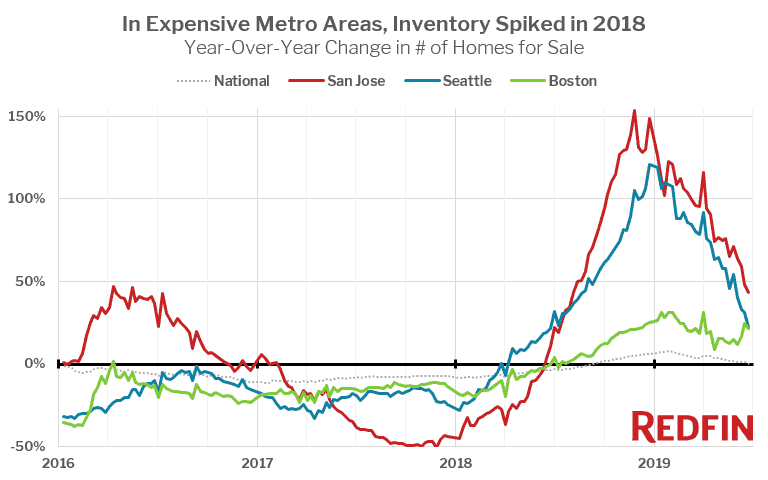
Most of the big gains in the national count of homes for sale over the past year have been driven by expensive metro areas with median prices well above the national median. San Jose (up 43.6%, median price $1,175,000), Seattle (up 21.9%, median price $592,500), and Boston (up 21.3%, median price $517,000) were the three metro areas that gained the most homes for sale compared to a year earlier. However, even in those markets, the rate of growth has fallen off dramatically from where it was in late 2018, contributing to the decline in the national rate of inventory growth.
With mortgage interest rates having dropped back to below 4 percent, demand is picking back up, which is likely to lead to renewed inventory shortages later this year, even in the more expensive markets.
“Lower interest rates are bringing buyers back, but without enough homes for sale to meet demand, we expect to see more bidding wars, which will push prices up this summer,” said Redfin chief economist Daryl Fairweather. “We expect small, inland markets where a typical home is still affordable for a middle-class family to heat up the most. Those markets, like Knoxville and Akron, are already experiencing double-digit annual price growth, and there is a lot of room for prices to continue to grow. Expensive metros like San Jose and Seattle may see moderate price growth this summer, but for the most part those markets have already peaked.”
In San Francisco, where a recent series of high-value tech IPOs has already led to a surge in bidding wars, the number of homes for sale was still up 12.0 percent from a year ago—far less than San Jose or Seattle. Supply growth is down from a high of over 60 percent in late December, indicating that San Francisco is transitioning from a sharp cooldown back to a hot market.
Change in Homes For Sale as of June 23, 2019, by Metro Area
| Metro Area | Year-Over-Year Change in # of Homes for Sale as of June 23, 2019 | Median Home Price (May 2019) |
|---|---|---|
| San Jose, CA | 43.6% | $1,175,000 |
| Seattle, WA | 21.9% | $592,500 |
| Boston, MA | 21.3% | $517,000 |
| Denver, CO | 20.9% | $425,000 |
| Las Vegas, NV | 19.0% | $285,000 |
| Portland, OR | 15.3% | $410,750 |
| Chicago, IL | 13.3% | $259,900 |
| San Francisco, CA | 12.0% | $1,500,000 |
| Nashville, TN | 11.2% | $300,000 |
| Detroit, MI | 7.6% | $144,000 |
| Dallas, TX | 7.0% | $309,000 |
| Houston, TX | 4.2% | $249,990 |
| Los Angeles, CA | 3.9% | $625,000 |
| Baltimore, MD | 3.0% | $294,250 |
| Miami, FL | 0.7% | $310,000 |
| National | -0.3% | $315,700 |
| Milwaukee, WI | -0.3% | $234,000 |
| San Antonio, TX | -0.5% | $237,000 |
| Columbus, OH | -0.6% | $229,818 |
| Louisville, KY | -0.6% | $202,870 |
| Sacramento, CA | -1.2% | $415,000 |
| Charlotte, NC | -1.6% | $265,000 |
| Minneapolis, MN | -2.1% | $285,000 |
| San Diego, CA | -2.5% | $585,000 |
| Washington, D.C. | -2.7% | $422,000 |
| Jacksonville, FL | -2.7% | $232,000 |
| Orlando, FL | -3.8% | $257,000 |
| Tampa, FL | -4.4% | $235,000 |
| Philadelphia, PA | -4.5% | $225,000 |
| Phoenix, AZ | -5.1% | $280,000 |
| Providence, RI | -5.6% | $294,500 |
| New York, NY | -6.2% | $385,000 |
| Raleigh, NC | -6.9% | $295,900 |
| Pittsburgh, PA | -7.3% | $177,500 |
| Hartford, CT | -7.5% | $228,000 |
| Cleveland, OH | -7.7% | $160,850 |
| Indianapolis, IN | -8.1% | $193,000 |
| Atlanta, GA | -8.1% | $256,000 |
| Austin, TX | -8.2% | $329,417 |
| Riverside, CA | -8.3% | $375,000 |
| Cincinnati, OH | -8.6% | $194,900 |
| Birmingham, AL | -9.1% | $230,000 |
| Memphis, TN | -9.4% | $197,000 |
| Richmond, VA | -10.3% | $260,000 |
| Buffalo, NY | -11.8% | $155,000 |
| Virginia Beach, VA | -13.7% | $245,000 |
| Oklahoma City, OK | -15.3% | $184,900 |
 United States
 Canada