-
The two Sun Belt states—which have gained more residents than any other state during the pandemic—are getting hit hardest by FEMA’s price hikes. By comparison, 81% of FEMA policyholders overall are seeing costs increase as a result of the agency’s insurance overhaul.
-
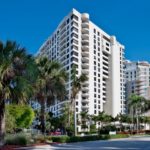
Texas and Florida face substantial flood risk, and have in the past had relatively low flood-insurance premiums.
-
Neighborhoods with higher home prices are the most likely to face jumps in flood-insurance costs.
-
Majority-Hispanic neighborhoods are seeing the highest share of policyholders experience price hikes, followed by majority-white neighborhoods.
-
Most annual premium increases are capped at 18% by law, meaning many policyholders will likely face further price hikes in the future.
Nearly 3 million owners of single-family homes in the U.S. are seeing their flood-insurance premiums rise as a result of FEMA overhauling the way it measures risk, with the changes starting to take effect this month. Almost 90% of policyholders in Texas, Florida and Mississippi are experiencing increases—a higher portion than any other state and above the national average of 81%. In general, homeowners in high-priced, Hispanic or white neighborhoods across the U.S. are most likely to see price hikes, but the majority of policyholders in every racial and income group is seeing costs climb.
That’s according to a Redfin analysis of 3.4 million National Flood Insurance Program (NFIP) policyholders who owned single-family homes as of May 2020. This report does not include data on condos, townhomes, multifamily buildings or commercial buildings. Data on premium increases are estimates based on projections from FEMA.
The cost increases are hitting flood-prone Texas and Florida at a time when both states are seeing their populations swell due to pandemic-driven migration. Texas gained an estimated 310,288 residents from July 2020 to July 2021—more than any other state, according to the U.S. Census Bureau. Florida came in second place, with an estimated gain of 211,196. Texas and Florida—the two most populous states behind California—have soared in popularity as remote work and surging home prices have prompted Americans to seek out more affordable places.
The cost of flood insurance is jumping for many homeowners because FEMA revamped the methodology for its National Flood Insurance Program to better reflect actual flood risk. The NFIP is the main source of flood insurance for residential properties in America. The new methodology—“Risk Rating 2.0”— calculates premiums based on an individual property’s features (i.e., foundation type, elevation, replacement cost, distance from water) rather than flood zone, and phases out subsidies that made flood insurance relatively affordable for some in the past.
The premium increases started going into effect for existing policyholders on April 1, 2022, upon policy renewal. New policyholders have been subject to the overhauled pricing methodology since Oct. 1, 2021. Policyholders experiencing premium decreases also began seeing changes take effect in October 2021.
National Summary: Quantifying the Impact of FEMA’s Flood-Insurance Overhaul
The table below includes people who as of May 2020 owned a single-family home and had an NFIP policy.
| Number of NFIP policyholders | 3.4 million |
| Number of NFIP policyholders set to see premium increases starting April 1, 2022 | 2.7 million |
| Number of NFIP policyholders set to see premium decreases starting Oct. 1, 2021 | 627,000 |
| Share of NFIP policyholders set to see premium increases starting April 1, 2022 | 81% |
| Share of NFIP policyholders set to see premium decreases starting Oct. 1, 2021 | 19% |
| Average annual NFIP premium as of May 2020 | $645 |
| Dollar amount by which most NFIP policyholders are set to see premiums increase in year one | $0-$120 |
Over three-quarters (81%) of single-family home policyholders are set to see their flood-insurance premiums rise, starting April 1. The remaining 19% are seeing decreases. Of the policyholders experiencing increases, most (88%) are seeing annual premiums rise by up to $120, while 9% are facing increases of $120 to $240 and 4% are seeing jumps of $240 or more.
While these jumps may seem small, that’s partly because most increases are capped at 18% per year by law. Many policyholders will see their premiums rise further in the coming years, until their “full risk rate” is reached. That means some will face annual premium increases for the next decade. FEMA estimates that 50% of policies will be at their full risk rate after five years, and 90% will be after 10 years.
“Most policyholders probably won’t feel the burn of FEMA’s price hikes in year one, but by year five or 10, the elevated cost of flood insurance could impact where Americans decide to buy and build homes,” said Redfin Senior Economist Sheharyar Bokhari. “Some people may choose not to renew their flood insurance policies despite increasing flood risk due to climate change, especially as inflation drives prices up elsewhere in the economy as well. Others may just move to less risky places where flood insurance isn’t required.”
Despite increasing flood risk, FEMA insures fewer people than it did in past years. The agency had roughly 3.4 million single-family-home policyholders in 2020, down from 3.8 million a decade earlier.
Texas, Florida Have Highest Share of Policyholders Facing Price Increases
There are six states where more than 81% (the national share) of policyholders are seeing increases—all of which face substantial flood risk. In Texas, 89% of policyholders are seeing premiums rise—a higher share than any other state. Next comes Florida (88%), Mississippi (87%), Alabama (85%), West Virginia (84%) and Louisiana (83%).
In four of those six states—Texas, Louisiana, Mississippi and Florida—homeowners have been paying less for flood-insurance than the typical U.S. policyholder ($645). The typical NFIP policyholder in Texas paid $504 as of May 2020—the lowest of any state. The average premiums in Louisiana, Mississippi and Florida were $564, $566 and $615, respectively—the sixth-, eighth- and eleventh-lowest in the country.
“Florida and Texas have historically had relatively low flood-insurance premiums on average because of the fact that the risk of flooding is well known, so homes there are built to a higher—literally—standard,” said Dr. Jeremy Porter, Chief Research Officer at climate-research group First Street Foundation. “The old NFIP methodology also offered highly subsidized rates for homes with coverage of over $60,000, which meant that relatively expensive coastal areas—like parts of Florida and Texas—ended up paying about the same rate as inland areas with much lower property values.”
All of the states listed above are expected to grapple with increased flood risk in the coming years. As of 2020, 1 in 4 properties in West Virginia and 1 in 5 properties in Louisiana and Florida faced substantial flood risk—more than any other states, according to First Street Foundation. In Texas and Alabama, about 1 in 10 properties faced substantial risk—roughly in line with the national average. That said, Texas is home to some of the most flood-endangered cities in the nation. Houston has 75,000 properties with substantial risk, the fourth-most in the country.
There are only five places in which more policyholders are seeing a decrease rather than an increase. In Washington, D.C., just 12% are experiencing an increase—a lower share than any other state. It’s followed by Alaska (13%), Maryland (40%), Puerto Rico (43%) and Michigan (47%).
”Flooding isn’t top of mind for a lot of house hunters in Florida, despite it being a serious risk. That’s because they’re often weighing other factors like affordability.” said Eric Auciello, a Redfin team manager in Tampa. “During the pandemic, many folks moved to Florida from expensive coastal cities like New York because they could work remotely and find more affordable homes. The desire to live in a less expensive place outweighed the fear of flooding. It will be interesting to see whether that changes now that the pandemic is winding down and a lot of people are no longer working from home.”
Auciello continued: “The good news is that at least for now, Florida homes are generally more resilient to natural disasters than homes in other cities, as they’re often built up on concrete foundations.”
Scroll down to the bottom of this report for a table with data on every U.S. state.
Hispanic Neighborhoods Most Likely to See Premiums Rise
Majority-Hispanic neighborhoods are more likely to see their flood-insurance premiums rise than any other major ethnic or racial neighborhood group, with 84% of policyholders facing increases. That’s likely because Texas and Florida—the states hit hardest by FEMA’s overhaul—have the largest Hispanic populations behind California.
| Majority ethnicity of neighborhood | Share of policyholders set to see premium increases starting April 1, 2022 | Average NFIP premium (May 2020) |
| Hispanic | 84% | $497 |
| Majority race of neighborhood | Share of policyholders set to see premium increases starting April 1, 2022 | Average NFIP premium (May 2020) |
| White, not Hispanic | 81% | $664 |
| No Major Race | 81% | $588 |
| Asian | 80% | $1,090 |
| Black | 78% | $587 |
| Native Hawaiian and Other Pacific Islander | 69% | $1,894 |
| American Indian and Alaskan Native | 67% | $638 |
Neighborhoods that are majority American Indian and Alaskan Native are the least likely to see premiums climb, with 67% of policyholders facing increases. Next comes neighborhoods that are majority Native Hawaiian and Other Pacific Islander, at 69%.
All other groups were roughly in line with the national average, with about 80% of policyholders facing increases.
Studies have shown that neighborhoods of color are often more vulnerable to climate change to begin with. There are $107 billion worth of homes at high risk of flooding in formerly redlined U.S. areas, compared with $85 billion in non-redlined areas, a 2021 Redfin analysis found. Today, a majority of households in neighborhoods once designated undesirable for mortgage lending under redlining are nonwhite.
Neighborhoods With Higher Home Prices Most Likely to Experience Premium Increases
In general, areas with higher home prices are seeing a larger share of policyholders face premium increases. In neighborhoods with median home prices of $300,000 or more in 2021, 83% of policyholders are seeing premiums jump. That compares with 76% of policyholders in neighborhoods with median sale prices between $100,000 and $199,999, and 68% in neighborhoods with median sale prices below $100,000.
| Median home price of neighborhood (2021) | Share of policyholders set to see premium increases starting April 1, 2022 | Average NFIP premium (May 2020) |
| Less than $100,000 | 68% | $689 |
| $100,000 to $199,999 | 76% | $633 |
| $200,000 to $299,999 | 81% | $591 |
| $300,000 to $499,999 | 83% | $589 |
| $500,000 to $749,999 | 83% | $670 |
| $750,000 to $999,999 | 83% | $842 |
| $1,000,000 to $1,999,999 | 83% | $941 |
| $2,000,000 or more | 83% | $1,086 |
When FEMA announced its new methodology, it said one of its goals was to “equitably distribute premiums across all policyholders based on the value of their home and the unique flood risk of their property.” The agency said that many policyholders with lower-value homes have been paying more than they should and policyholders with higher-value homes have been paying less than they should.
Interestingly, though, places with the highest earners are seeing a relatively small share of policyholders face price hikes. In neighborhoods where the median household income is $200,000 or more, 76% of policyholders are seeing premiums rise—below the national average. That’s roughly the same share as neighborhoods where the median income is under $20,000.
| Median household income of neighborhood | Share of policyholders set to see premium increases starting April 1, 2022 | Average NFIP premium (May 2020) |
| Less than $20,000 | 74% | $559 |
| $20,000 to $39,999 | 68% | $646 |
| $40,000 to $59,999 | 79% | $631 |
| $60,000 to $79,999 | 81% | $627 |
| $80,000 to $99,999 | 82% | $645 |
| $100,000 to $124,999 | 82% | $637 |
| $125,000 to $149,999 | 86% | $685 |
| $150,000 to $199,000 | 81% | $713 |
| $200,000 or more | 76% | $877 |
State-By-State Breakdown
The table below estimates the number and share of NFIP policyholders (single-family homeowners only) in each state who are seeing premiums increase and decrease. The states with the highest shares of policyholders experiencing increases are at the top.
| U.S. state or territory | Share of policyholders set to see premium increases starting April 1, 2022 | Share of policyholders set to see premium decreases starting Oct. 1, 2021 | Number of policyholders set to see premium increases starting April 1, 2022 | Number of policyholders set to see premium decreases starting Oct. 1, 2021 | Average NFIP premium (May 2020) |
| Texas | 89% | 11% | 589,620 | 72,838 | $504 |
| Florida | 88% | 12% | 806,722 | 114,617 | $615 |
| Mississippi | 87% | 13% | 43,046 | 6,595 | $566 |
| Alabama | 85% | 15% | 25,682 | 4,604 | $660 |
| West Virginia | 84% | 16% | 8,405 | 1,631 | $769 |
| Louisiana | 83% | 17% | 336,321 | 67,657 | $564 |
| Arizona | 81% | 19% | 18,535 | 4,269 | $576 |
| Hawaii | 81% | 19% | 9,296 | 2,162 | $1,250 |
| Nevada | 81% | 19% | 6,625 | 1,578 | $516 |
| Georgia | 80% | 20% | 54,055 | 13,212 | $566 |
| North Carolina | 80% | 20% | 87,115 | 21,442 | $600 |
| South Carolina | 80% | 20% | 112,648 | 27,729 | $642 |
| New Jersey | 79% | 21% | 91,354 | 24,221 | $925 |
| California | 79% | 21% | 130,763 | 35,066 | $677 |
| Minnesota | 75% | 25% | 6,393 | 2,170 | $668 |
| Idaho | 75% | 25% | 3,226 | 1,099 | $638 |
| Tennessee | 74% | 26% | 15,360 | 5,313 | $652 |
| Oregon | 74% | 26% | 13,198 | 4,599 | $735 |
| New Hampshire | 73% | 27% | 3,028 | 1,094 | $965 |
| Oklahoma | 73% | 27% | 7,617 | 2,819 | $680 |
| Delaware | 72% | 28% | 11,683 | 4,464 | $702 |
| Kentucky | 72% | 28% | 10,537 | 4,059 | $794 |
| New York | 72% | 28% | 82,974 | 32,255 | $1,019 |
| Pennsylvania | 72% | 28% | 25,973 | 10,263 | $845 |
| Missouri | 71% | 29% | 9,467 | 3,920 | $729 |
| South Dakota | 70% | 30% | 2,122 | 888 | $728 |
| Connecticut | 70% | 30% | 14,900 | 6,365 | $1,372 |
| Washington | 70% | 30% | 16,959 | 7,260 | $758 |
| Arkansas | 70% | 30% | 7,478 | 3,248 | $671 |
| Wyoming | 70% | 30% | 948 | 413 | $780 |
| Vermont | 68% | 32% | 1,443 | 678 | $968 |
| Maine | 67% | 33% | 3,683 | 1,824 | $839 |
| Iowa | 66% | 34% | 5,689 | 2,987 | $712 |
| New Mexico | 65% | 35% | 6,210 | 3,352 | $751 |
| Massachusetts | 64% | 36% | 20,984 | 11,707 | $1,200 |
| Kansas | 64% | 36% | 4,627 | 2,631 | $679 |
| Montana | 63% | 37% | 2,232 | 1,287 | $723 |
| Colorado | 63% | 37% | 7,829 | 4,588 | $718 |
| North Dakota | 62% | 38% | 7,054 | 4,347 | $547 |
| Rhode Island | 61% | 39% | 5,028 | 3,274 | $1,188 |
| Illinois | 60% | 40% | 16,170 | 10,562 | $962 |
| Virginia | 60% | 40% | 48,416 | 32,912 | $653 |
| Wisconsin | 56% | 44% | 5,634 | 4,342 | $793 |
| Indiana | 55% | 45% | 9,046 | 7,303 | $843 |
| Ohio | 55% | 45% | 12,172 | 9,829 | $825 |
| Utah | 54% | 46% | 1,430 | 1,225 | $559 |
| Nebraska | 53% | 47% | 3,670 | 3,207 | $800 |
| Michigan | 47% | 53% | 7,775 | 8,838 | $859 |
| Puerto Rico | 43% | 57% | 913 | 1,198 | $690 |
| Maryland | 40% | 60% | 13,136 | 19,699 | $661 |
| Alaska | 13% | 87% | 220 | 1,465 | $683 |
| Washington, D.C. | 12% | 88% | 148 | 1,080 | $517 |
| National | 81% | 19% | 2,735,666 | 626,798 | $645 |
Methodology
Data on how flood-insurance premiums are estimated to change under Risk Rating 2.0 comes from FEMA based on NFIP policyholder information from May 2020. FEMA shares this data on a zip-code level, which Redfin aggregated to calculate state-level statistics. This report focuses only on policies for single-family homes.
For the race and income sections, Redfin matched FEMA’s data with zip-code data on owner-occupied households by race and median household income from the U.S. Census Bureau’s 2016-2020 American Community Survey. We also matched FEMA’s data with Redfin MLS data on zip-code level home prices in 2021 to classify neighborhoods by price point. Please note that in states where there are zip codes with fewer than five policyholders, FEMA groups these zip codes together. That means that while we were able to include those zip codes in the state totals, we were unable to include them in the race, income and prices sections, as those sections include data on the zip-code level. Census data shows that about 90% of these zip codes are majority white.
Data on the average dollar value of FEMA flood-insurance policies comes from the agency’s OpenFEMA redacted policies dataset. We used May 2020 as the time period for this data to keep it consistent with the zip-code data on premium changes. We excluded less than 1% of policies with negative premiums (refunds) or very large premiums (over $10,000) when calculating the average.