
Over one-third of home purchases in February were made in all cash—not far from the record high.
The median down payment for U.S. homebuyers was $55,640 in February. That’s up 24.1% from $44,850 a year earlier—the largest annual increase in percentage terms since April 2022.
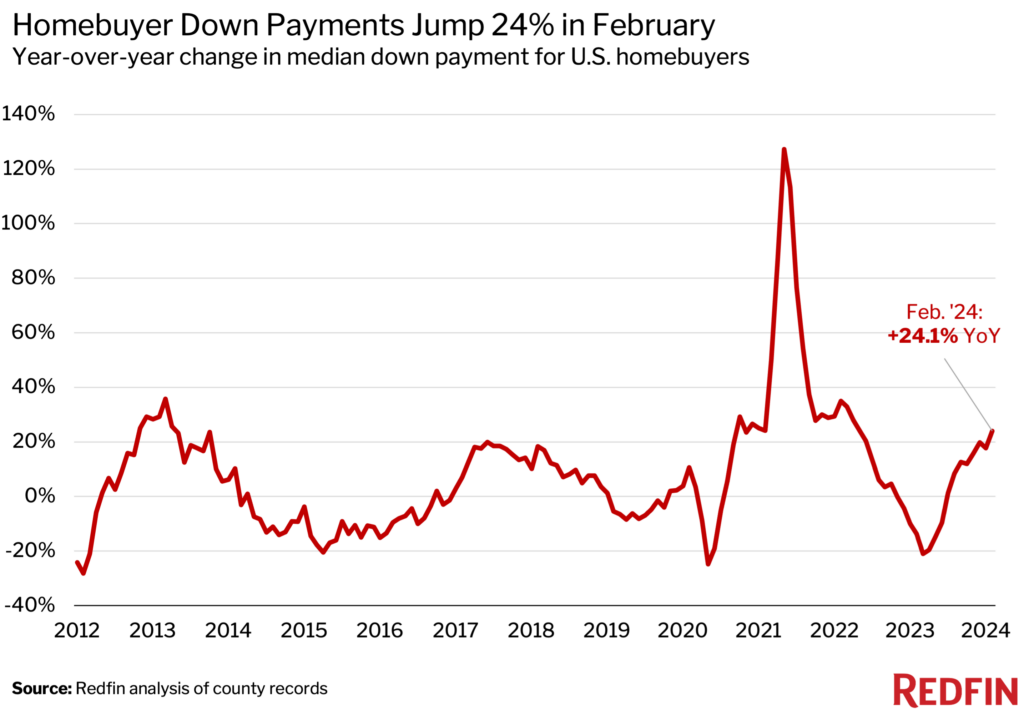
The typical homebuyer’s down payment last month was equal to 15% of the purchase price, up from 10% a year earlier.
This is based on a Redfin analysis of county records across 40 of the most populous U.S. metropolitan areas going back through 2011. The national numbers in this report are based on those 40 metros. Scroll to the bottom for metro-level data.
“Homebuyers are doing whatever they can to pull together a large down payment in order to lower their monthly payments moving forward,” said Rachel Riva, a Redfin real estate agent in Miami. “The smallest down payment I’ve seen recently is 25%. I had one client who put down 40%.”
Home prices rose 6.6% year over year in February, which is part of the reason down payments increased; a higher home price naturally leads to a higher down payment because the down payment is a percentage of the home price. But elevated housing costs (from both high prices and high mortgage rates) are also incentivizing buyers to take out larger down payments.
A bigger down payment means a smaller total loan amount, and a smaller loan amount means smaller monthly interest payments. For example, a buyer who purchases today’s median-priced U.S. home ($374,500) and puts 15% down would have a monthly payment of $2,836 at the current 6.79% mortgage rate. A buyer who puts 10% down on that same home with that same rate would have a monthly payment of $2,968. That’s $132 more per month, which adds up over the course of a mortgage. Mortgage rates are down from their October peak of roughly 8%, but are still more than double the all-time low hit during the pandemic.
Down payment amounts may also be rising because many of the people buying homes today are sitting on a lot of equity from the sale of their previous home, thanks to a surge in housing values during the pandemic. Some of those people may not have the income to qualify for a large loan, but the equity they’ve built allows them to make a bigger down payment so that they can purchase the house they want with the smaller loan that they do qualify for.
While the typical homebuyer makes a 15% down payment, those who can afford to put even more down stand to save money, and not just from smaller monthly interest payments. Buyers who put at least 20% down aren’t required to buy private mortgage insurance—an added cost that’s helpful to avoid at a time when housing affordability is already so strained.
Over 1 in 3 Home Purchases Are Made With Cash—a Near Record Share
Over one-third (34.5%) of U.S. home purchases in February were made with all cash, up from 33.4% a year earlier. That’s just shy of the 34.8% decade-high hit in November, and isn’t far below the record high of 38% hit in 2013.
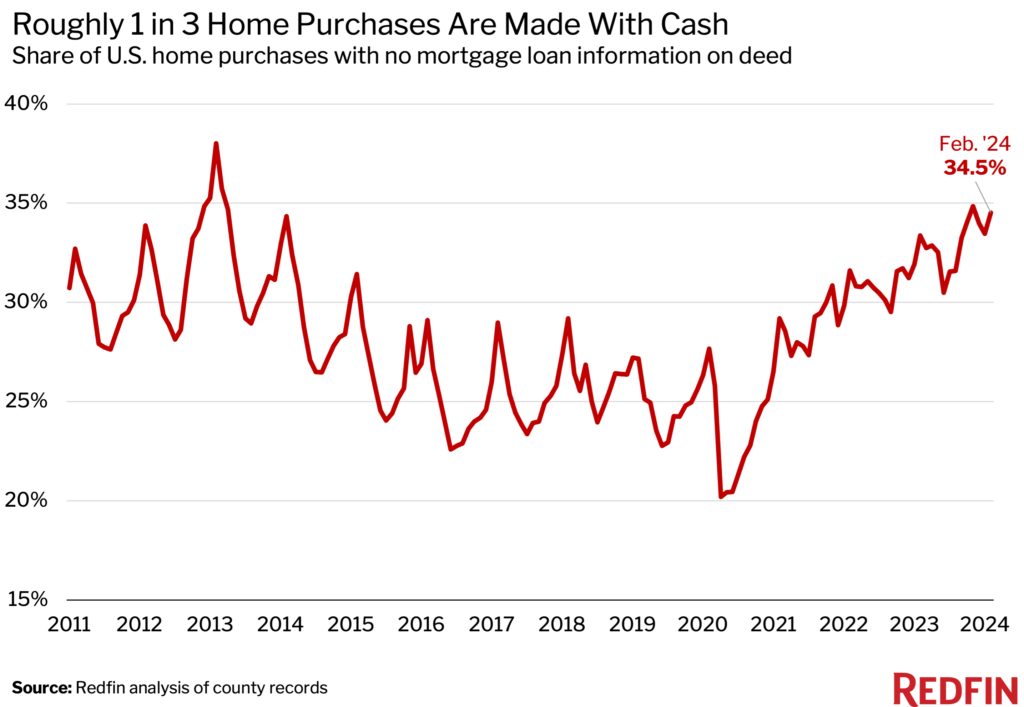
We define an all-cash purchase as a home purchase with no mortgage loan information on the deed.
Some homebuyers are paying in cash for the same reason others are taking out large down payments: elevated mortgage interest rates. A large down payment helps ease the sting of high rates by reducing monthly interest payments, whereas an all-cash purchase removes the sting altogether because it means a buyer isn’t paying interest at all.
Most buyers, though, can’t afford to pay in cash, and many can’t afford a big down payment either. First-time buyers, especially, are at a disadvantage in today’s market. That’s because they don’t have equity from the sale of a previous home to bolster their down payments, and are often competing against all-cash offers, which sellers tend to favor. Many all-cash offers come from investors, who were buying up more than one-quarter of the country’s most affordable homes as of the end of last year. Overall, though, investors are purchasing far fewer homes than they were during the pandemic housing boom.
“High mortgage rates are widening the wealth gap between people of different races, generations and income levels,” said Redfin Economics Research Lead Chen Zhao. “They’ve added fuel to the fire lit by surging home prices during the pandemic, creating a reality where in many places, wealthy Americans are the only ones who can afford to buy homes. Meanwhile, people who are priced out of homeownership are missing out on a major wealth building opportunity, which could have financial implications for their children and even their children’s children.”
Another reason all-cash purchases have taken up a growing piece of the homebuying pie: When housing is expensive, affluent Americans who can afford to pay in cash are more likely than lower-income Americans to be the ones buying. All-cash home sales rose 2.9% year over year in February, while mortgaged home sales fell 2.9%.
One glimmer of hope for house hunters: Mortgage rates are expected to fall before the end of the year, which should make homebuying a bit more affordable.
FHA Loans More Popular Than They Were During Pandemic Because the Market Is Less Competitive
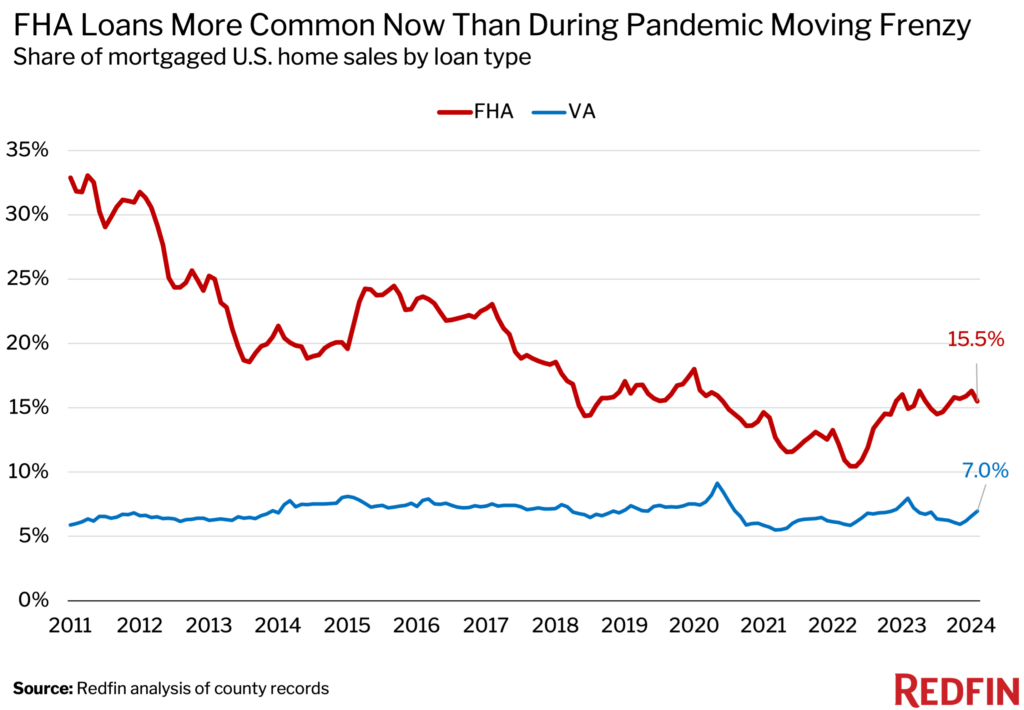
Roughly one in six (15.5%) mortgaged U.S. home sales used an FHA loan in February, up from 14.9% a year earlier and just shy of the 16.3% four-year high hit a month earlier. FHA loans are more common than they were during the pandemic homebuying boom (they represented 12.1% of mortgaged sales in February 2022) because the market today is less competitive. Back then, sellers frequently received multiple offers and chose one with a high down payment because they believed those offers were less likely to fall through. But today’s sellers are receiving fewer offers, which means they can’t be as picky.
FHA and VA loans are both insured by the U.S. government. FHA loans, meant for low- to moderate-income borrowers and popular with first-time homebuyers, have lower down-payment and credit-score requirements than conventional loans.
Roughly one in 14 (7%) mortgaged home sales used a VA loan in February, down from 8% a year earlier. The share of home sales using a VA loan typically doesn’t change much over time, though it fluctuated more than usual during the topsy-turvy pandemic market. It was common for about 7% of mortgaged home sales to use a VA loan before the pandemic. The share rose to 9.1% in spring 2020 when the market suddenly cooled, allowing buyers with lower down payments to make their move, and dropped to 5.5% in spring 2021 as the market burned hot.
VA loans are available to veterans, service members and their surviving spouses and require little to no down payment.
Conventional loans are the most common type, representing over three-quarters (77.5%) of mortgaged home sales in February, up slightly from 77.1% a year earlier. Jumbo loans—used for higher loan amounts and popular among luxury buyers—represented 5.3% of mortgaged sales, compared with 4.7% a year earlier.
Metro-Level Highlights: February 2024
Data below came from a list of the 40 most populous U.S. metro areas.
Metros with biggest increases/decreases in down payment amounts
In Las Vegas, the median down payment jumped 60.9% year over year—the largest increase among the metros Redfin analyzed. Next came San Diego (49.8%), Charlotte, NC (47.4%), Virginia Beach, VA (45%) and Newark, NJ (32.2%). Down payments only fell in two metros: Milwaukee (-13.9%) and Pittsburgh (-0.4%).
Metros with highest/lowest down payment percentages
In San Francisco, the median down payment was equal to 25% of the purchase price—the highest among the metros Redfin analyzed. It was followed by San Jose, CA (24.9%) and Anaheim, CA (21.9%). The following metros all had median down payments of 20%: Fort Lauderdale, FL, Los Angeles, Miami, Montgomery County, PA, New Brunswick, NJ, New York, Oakland, CA, Sacramento, CA, San Diego, Seattle and West Palm Beach, FL.
Down payment percentages were lowest in Virginia Beach (1.8%), Detroit (5%), Pittsburgh (5%), Baltimore (5%) and Philadelphia (7.3%).
While the Bay Area has among the most expensive home prices, it also has a high concentration of wealthy residents, many of whom can afford large down payments. Meanwhile, Virginia Beach is at the bottom of the list because it has a high concentration of veterans, many of whom take out VA loans, which require little to no down payment.
Metros where all-cash purchases are most/least common
In Jacksonville, FL, 54.4% of home purchases were made in cash—the highest share among the metros Redfin analyzed. Next came West Palm Beach (53.4%), Cleveland (48.8%), Fort Lauderdale (46.2%) and Atlanta (46.1%). These metros are popular among investors, who often pay in cash.
All-cash purchases were least common in San Jose (18%), Oakland (21.6%), San Diego (21.7%), Los Angeles (23%) and Providence, RI (23.3%).
Metros with biggest increases/decreases in share of all-cash purchases
In Atlanta, 46.1% of home purchases were made in cash, up 12.5 percentage points from a year earlier—the largest increase among the metros Redfin analyzed. It was followed by Jacksonville (8 ppts), Oakland (6.2 ppts), Portland, OR (5.7 ppts) and New Brunswick (5.2 ppts).
In Columbus, OH, 28.5% of home purchases were made in cash, down 6.1 percentage points from a year earlier—the largest decrease among the metros Redfin analyzed. Next came Cincinnati (-4.4 ppts), Philadelphia (-3.3 ppts), Chicago (-3.3 ppts) and Phoenix (-2.8 ppts).
Down Payments and All-Cash Purchases by Metro: February 2024
| U.S. metro area | Median down payment ($) | Median down payment ($), YoY change | Median down payment (%) | Median down payment (%), YoY change | Share of home purchases made with cash | Share of home purchases made with cash, YoY change |
|---|---|---|---|---|---|---|
| Anaheim, CA | $259,800 | 26.1% | 21.9% | 1.9 ppts | 33.4% | 2.9 ppts |
| Atlanta, GA | $31,807 | 27.2% | 10.0% | 4.0 ppts | 46.1% | 12.5 ppts |
| Baltimore, MD | $23,000 | 21.1% | 5.0% | 0.0 ppts | 43.1% | 3.5 ppts |
| Charlotte, NC | $42,000 | 47.4% | 10.0% | 0.0 ppts | 37.4% | 2.1 ppts |
| Chicago, IL | $30,000 | 19.2% | 10.0% | 0.0 ppts | 27.0% | -3.3 ppts |
| Cincinnati, OH | $24,750 | 21.1% | 10.0% | 2.1 ppts | 40.5% | -4.4 ppts |
| Cleveland, OH | $18,000 | 26.8% | 10.0% | 3.4 ppts | 48.8% | -2.1 ppts |
| Columbus, OH | $27,000 | 31.7% | 8.9% | 1.8 ppts | 28.5% | -6.1 ppts |
| Denver, CO | $70,000 | 7.1% | 12.7% | -1.6 ppts | 27.7% | -0.8 ppts |
| Detroit, MI | $10,611 | 10.4% | 5.0% | 0.0 ppts | 40.9% | 3.0 ppts |
| Fort Lauderdale, FL | $60,000 | 11.4% | 20.0% | 0.0 ppts | 46.2% | 2.1 ppts |
| Jacksonville, FL | $31,500 | 29.4% | 10.0% | 3.0 ppts | 54.4% | 8.0 ppts |
| Las Vegas, NV | $35,000 | 60.9% | 10.0% | 5.0 ppts | 34.4% | 1.9 ppts |
| Los Angeles, CA | $173,000 | 22.3% | 20.0% | 0.0 ppts | 23.0% | -0.1 ppts |
| Miami, FL | $77,220 | 12.7% | 20.0% | 0.0 ppts | 44.0% | 1.0 ppts |
| Milwaukee, WI | $23,250 | -13.9% | 10.0% | -0.3 ppts | 32.6% | -2.3 ppts |
| Minneapolis, MN | $33,898 | 16.0% | 10.0% | 0.0 ppts | 30.4% | 1.6 ppts |
| Montgomery County, PA | $77,875 | 25.9% | 20.0% | 2.4 ppts | 32.5% | -0.4 ppts |
| Nashville, TN | $47,025 | 18.3% | 10.0% | 0.0 ppts | 34.7% | -0.1 ppts |
| New Brunswick, NJ | $95,000 | 27.5% | 20.0% | 0.0 ppts | 39.1% | 5.2 ppts |
| New York, NY | $172,250 | 16.4% | 20.0% | 0.0 ppts | 33.2% | 1.1 ppts |
| Newark, NJ | $78,875 | 32.2% | 19.9% | 4.9 ppts | 25.8% | -0.3 ppts |
| Oakland, CA | $181,000 | 16.8% | 20.0% | 0.0 ppts | 21.6% | 6.2 ppts |
| Orlando, FL | $49,490 | 23.7% | 14.3% | 4.3 ppts | 40.1% | -0.1 ppts |
| Philadelphia, PA | $19,810 | 14.8% | 7.3% | 2.3 ppts | 38.6% | -3.3 ppts |
| Phoenix, AZ | $47,000 | 30.6% | 10.0% | 0.0 ppts | 30.8% | -2.8 ppts |
| Pittsburgh, PA | $13,950 | -0.4% | 5.0% | 0.0 ppts | 35.4% | -0.6 ppts |
| Portland, OR | $71,020 | 8.4% | 15.7% | 2.6 ppts | 31.0% | 5.7 ppts |
| Providence, RI | $40,000 | 12.9% | 10.0% | 0.0 ppts | 23.3% | -1.4 ppts |
| Riverside, CA | $40,000 | 15.2% | 8.4% | 1.1 ppts | 40.7% | -1.0 ppts |
| Sacramento, CA | $82,750 | 18.2% | 20.0% | 6.6 ppts | 26.2% | 4.4 ppts |
| San Diego, CA | $152,000 | 49.8% | 20.0% | 5.0 ppts | 21.7% | 2.6 ppts |
| San Francisco, CA | $383,500 | 9.6% | 25.0% | 0.0 ppts | 29.9% | -1.3 ppts |
| San Jose, CA | $365,000 | 25.9% | 24.9% | 4.8 ppts | 18.0% | -2.0 ppts |
| Seattle, WA | $165,400 | 31.3% | 20.0% | 0.0 ppts | 24.2% | 5.2 ppts |
| Tampa, FL | $39,702 | 10.1% | 10.0% | 0.0 ppts | 42.8% | 2.5 ppts |
| Virginia Beach, VA | $7,200 | 45.0% | 1.8% | 0.0 ppts | 24.0% | 0.9 ppts |
| Warren, MI | $25,875 | 19.6% | 10.0% | 0.0 ppts | 33.9% | 3.8 ppts |
| Washington, D.C. | $47,945 | 21.5% | 10.0% | 1.3 ppts | 23.7% | 1.3 ppts |
| West Palm Beach, FL | $80,000 | 13.6% | 20.0% | 0.0 ppts | 53.4% | -1.6 ppts |
| National | $55,640 | 24.1% | 15.0% | 5.0 ppts | 34.5% | 1.1 ppts |


