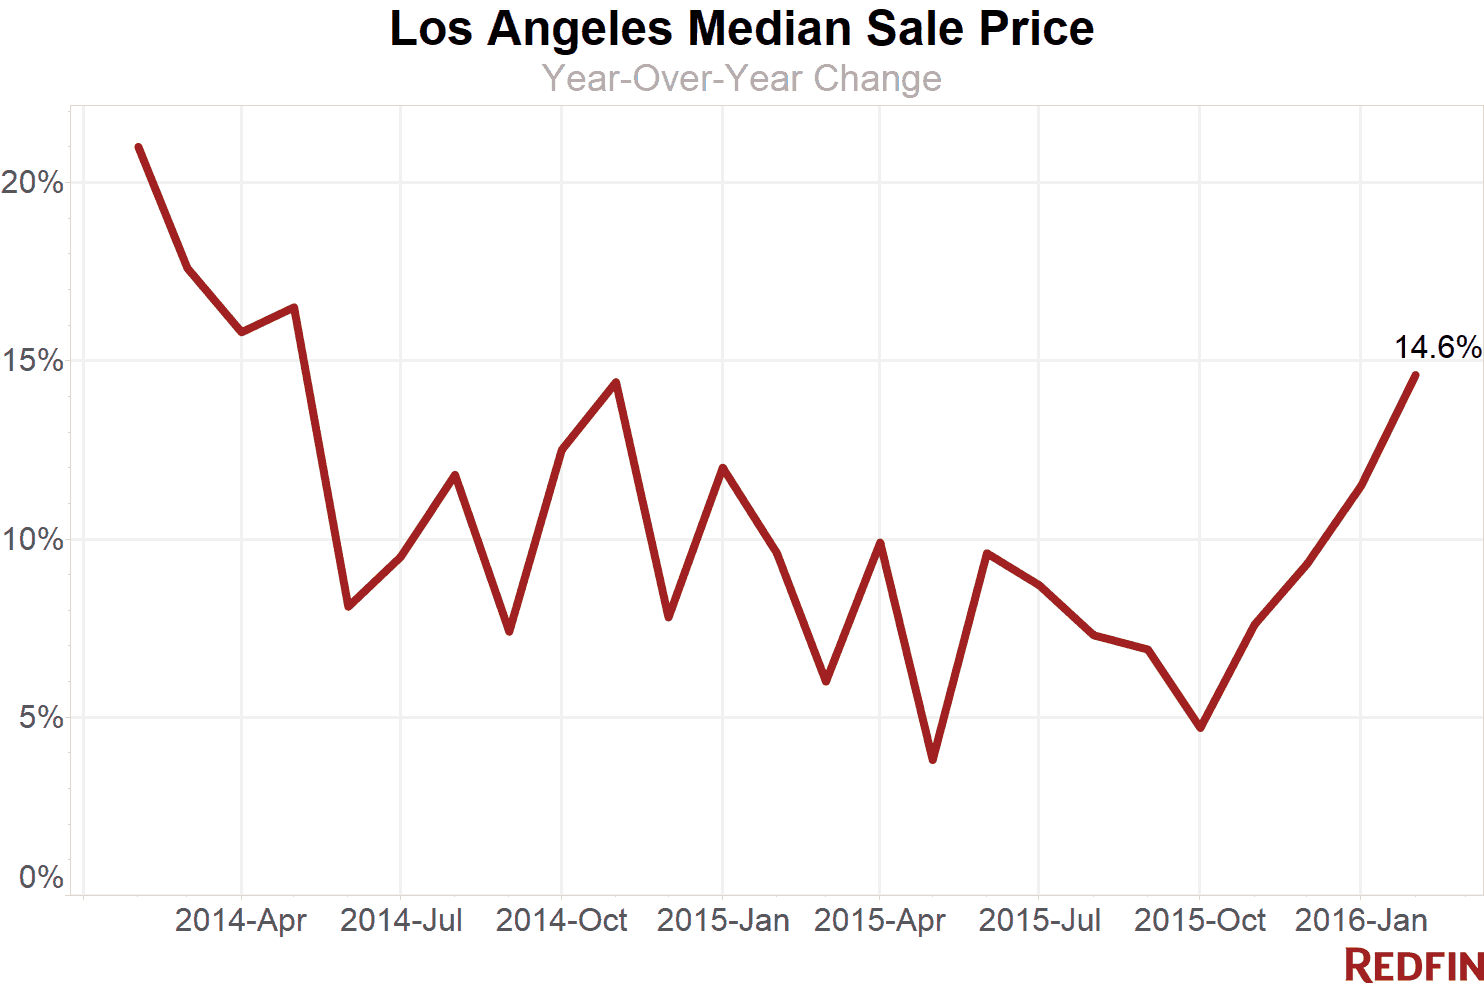
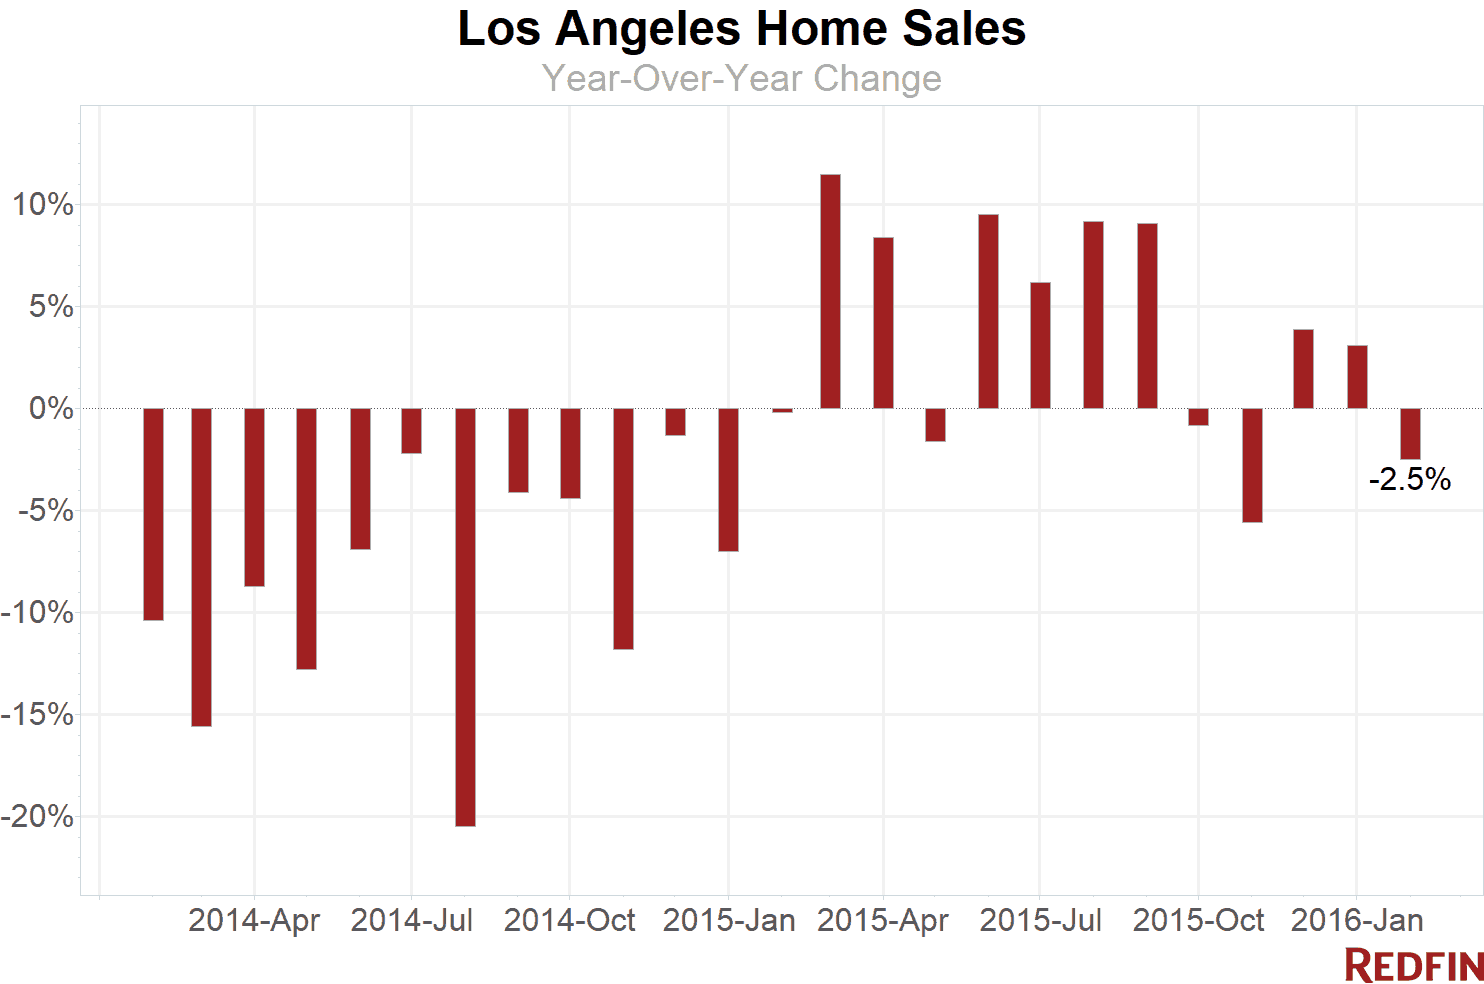
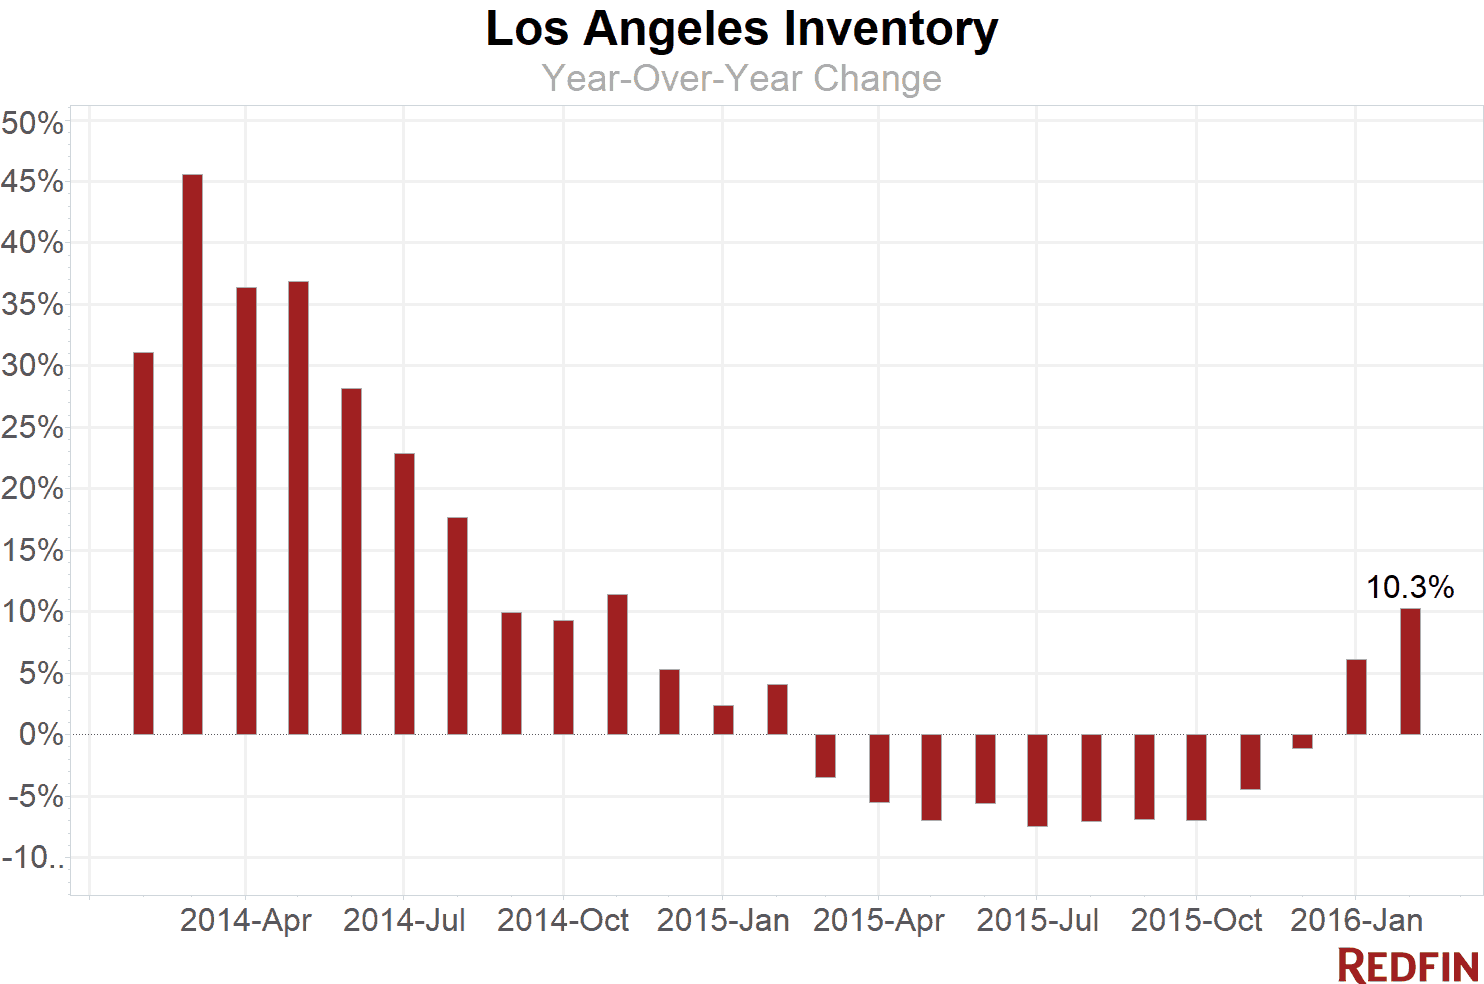
Los Angeles home prices continued their upward climb, gaining 14.6 percent in February from a year earlier, to a median sale price of $590,000. This marks the fourth-straight month of annual gains and is the strongest growth L.A. has seen since May of 2014. Home sales dipped slightly, declining 2.5 percent.

The number of homes for sale increased 10.3 percent from the same time last year, thanks to a healthy batch of new listings added to the market in February, a 9 percent boost from a year earlier.

“We are definitely feeling the bump in new listings on the Westside,” Redfin real estate agent Isabel Velez said. “I’m working with several sellers who have built up equity on their starter homes and are in a position to upgrade. Many of them want to make the move now because they are finally satisfied with how much they can sell their current home for.”
All else equal, this recent increase in supply would ease competition for homebuyers. Although they had more choices last month, even a double-digit increase in homes for sale wasn’t enough to cool competition for desirable houses in hot neighborhoods.

Area Trends and Hot Neighborhoods
Seller confidence on the Westside was evident in the spike in asking prices last month — up 25 percent from a year earlier to a median of nearly $1.5 million.
The Eastside remained the most competitive market in L.A. The median sale price for Eastside homes jumped 20 percent, surpassing $625,000. Nearly 50 percent of homes sold on the Eastside went for more than the asking price.
Mount Washington was still the neighborhood to watch. The median sale price there grew 19.2 percent to $790,000 and the average home sold for 6.5 percent above asking price, the highest sale-to-list ratio of all the neighborhoods we track. It was also one of the fastest markets in L.A., with the typical home selling in less than two weeks.
A robust investor market of flips — quick, for-profit sales — was one reason for the ballooning prices in Mount Washington. In 2015, the average flip in Mount Washington had a gain of $312,000, according to a recent Redfin report.
Here’s what’s happening in your neighborhood:
| Neighborhood | Median Sale Price | Year-Over-Year | Homes Sold | Year-Over-Year | Inventory | Year-Over-Year | New Listings | Median Days on Market | Avg Sale-to-List |
|---|---|---|---|---|---|---|---|---|---|
| Beverly Glen | $2,300,000 | 83.3% | 13 | 0.0% | 23 | -8.0% | 29 | 44 | 97.5% |
| Beverly Hills Post Office | $2,191,250 | 34.4% | 32 | -20.0% | 76 | -2.6% | 86 | 40 | 97.8% |
| Brentwood | $1,300,000 | -19.4% | 104 | 10.6% | 114 | 42.5% | 144 | 35 | 98.4% |
| Central LA | $870,000 | 10.3% | 715 | -3.8% | 823 | 8.4% | 1,176 | 34 | 98.4% |
| Century City | $1,050,500 | 23.6% | 75 | 2.7% | 74 | 12.1% | 113 | 39 | 99.2% |
| Chatsworth | $487,500 | -1.5% | 78 | -29.7% | 80 | 31.1% | 134 | 17 | 98.5% |
| Cheviot Hills | $1,541,416 | -4.9% | 18 | -14.3% | 15 | 114.3% | 29 | 15 | 97.8% |
| Crenshaw | $628,125 | 66.8% | 46 | 64.3% | 13 | -18.8% | 40 | 20 | 100.8% |
| Eagle Rock | $705,000 | 15.1% | 54 | 63.6% | 34 | -10.5% | 61 | 16 | 102.9% |
| East LA | $625,500 | 20.3% | 500 | 3.3% | 410 | 8.8% | 716 | 21 | 101.7% |
| Encino | $739,000 | 5.6% | 157 | 1.3% | 141 | -2.1% | 212 | 20 | 99.1% |
| Fox Hills | $415,000 | -0.4% | 21 | -25.0% | 4 | -66.7% | 12 | 21 | 99.8% |
| Glassell Park | $622,500 | 17.2% | 31 | 0.0% | 22 | -37.1% | 38 | 25 | 99.7% |
| Greater Echo Park Elysian | $870,000 | 15.2% | 59 | 47.5% | 52 | 23.8% | 86 | 34 | 101.5% |
| Hancock Park | $500,000 | -68.8% | 11 | -31.3% | 23 | 76.9% | 36 | 16 | 98.3% |
| Highland Park | $595,000 | 2.1% | 64 | -30.4% | 57 | 11.8% | 101 | 18 | 101.4% |
| Hollywood | $771,250 | 6.4% | 66 | 22.2% | 75 | 21.0% | 112 | 34 | 98.0% |
| Hollywood Hills West | $1,157,500 | 0.7% | 90 | 12.5% | 114 | -9.5% | 154 | 44 | 98.0% |
| Holmby Hills | $1,024,812 | -63.4% | 6 | -14.3% | 15 | 66.7% | 16 | 37 | 93.3% |
| Lake Balboa | $487,500 | 11.2% | 67 | -18.3% | 44 | -6.4% | 89 | 14 | 100.1% |
| Marina del Rey | $814,000 | 2.7% | 81 | 6.6% | 51 | -3.8% | 80 | 28 | 98.9% |
| Mid-City | $815,000 | 7.2% | 111 | -9.8% | 112 | -0.9% | 174 | 28 | 99.2% |
| Mount Washington | $790,000 | 19.2% | 22 | -15.4% | 21 | 110.0% | 33 | 13 | 106.5% |
| North Hollywood | $472,000 | 7.5% | 120 | -1.6% | 112 | 16.7% | 191 | 24 | 98.9% |
| Northwest San Pedro | $489,000 | 15.1% | 67 | 17.5% | 58 | 13.7% | 78 | 27 | 98.6% |
| North Valley | $458,300 | 7.8% | 473 | 7.0% | 339 | 11.1% | 647 | 18 | 100.0% |
| Pacoima | $343,500 | 4.1% | 66 | 10.0% | 40 | 21.2% | 101 | 8 | 100.3% |
| Panorama City | $385,375 | 7.0% | 70 | -22.2% | 61 | 17.3% | 121 | 18 | 101.8% |
| Sherman Oaks | $810,000 | 25.6% | 181 | -10.8% | 188 | 28.8% | 270 | 25 | 98.7% |
| Silver Lake | $960,000 | 6.4% | 55 | 22.2% | 39 | 18.2% | 63 | 19 | 101.8% |
| South LA | $385,000 | 13.2% | 815 | 13.7% | 770 | -5.5% | 1,264 | 25 | 99.7% |
| South Valley | $540,000 | 8.2% | 1,300 | -6.0% | 1,194 | 16.9% | 1,895 | 23 | 98.9% |
| Studio City | $888,250 | 26.9% | 134 | 22.9% | 140 | 34.6% | 183 | 28 | 98.7% |
| Sun Valley | $440,000 | 11.4% | 70 | 4.5% | 46 | 7.0% | 84 | 15 | 98.9% |
| Sylmar | $400,000 | 9.6% | 119 | 4.4% | 93 | 25.7% | 186 | 20 | 99.2% |
| Tarzana | $590,000 | 3.7% | 116 | 22.1% | 105 | 9.4% | 162 | 22 | 98.2% |
| Valley Village | $687,500 | 6.2% | 44 | -15.4% | 36 | 56.5% | 56 | 27 | 99.1% |
| Van Nuys | $479,450 | 12.8% | 83 | -25.2% | 91 | 7.1% | 142 | 24 | 98.7% |
| Venice | $1,628,500 | 13.3% | 75 | -16.7% | 109 | 19.8% | 132 | 30 | 98.8% |
| Watts | $280,000 | 17.6% | 67 | 9.8% | 68 | 23.6% | 106 | 32 | 98.5% |
| West Adams | $510,000 | 17.2% | 38 | 2.7% | 18 | -35.7% | 44 | 14 | 102.3% |
| West Long Beach | $374,000 | 12.0% | 31 | -6.1% | 26 | -10.3% | 42 | 44 | 99.6% |
| West Los Angeles | $1,135,000 | 13.6% | 1,257 | -1.3% | 1,209 | 9.0% | 1,790 | 27 | 98.8% |
| Westwood | $885,000 | -1.1% | 75 | 2.7% | 109 | 13.5% | 154 | 42 | 96.4% |
| Woodland Hills | $683,000 | 6.3% | 173 | 0.6% | 181 | 27.5% | 275 | 24 | 98.5% |
| Los Angeles, CA | $590,000 | 14.6% | 1,717 | -2.5% | 5,579 | 10.3% | 3,616 | 28 | 99.5% |
See Redfin’s data center to find out what’s happening in other cities.
NOTE: Not all neighborhoods are listed, but totals for L.A. encompass entire city. Data is based on listing information and might not reflect all real estate activity in the market. Neighborhood-specific data is measured over the three months ended Feb 29. Inventory measures listings active as of Feb 29.
For more information, contact Redfin journalist services
Phone: 206-588-6863
Email: press@redfin.com
Want to receive reports like this every month? Click here to be added to our distribution list.

 United States
 Canada